| Title Least Cost Path Analysis (Michoacan, Mexico) | |||||||
|
Author Edelberto Vasquez American River College, Geography 350: Data Acquisition in GIS; Fall 2017 Contact Information (email: Edvasquez17@gmail.com) | |||||||
|
Abstract For my analysis I created a least cost path analysis in the state of Michoacan, Mexico in the town of El Platanal my hometown. The destination is a mountain peak (El Muerto) that has a cultural importance without an existent and well established path. Using a 30 meter DEM from the USGS and 2010 landcover data for the state of Michoacan, Mexico was used from the North American Land Change Monitoring which include; US, Canada, and Mexico agencies. After reclassifying and weighting the datasets I was. able to create two different paths from an origin point to the peak of El Muerto. One path included both the Landcover and slope weights while the best looking path only included the slope as the only weight. This Path appeared more beneficial because of the gentler slopes. | |||||||
|
Introduction Without a defined or an existent path to El Puerto Peak in the town of El platanal Michoacan, Mexico, that serves for cultural activities, ARCgis software and related technologies with a more science based approach was used to identify a least cost path. Two main data rasters (slope, Landuse) were used to achieve a cost raster. And eventually a least cost path to the Peak of El Muerto. | |||||||
|
Historical Background The traditions attached to El Muerto Peak revolve around the Day of the Dead celebrations. During this time it is custom for families to light candles for the recently passed. In my town however, it is very common for people to make small fires for their passed members. Overall as a town however, we have a tradition for making a big, like really big fire at the top of the peak. This is usually done by the young man of the town. 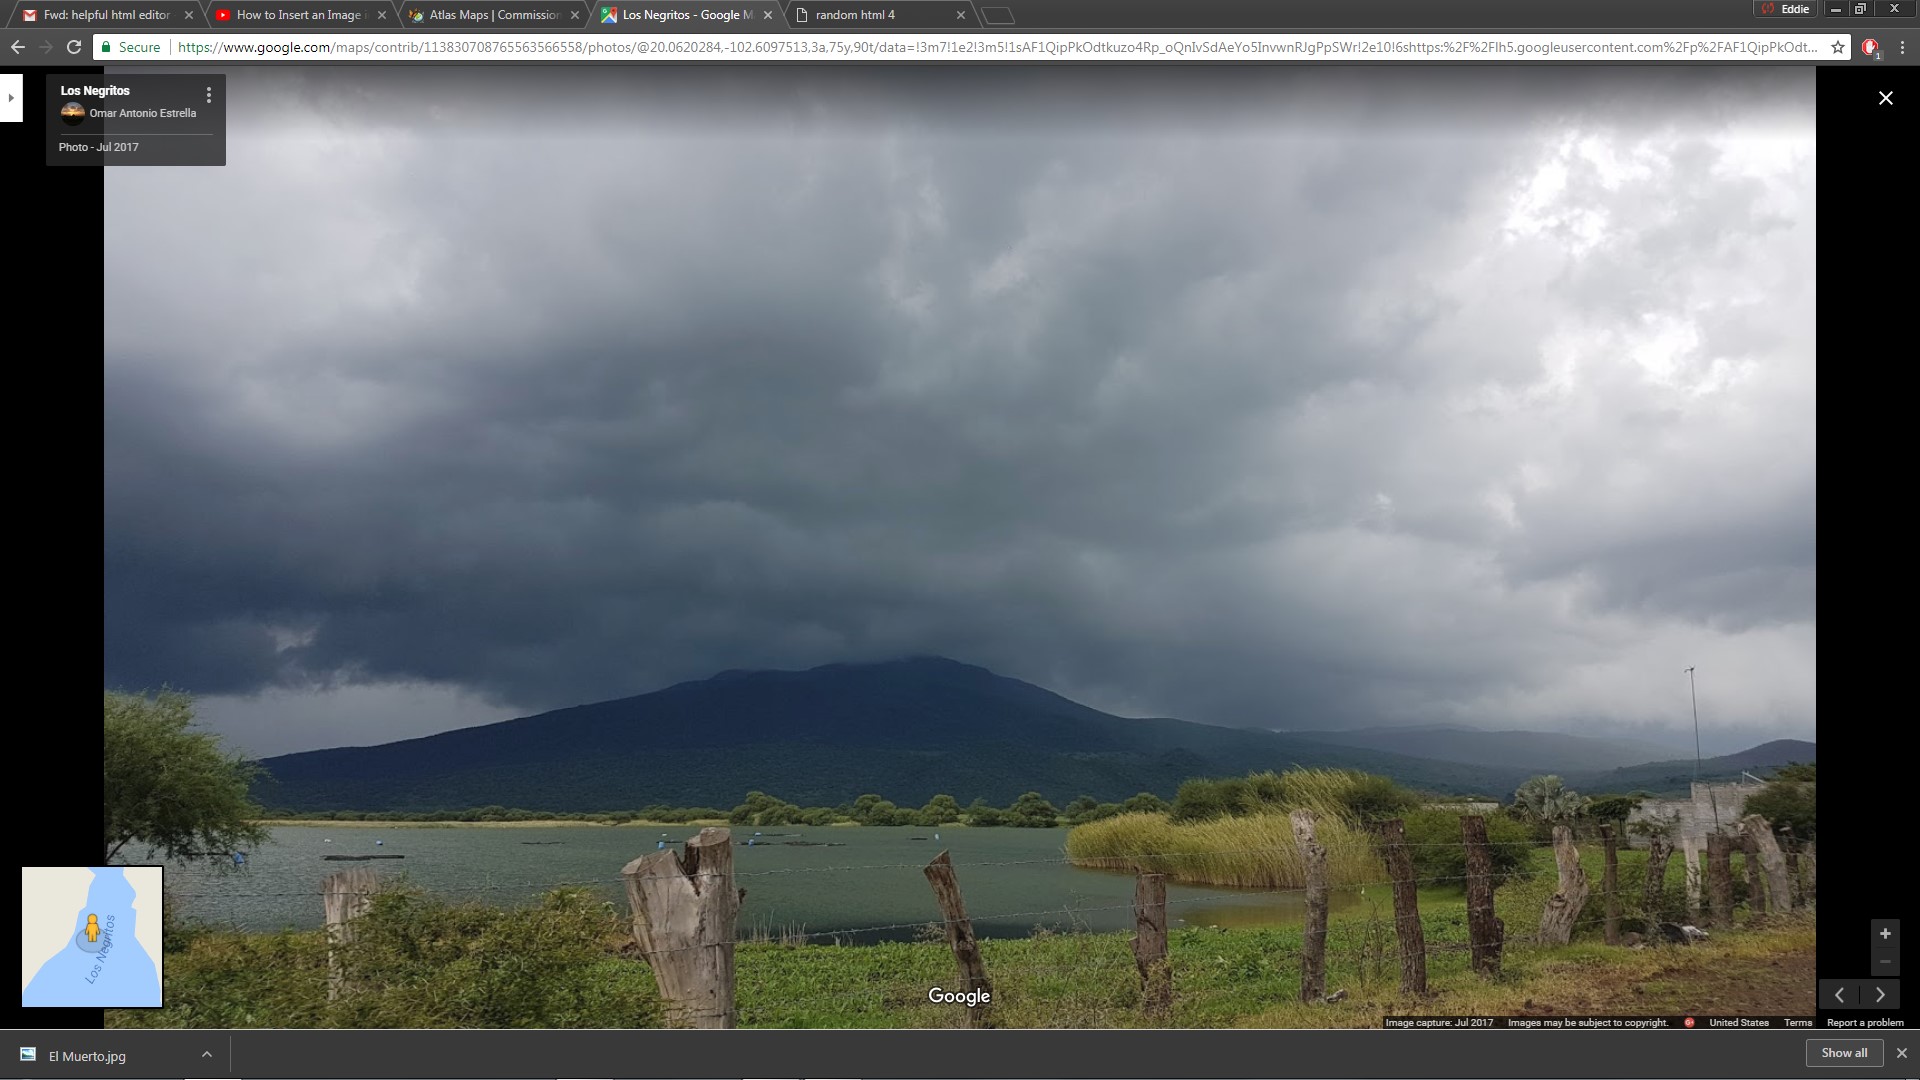 | |||||||
|
Methods Methods of collecting data was as it came, or what I was able to find. Dealing with an area outside the USA, DEMs are mainly available in 30x30 cell size. After that being the standard for my data, a landcover with the same cell size was acquired from the North American Land Change Monitoring. My DEM was from the USGS landsat imagery. Other data used was a point shapefile that contained the names of peak from Mexico from Insituto Nacional De Estadistica Geografica E Informatica (INEGI). 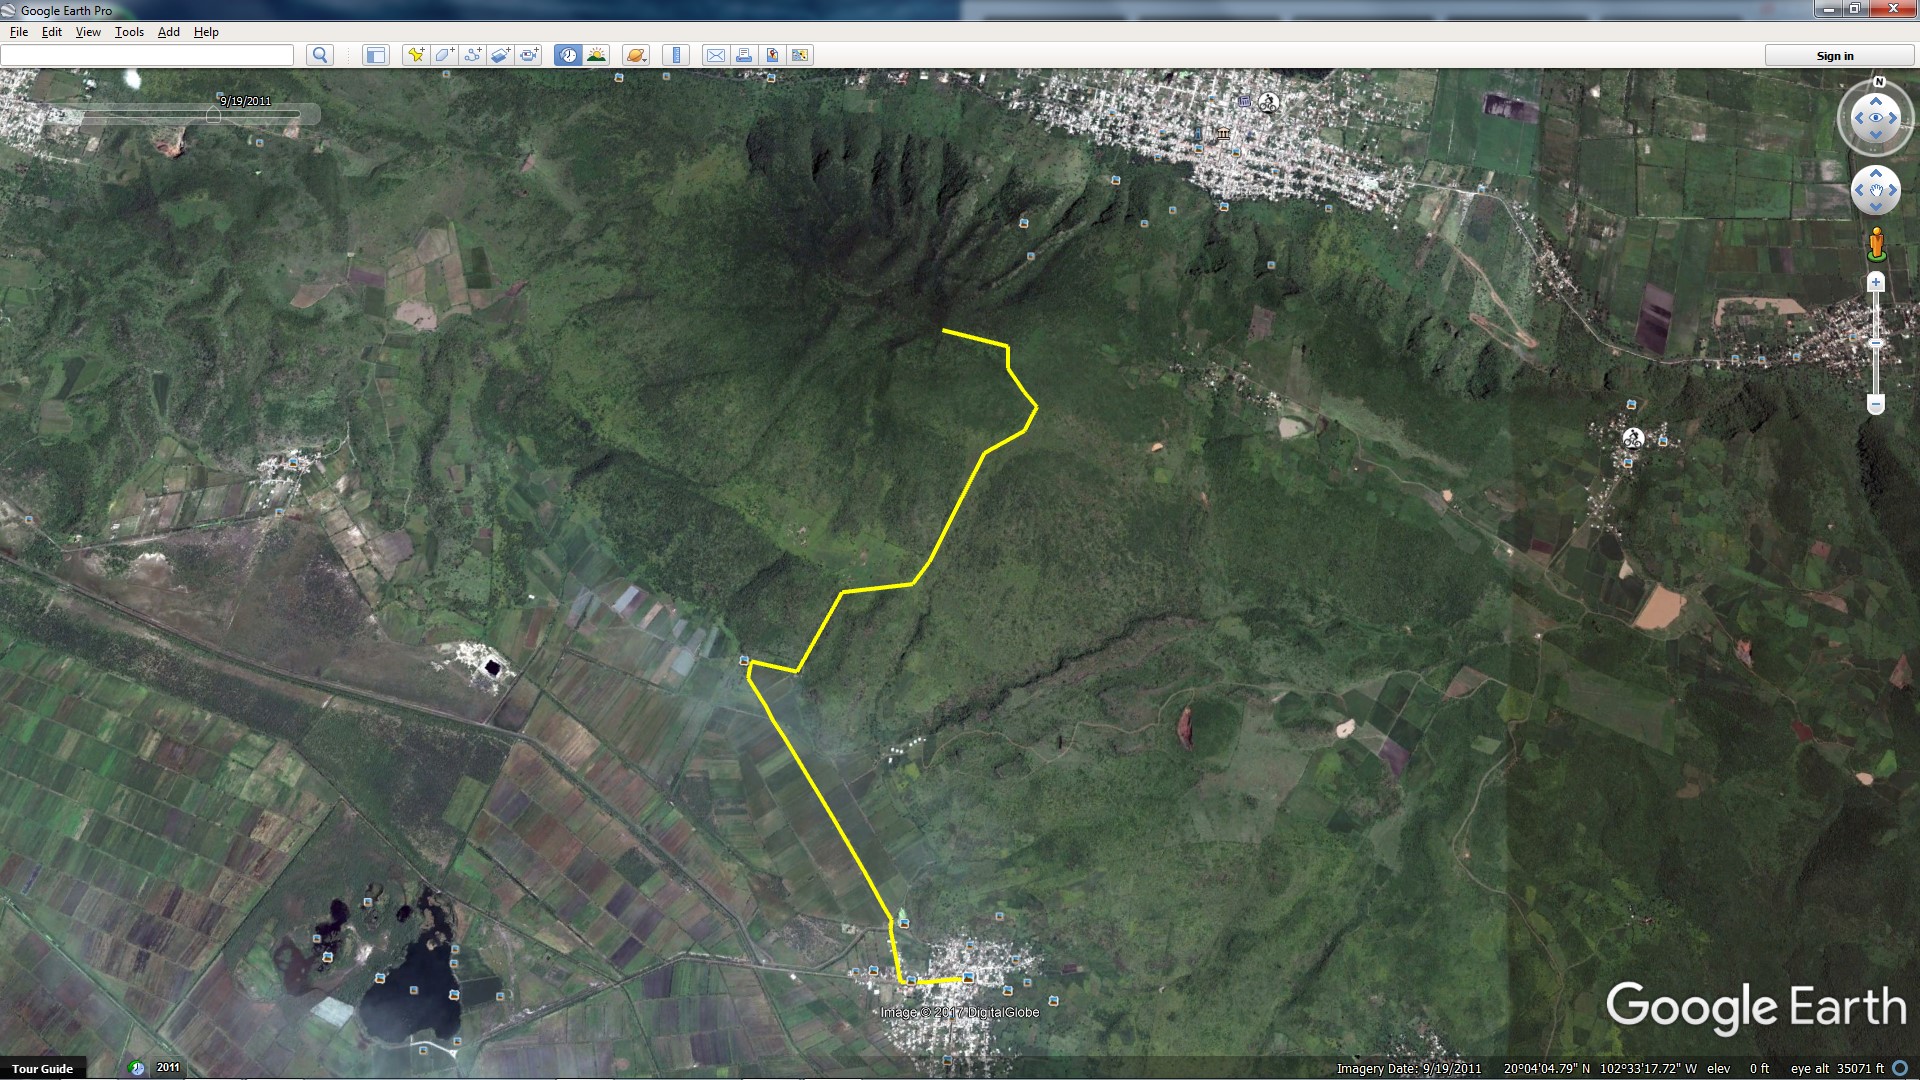 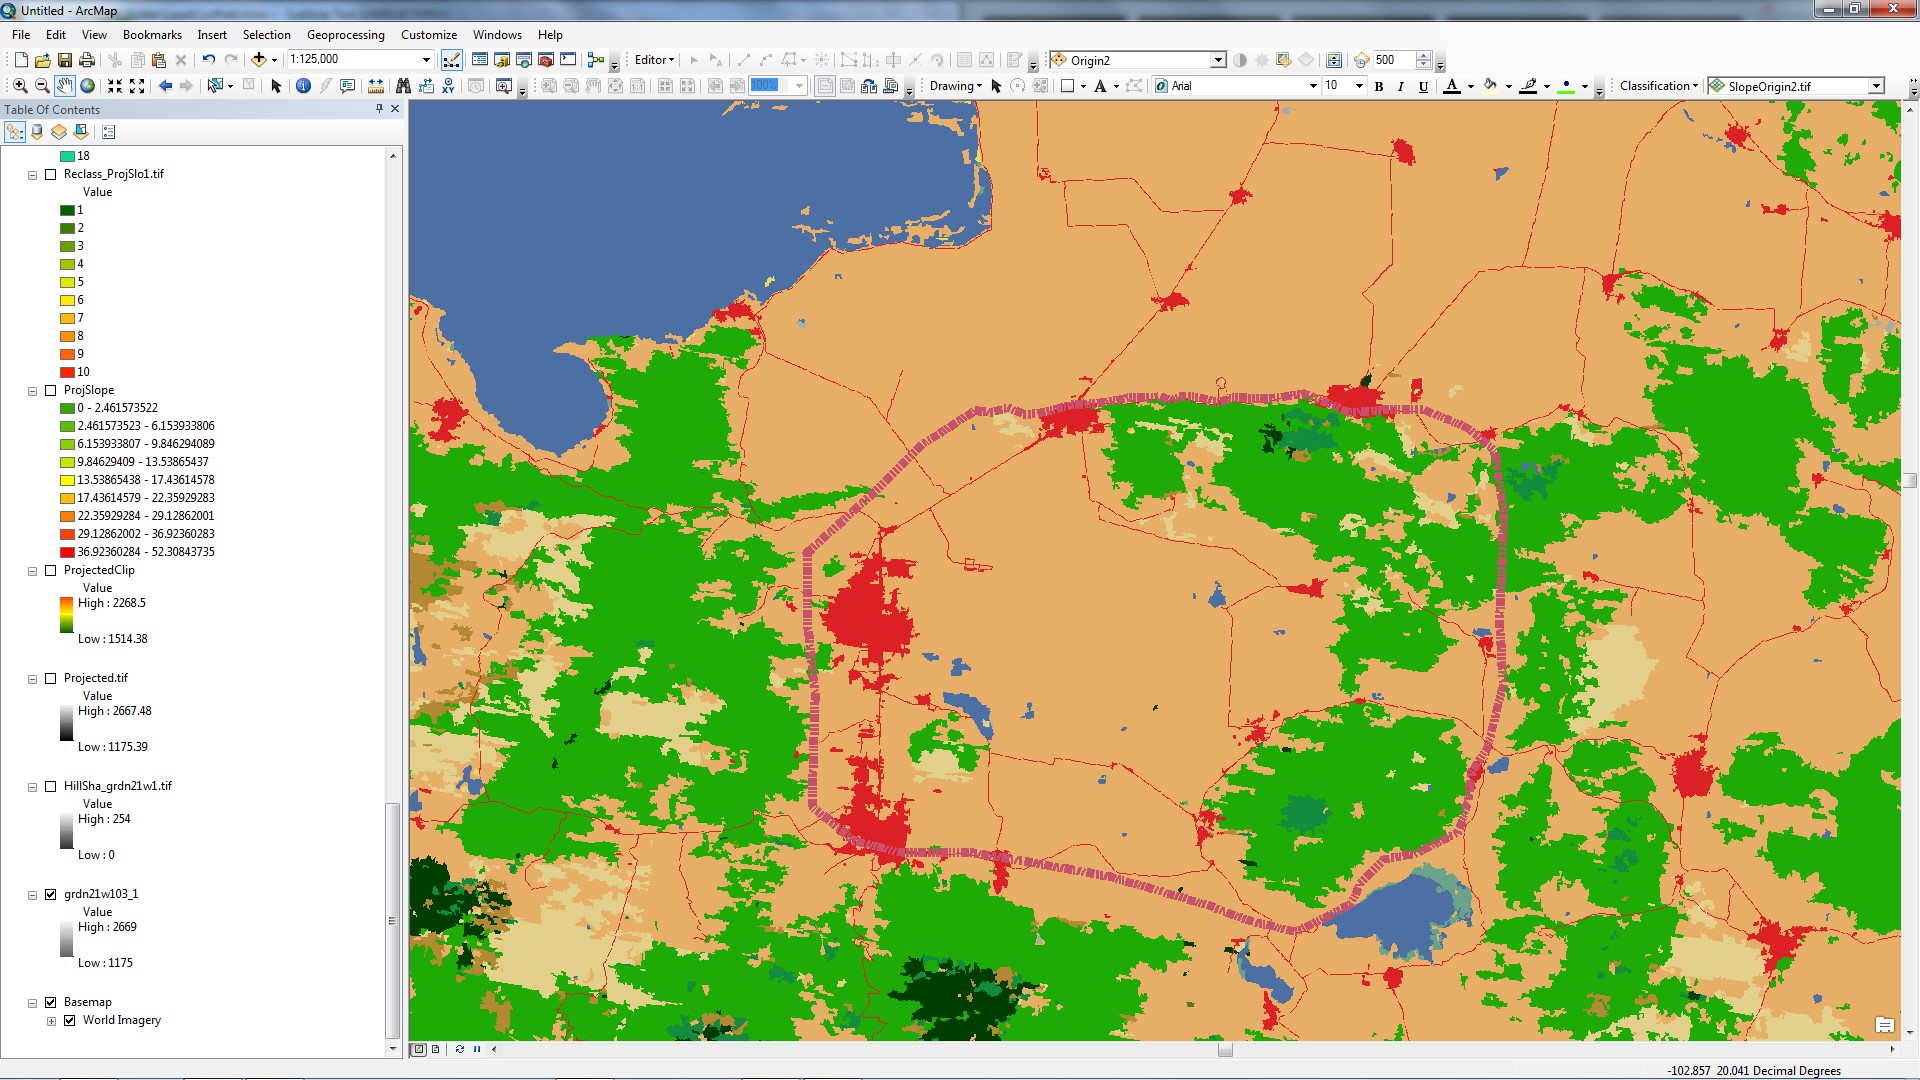 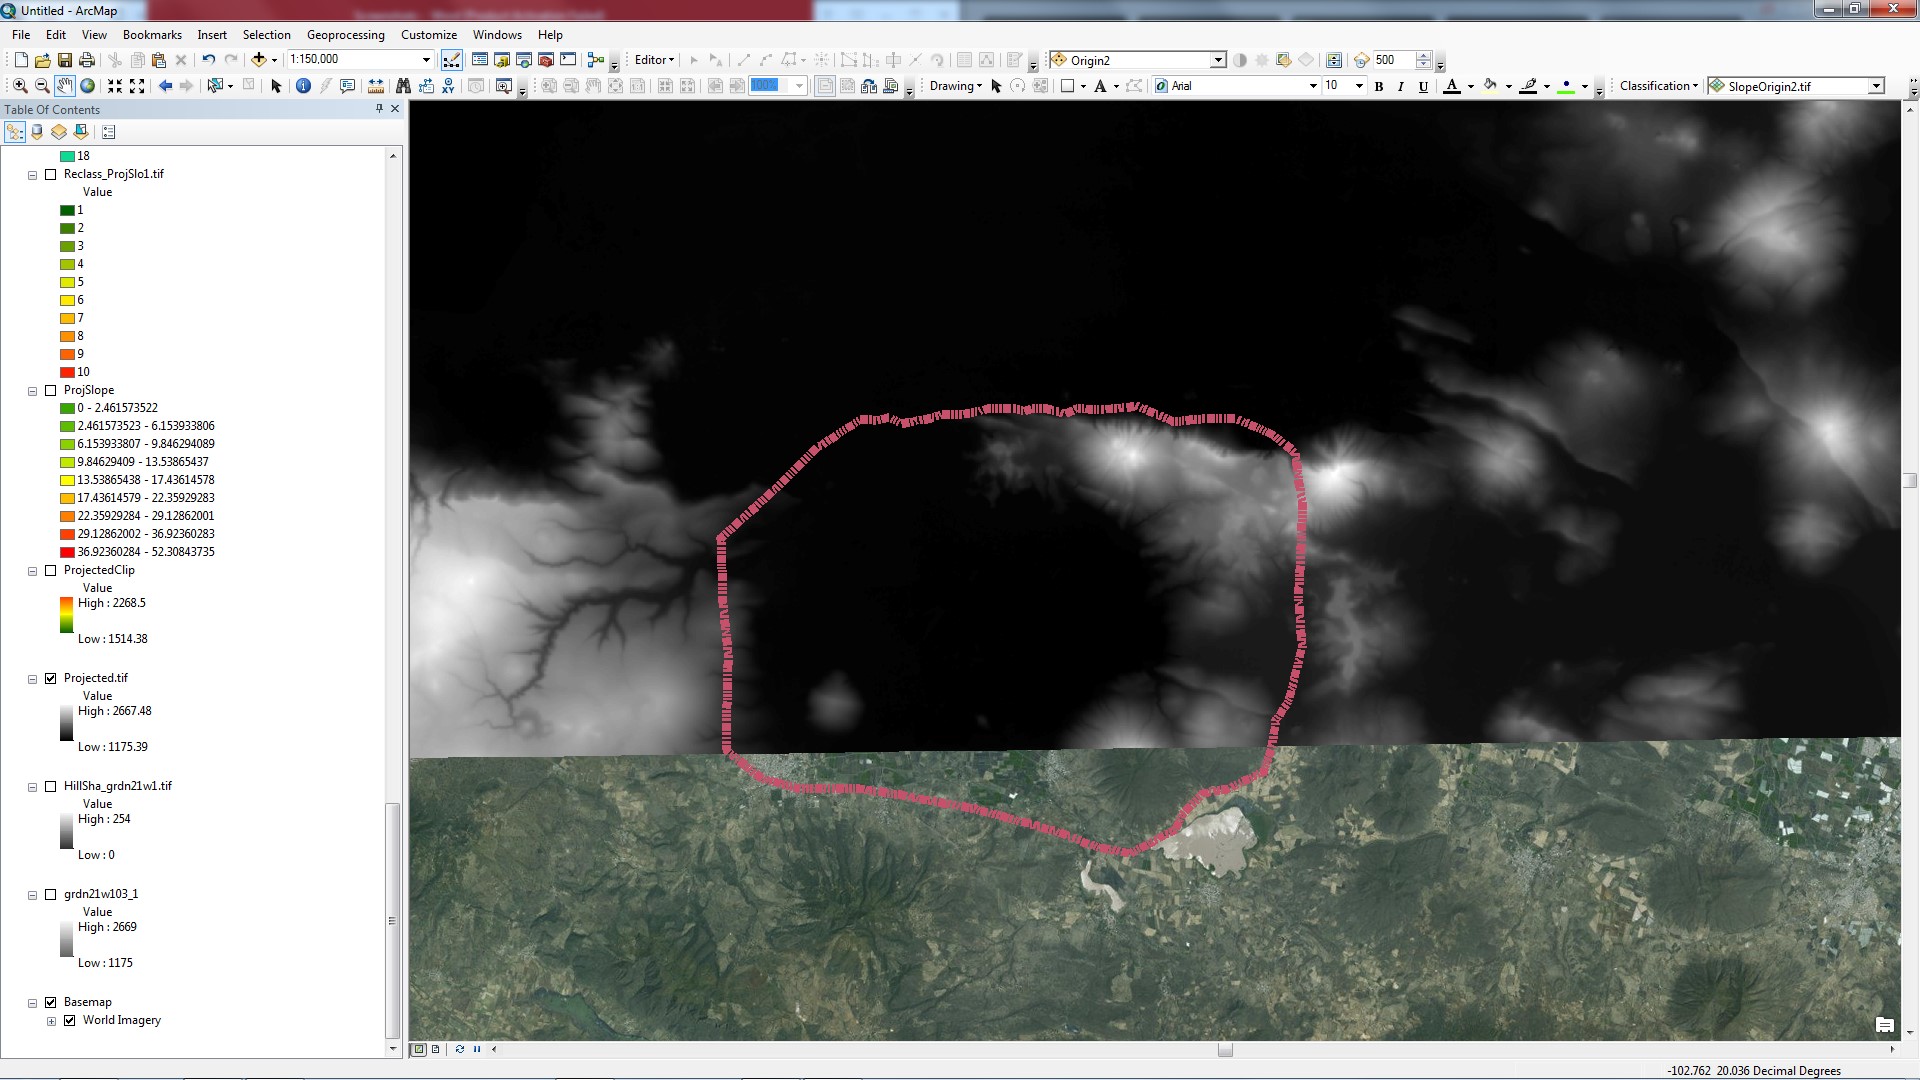 | |||||||
| After all the preprocessing steps, I created a polygon surrounding my area of interest, this polygon would also help in extracting my mask the DEM and landcover raster for processing intensity. After extracting the rasters, the DEM was used to create a slope raster. The next step was reclassify the slope into 10 categories of slope using the reclass tool. The Next step was to reclassify the landcover raster into 10 categories as well, this meant combining certain forests into one for the purpose of this study and to have equal categories that would be used to weight in the next step. After having two rasters with 10 categories, the next step was to weight using the weight overlay tool. The in levels of importance with an overall 100 and levels of cost 1-10 with a 1 intervals. Landcovers like wetlands, agriculture, and built were given higher cost, forests, barren were given lower. Importance given to slope was 70 with 30 for landcover. After getting the cost raster using the weight overlay tool, the cost distance and backlink were performed for the destination which was the El Muerto Peak using the Cost Distance tool. The final tool used was the cost path based on the cost distance, backlink, origin and destination. | |||||||
|
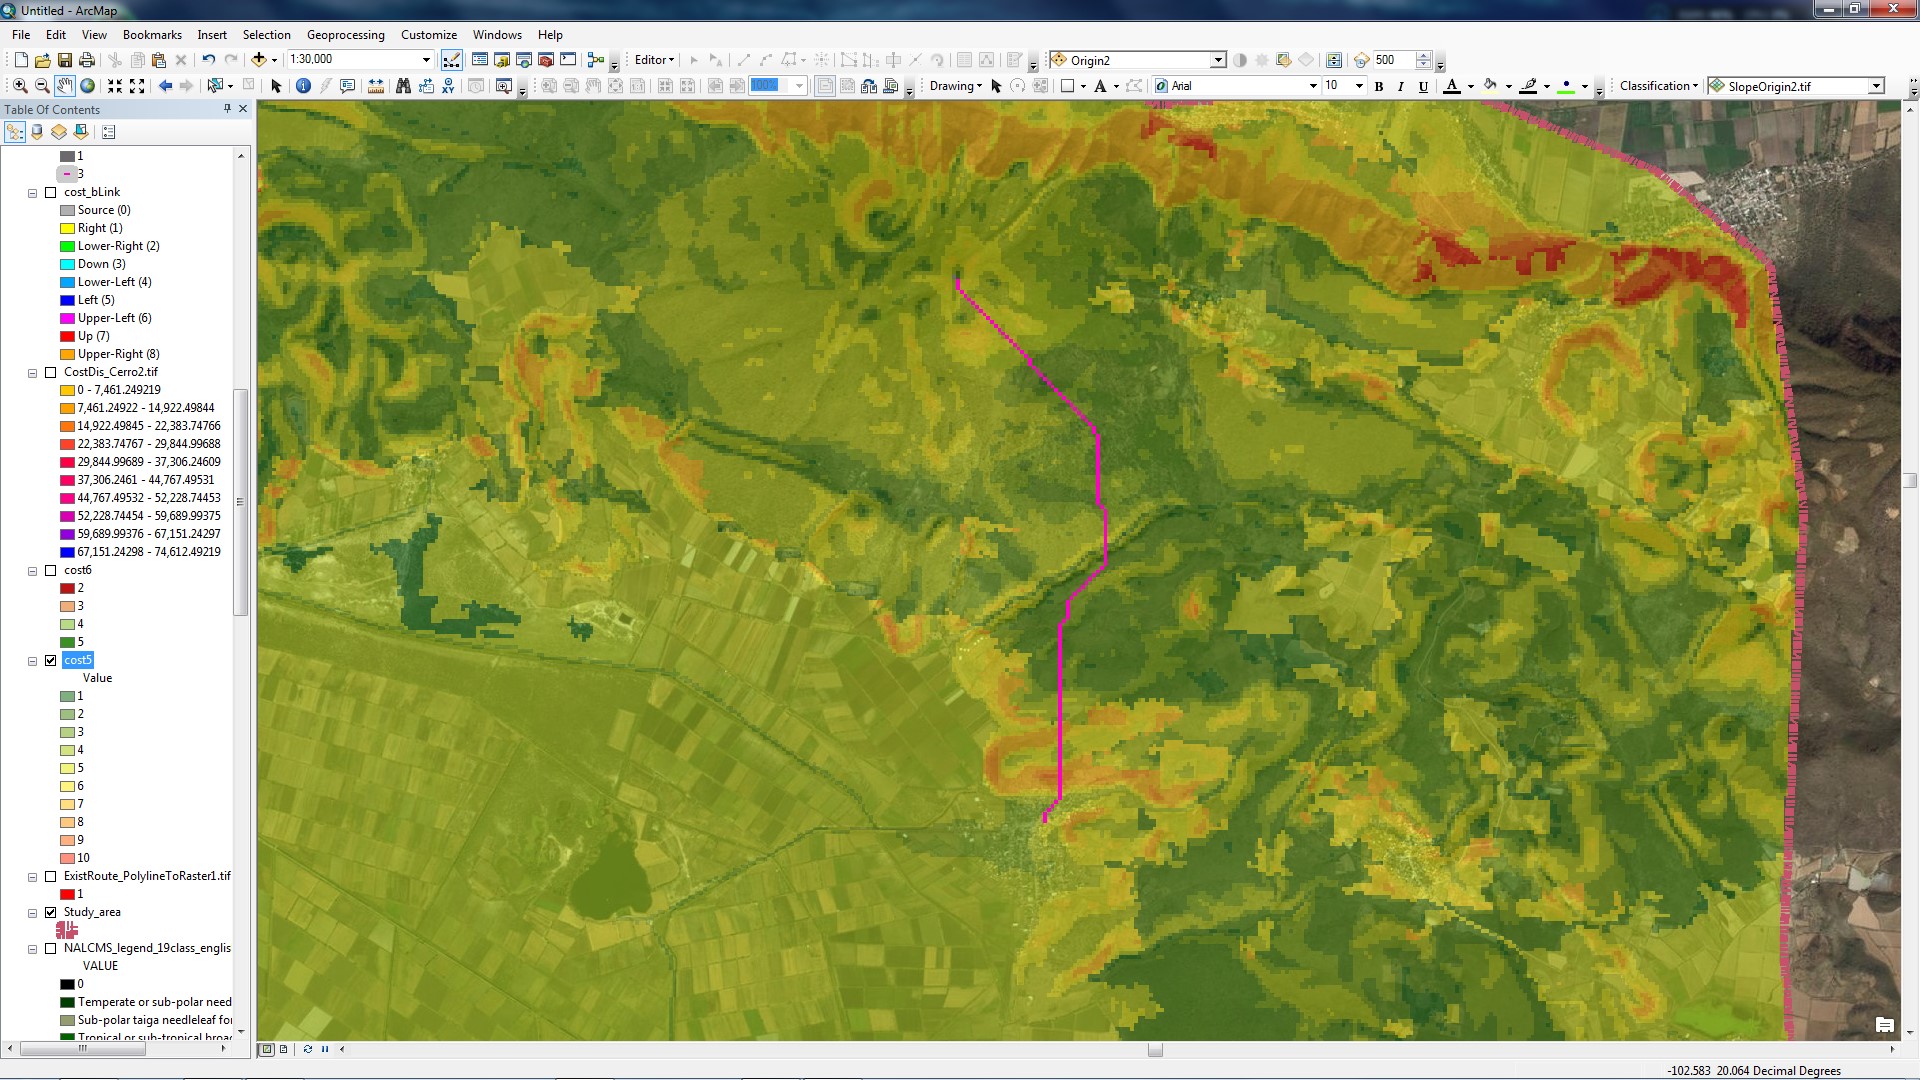
Results Result 1 ) slope (70 weight) landcover (30 weight) cost 1-10, Origin center of town plaza.
  Result 2 slope (70 weight) landcover (30 weight) cost 1-10, Origin end of dirt road edge of farmland. 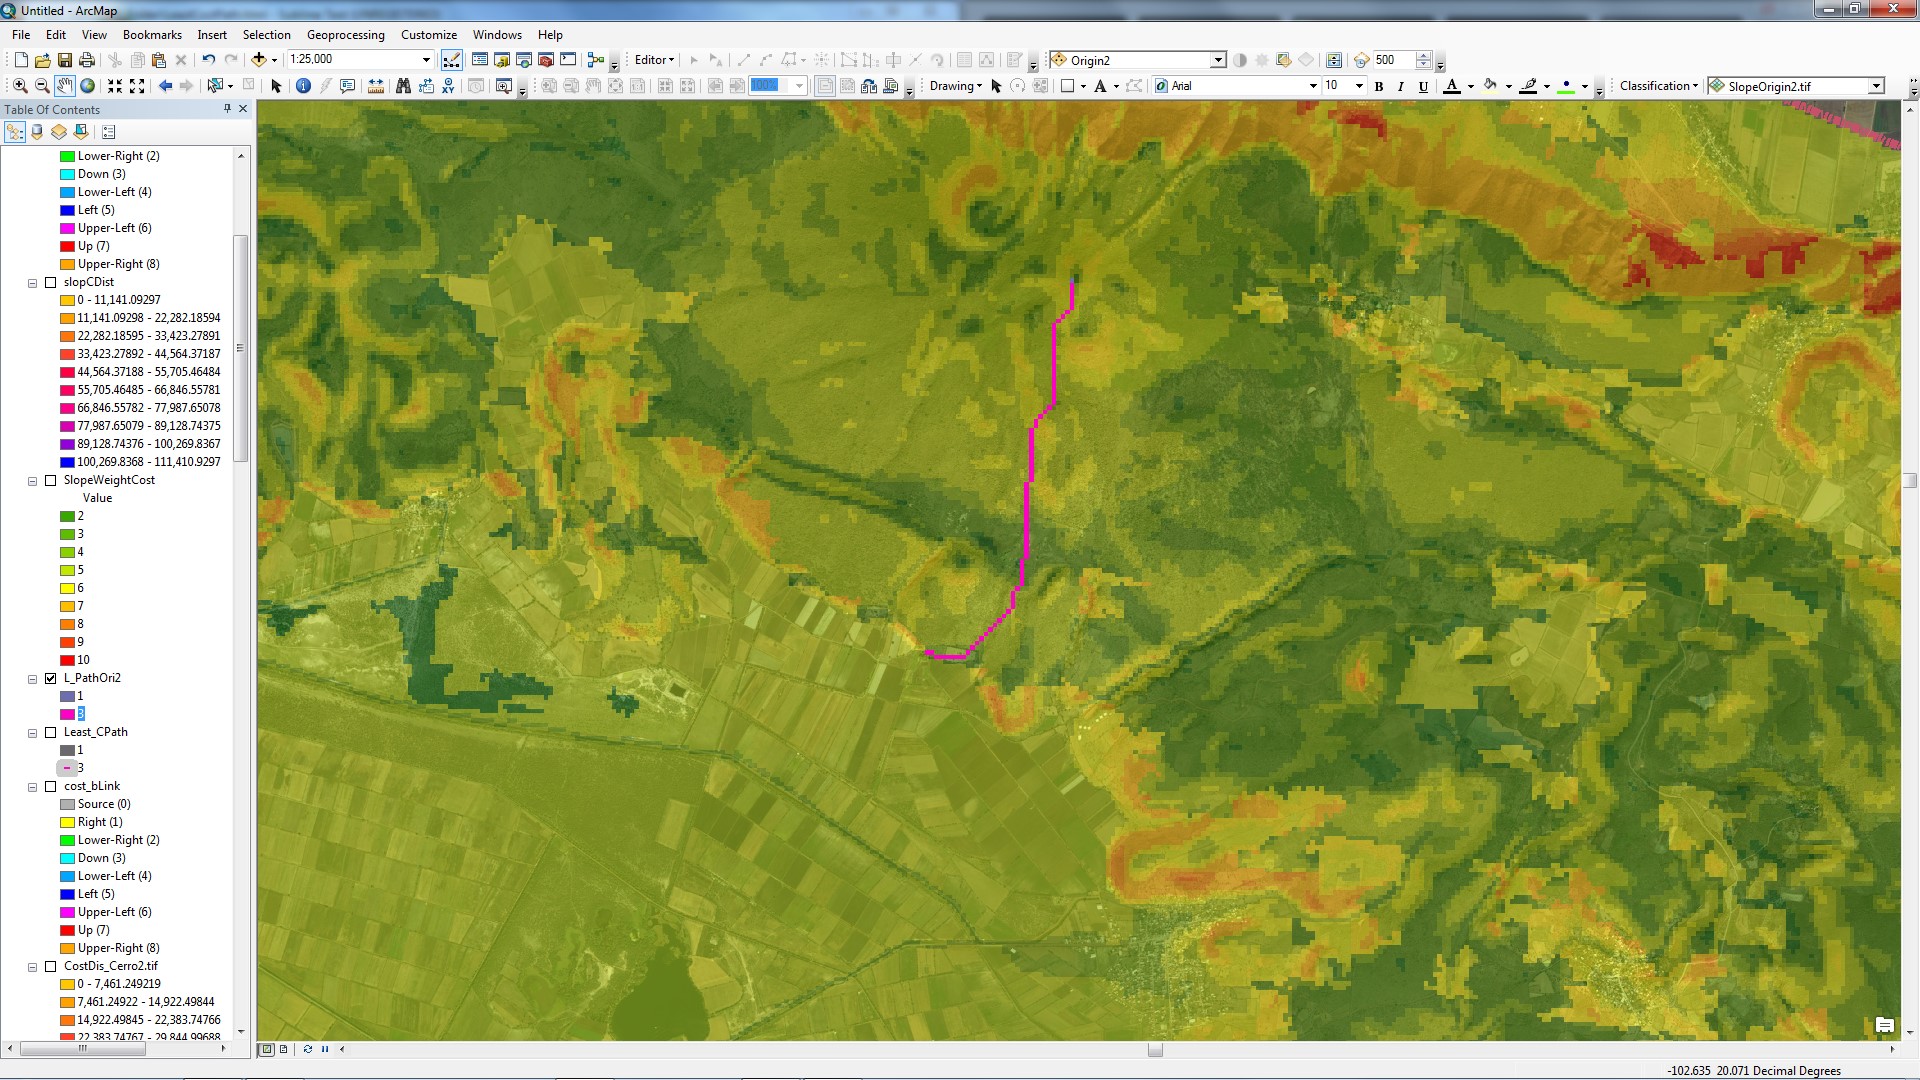 Results 3 slope (100 weight)
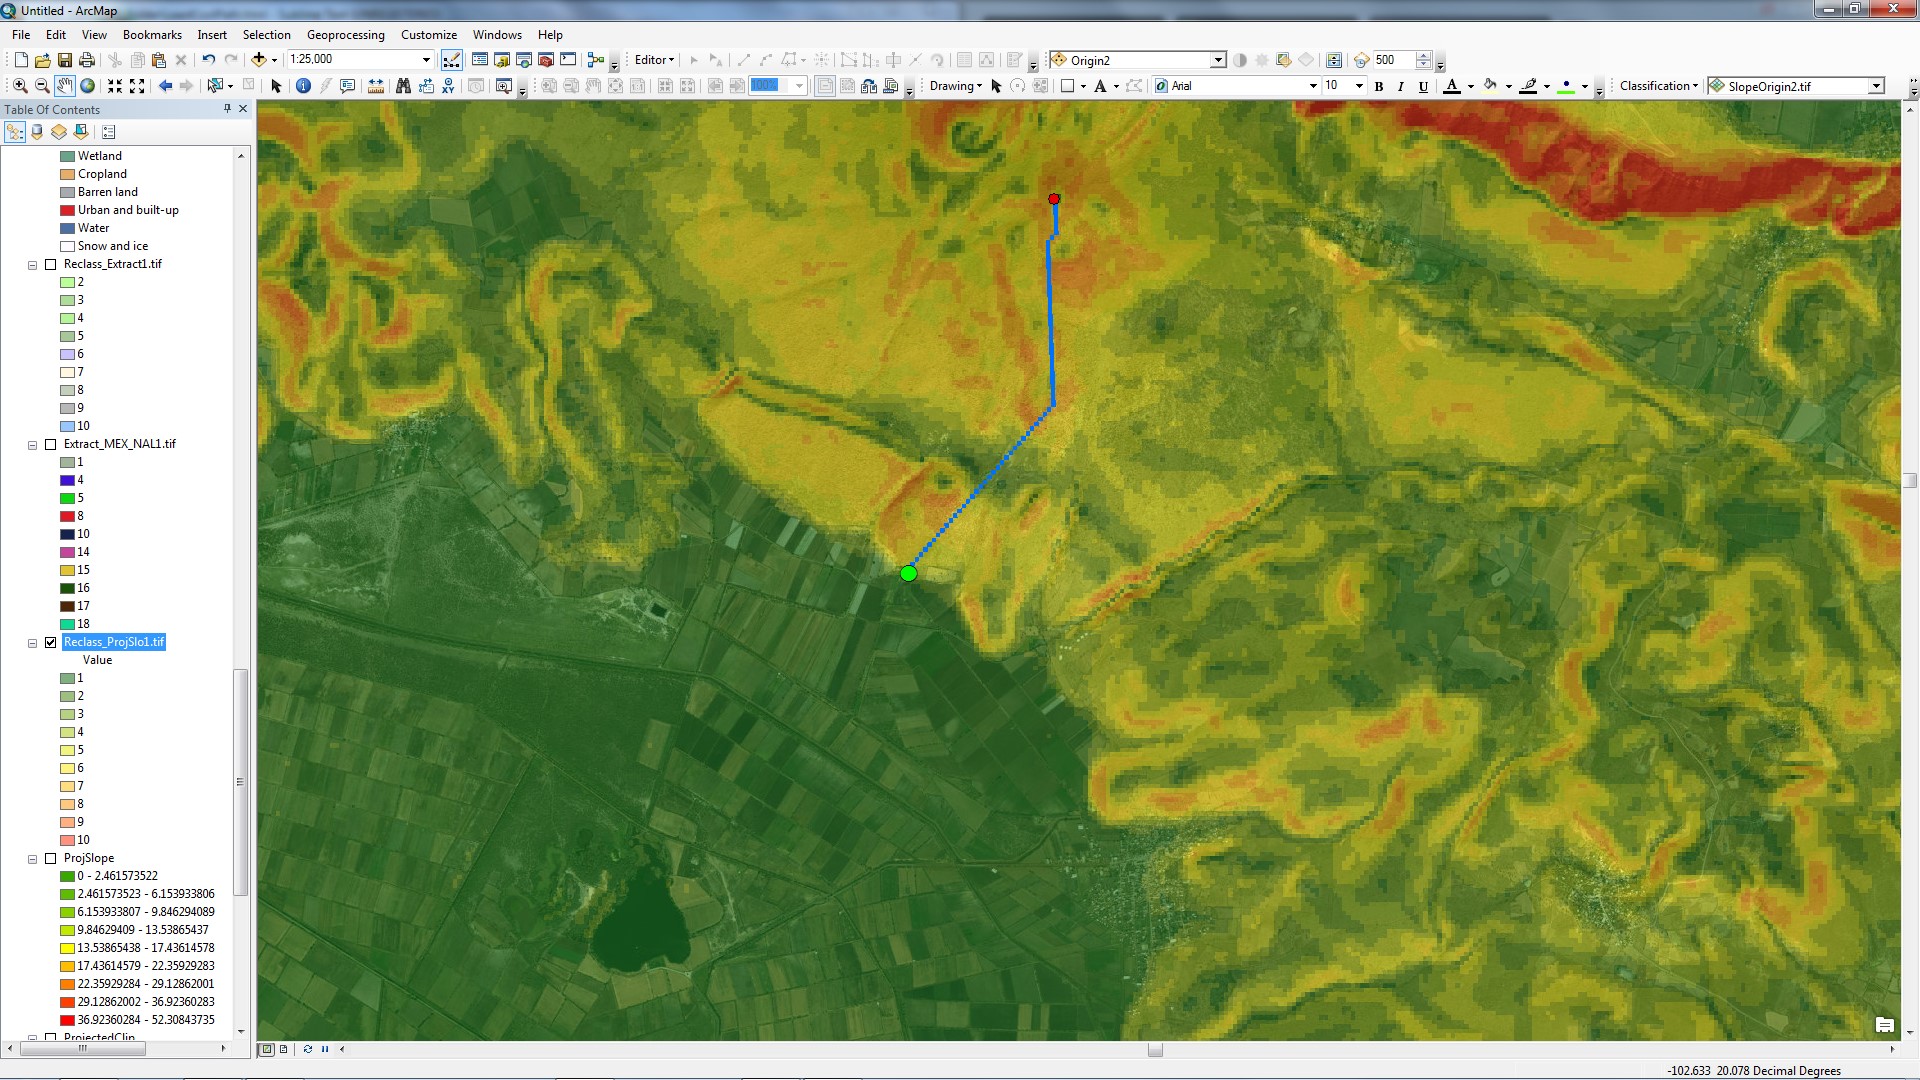
| Analysis Result 1 not practical, because of cost given to certain landuses and mainly origin point. Result 2 seemed more appropriate because of the weight it gives to landuses and the forests/ vegetation. Knowing the area however the vegetation is not much of an impedance as opposed to the slope. Result 3 I believe is ultimately the best path given that slope is going to be the greatest impedance. 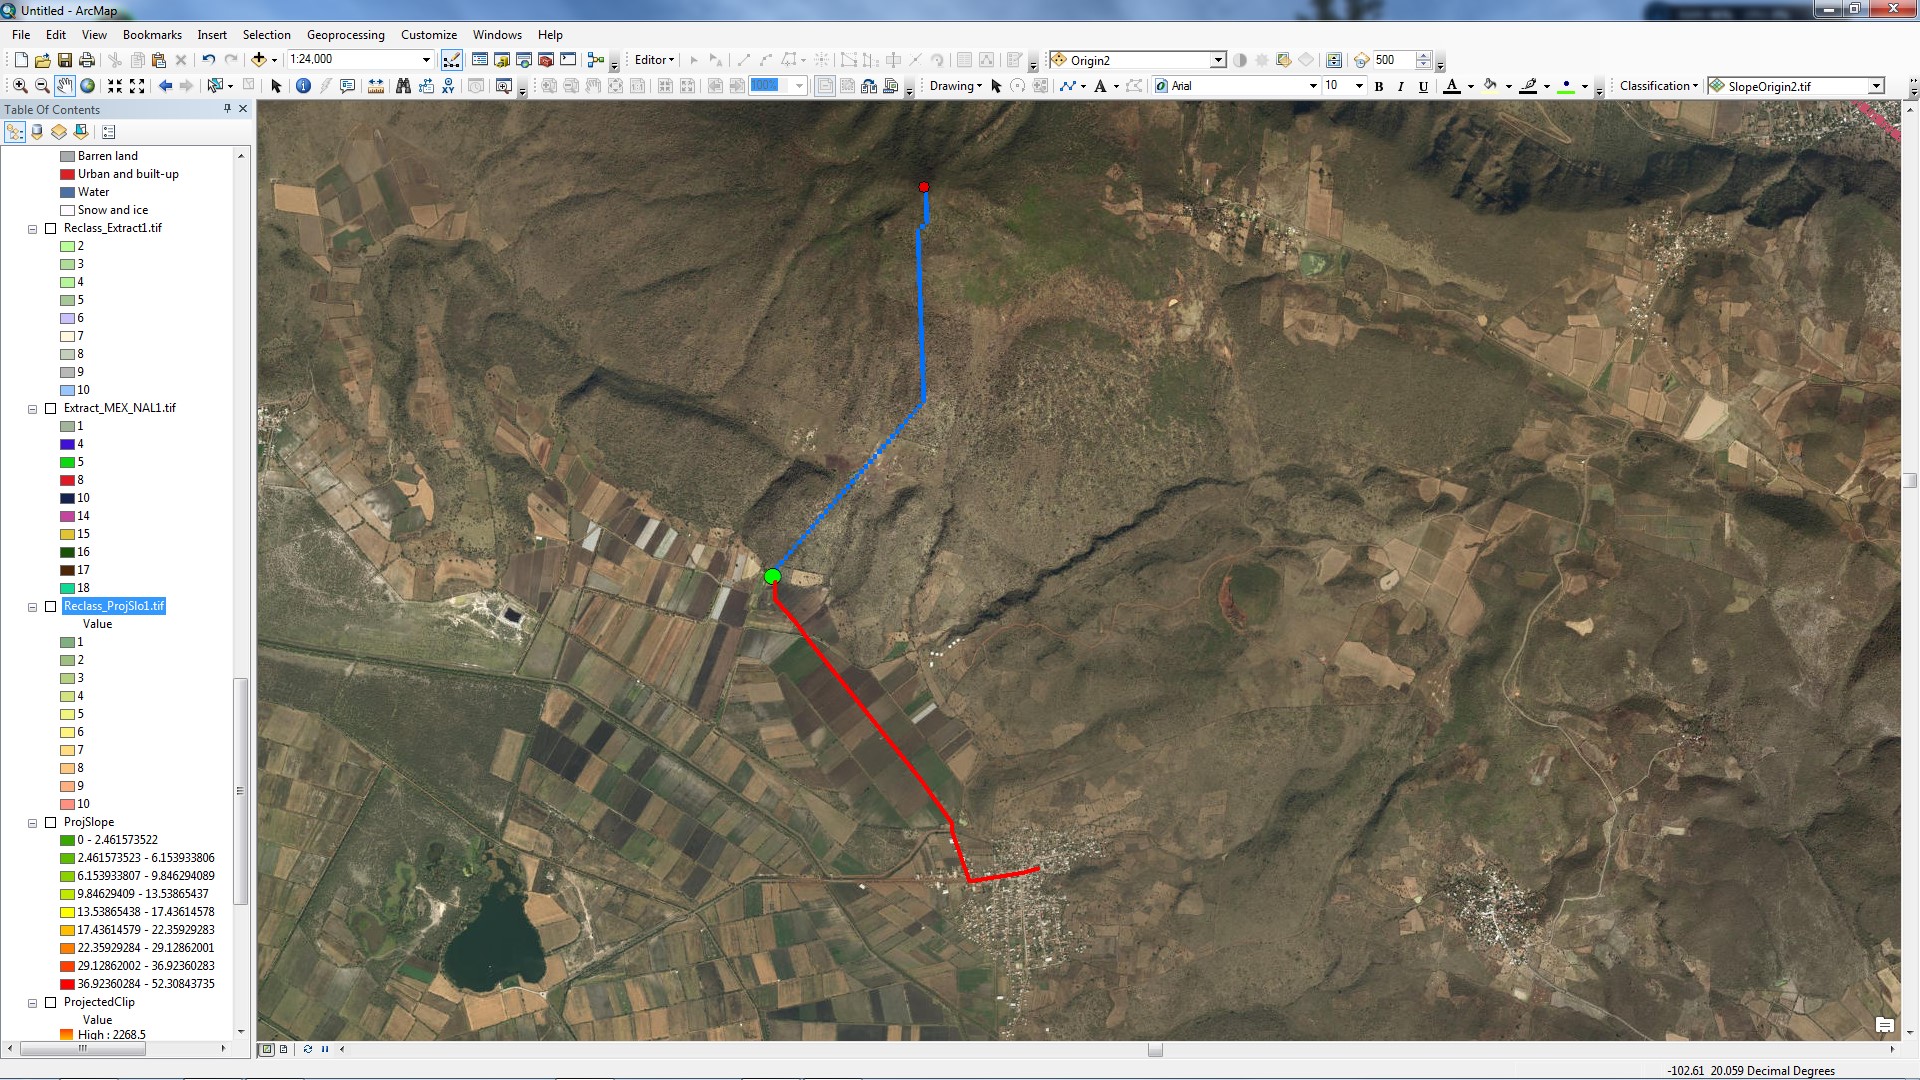
| Conclusions My solution would be to work more with the data to established a full path from the town using the existing dirt road that leads to the edge of the farmland.
| References USGS Earth Explorer, Insituto Nacional De Estadistica y Geografica, Commission for Environmental Cooperation Three countries working together to protect our shared environment | ||||