| Parcel Count |
7,197.00 |
5,618.00 |
19,901.00 |
2,091.00 |
597.00 |
244.00 |
240.00 |
76.00 |
11.00 |
15.00 |
1.00 |
| Average AREA (sq mile) |
6.38 |
1.85 |
2.67 |
12.12 |
18.54 |
20.50 |
15.22 |
9.32 |
4.26 |
5.30 |
22.75 |
| SD AREA (sq mile) |
80.11 |
22.44 |
35.47 |
88.86 |
105.49 |
80.54 |
76.28 |
30.31 |
8.65 |
10.62 |
0.00 |
| Minimum Population |
0.00 |
0.00 |
0.00 |
0.00 |
0.00 |
0.00 |
0.00 |
0.00 |
0.00 |
0.00 |
0.00 |
| Max Population |
18,080.00 |
10,244.00 |
14,465.00 |
11,893.00 |
6,643.00 |
8,348.00 |
5,849.00 |
9,340.00 |
1,157.00 |
525.00 |
0.00 |
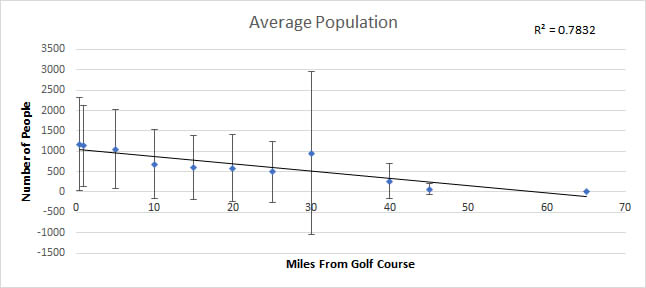
| Average Population |
1,176.35 |
1,129.47 |
1,053.86 |
684.12 |
607.56 |
588.38 |
490.85 |
955.18 |
266.09 |
64.40 |
0.00 |
| Total Population |
8,466,174.00 |
6,345,363.00 |
20,972,883.00 |
1,430,490.00 |
362,713.00 |
143,565.00 |
117,804.00 |
72,594.00 |
2,927.00 |
966.00 |
0.00 |
| SD Population |
1,145.08 |
991.70 |
977.48 |
844.62 |
789.02 |
825.66 |
748.07 |
1,995.45 |
425.04 |
137.31 |
0.00 |
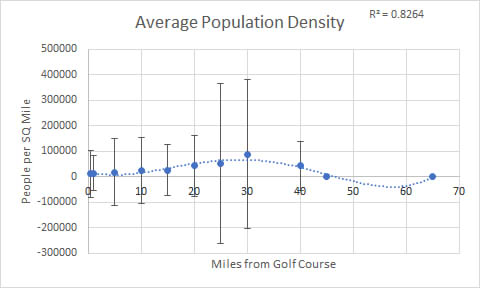
| Average Population density (people/sq mile) |
11,626.16 |
14,567.08 |
18,457.53 |
24,928.24 |
25,528.46 |
42,704.65 |
51,480.83 |
87,843.01 |
43,057.97 |
343.06 |
0.00 |
| SD Population density |
91,726.71 |
67,614.15 |
132,881.51 |
128,467.29 |
100,929.21 |
119,214.04 |
313,422.46 |
292,323.67 |
96,319.56 |
1,312.46 |
0.00 |
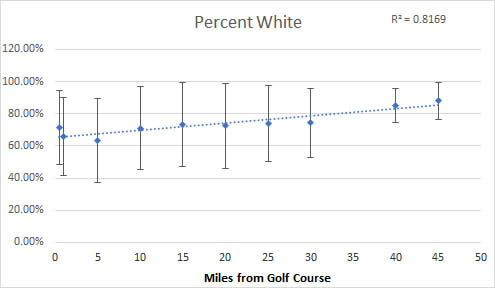
| Average Percent White |
71.35 |
65.83 |
63.25 |
71.12 |
73.49 |
72.43 |
74.09 |
74.27 |
85.25 |
88.02 |
0.00 |
| SD Percent White |
23.15 |
24.33 |
26.02 |
25.98 |
25.97 |
26.20 |
23.65 |
21.47 |
10.70 |
11.34 |
0.00 |
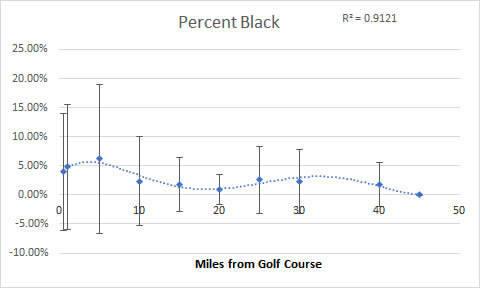
| Average Percent Black |
3.94 |
4.86 |
6.23 |
2.35 |
1.76 |
0.96 |
2.59 |
2.35 |
1.75 |
0.04 |
0.00 |
| SD Percent Black |
10.06 |
10.75 |
12.82 |
7.61 |
4.62 |
2.57 |
5.79 |
5.51 |
3.81 |
0.09 |
0.00 |
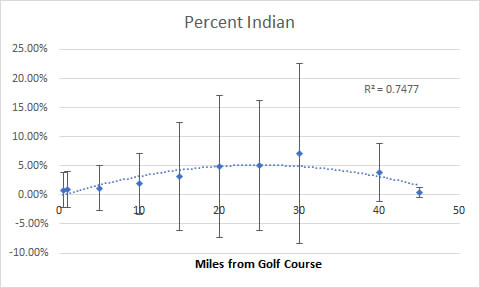
| Average Percent Indian |
0.83 |
0.92 |
1.17 |
1.90 |
3.12 |
4.85 |
5.06 |
7.11 |
3.82 |
0.38 |
0.00 |
| SD Percent Indian |
2.96 |
3.06 |
3.94 |
5.29 |
9.28 |
12.19 |
11.15 |
15.42 |
4.96 |
0.85 |
0.00 |
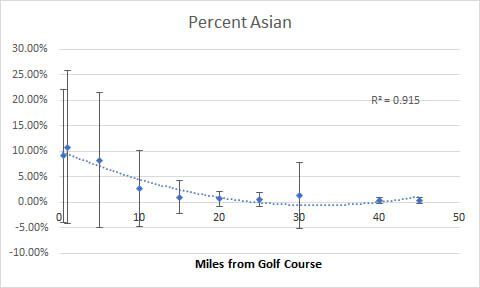
| Average Percent Asian |
9.07 |
10.83 |
8.25 |
2.72 |
1.00 |
0.68 |
0.48 |
1.23 |
0.27 |
0.27 |
0.00 |
| SD Percent Asian |
13.09 |
15.10 |
13.22 |
7.52 |
3.27 |
1.46 |
1.35 |
6.49 |
0.60 |
0.60 |
0.00 |
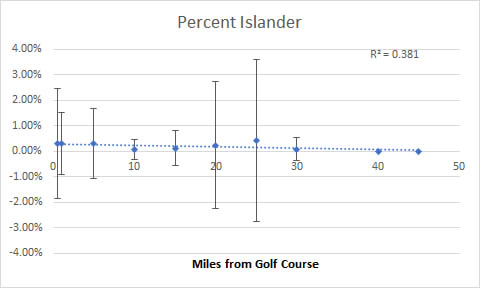
| Average Percent Islander |
0.31 |
0.31 |
0.30 |
0.06 |
0.12 |
0.24 |
0.42 |
0.09 |
0.00 |
0.00 |
0.00 |
| SD Percent Islander |
2.16 |
1.23 |
1.39 |
0.38 |
0.68 |
2.50 |
3.18 |
0.46 |
0.00 |
0.00 |
0.00 |
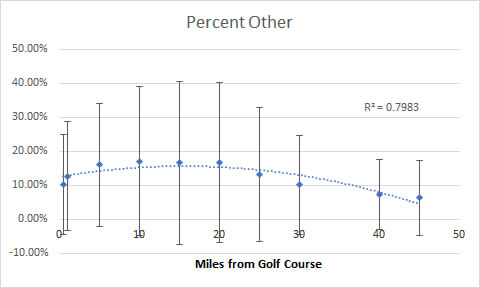
| Average Percent Other |
10.13 |
12.70 |
15.98 |
17.09 |
16.55 |
16.82 |
13.17 |
10.18 |
7.35 |
6.27 |
0.00 |
| SD Percent Other |
14.78 |
16.00 |
18.20 |
21.92 |
23.92 |
23.58 |
19.75 |
14.59 |
10.27 |
10.96 |
0.00 |
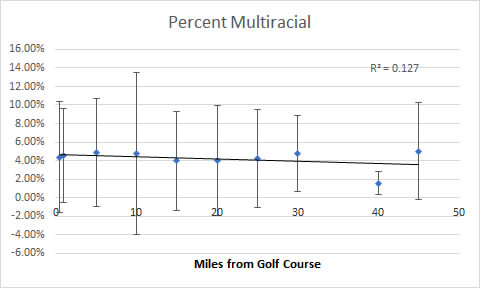
| Average Percent Multiracial |
4.38 |
4.55 |
4.82 |
4.75 |
3.95 |
4.02 |
4.19 |
4.77 |
1.57 |
5.02 |
0.00 |
| SD Percent Multiracial |
5.99 |
5.07 |
5.83 |
8.72 |
5.38 |
5.92 |
5.29 |
4.08 |
1.29 |
5.22 |
0.00 |
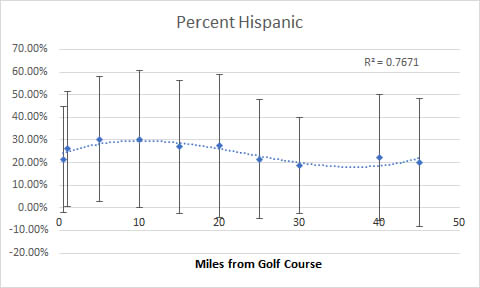
| Average Percent Hispanic |
21.45 |
26.06 |
30.37 |
30.40 |
26.98 |
27.48 |
21.52 |
18.69 |
22.12 |
20.08 |
0.00 |
| SD Percent Hispanic |
23.41 |
25.48 |
27.77 |
30.42 |
29.28 |
31.60 |
26.39 |
21.30 |
27.76 |
28.32 |
0.00 |
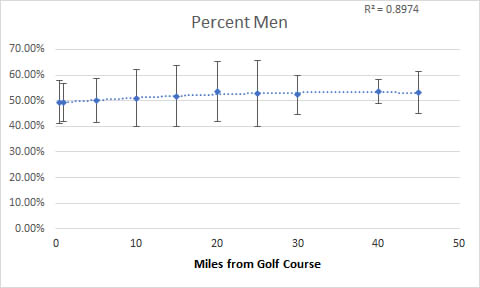
| Average Percent Male |
49.47 |
49.43 |
49.96 |
51.01 |
51.75 |
53.70 |
52.67 |
52.34 |
53.53 |
53.10 |
0.00 |
| SD Percent Male |
8.26 |
7.38 |
8.51 |
11.09 |
11.90 |
11.64 |
12.89 |
7.54 |
4.77 |
8.27 |
0.00 |
| Average Percent Female |
50.53 |
50.57 |
50.04 |
48.99 |
48.25 |
46.30 |
47.33 |
47.66 |
46.47 |
46.90 |
0.00 |
| SD Percent Female |
8.26 |
7.38 |
8.51 |
11.09 |
11.90 |
11.64 |
12.89 |
7.54 |
4.77 |
8.27 |
0.00 |
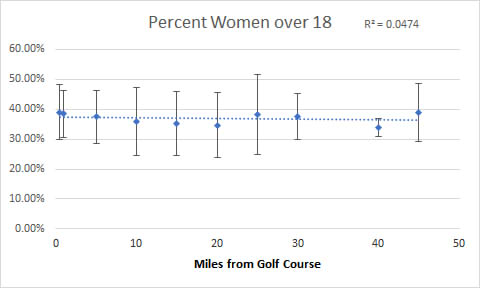
| Ave_PER_F18PLUS |
38.92 |
38.41 |
37.43 |
36.01 |
35.34 |
34.71 |
38.15 |
37.58 |
33.96 |
38.87 |
0.00 |
| SD_PER_F18PLUS |
9.19 |
7.98 |
8.96 |
11.42 |
10.71 |
11.02 |
13.36 |
7.83 |
3.04 |
9.67 |
0.00 |
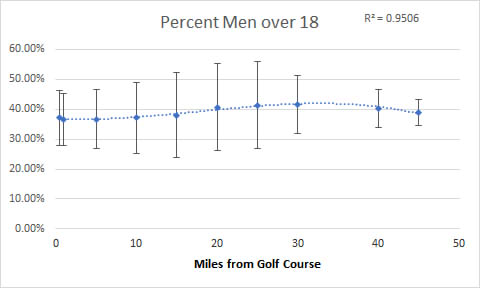
| Ave_PER_M18PLUS |
37.14 |
36.63 |
36.59 |
37.16 |
38.05 |
40.71 |
41.40 |
41.67 |
40.25 |
38.88 |
0.00 |
| SD_PER_M18PLUS |
9.17 |
8.64 |
9.89 |
11.82 |
14.14 |
14.50 |
14.54 |
9.67 |
6.21 |
4.25 |
0.00 |
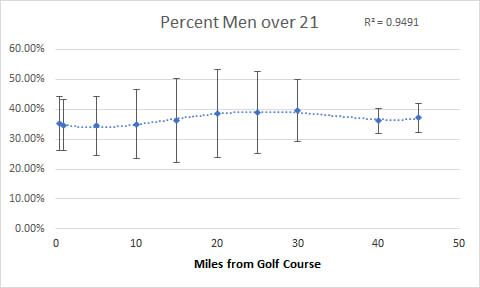
| Ave_PER_M21PLUS |
35.18 |
34.61 |
34.45 |
35.03 |
36.26 |
38.63 |
38.92 |
39.56 |
36.09 |
37.13 |
0.00 |
| SD_PER_M21PLUS |
9.02 |
8.56 |
9.91 |
11.64 |
14.15 |
14.74 |
13.67 |
10.29 |
4.18 |
4.93 |
0.00 |
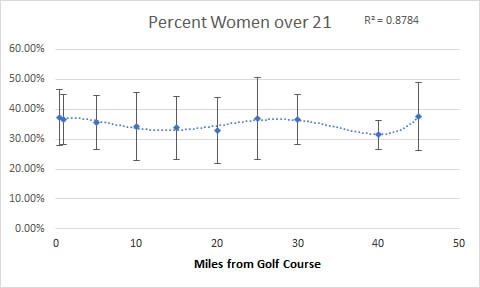
| Ave_PER_F21PLUS |
37.25 |
36.58 |
35.51 |
34.27 |
33.81 |
32.95 |
36.84 |
36.69 |
31.39 |
37.69 |
0.00 |
| SD_PER_F21PLUS |
9.47 |
8.22 |
9.12 |
11.44 |
10.60 |
11.07 |
13.73 |
8.34 |
4.91 |
11.42 |
0.00 |
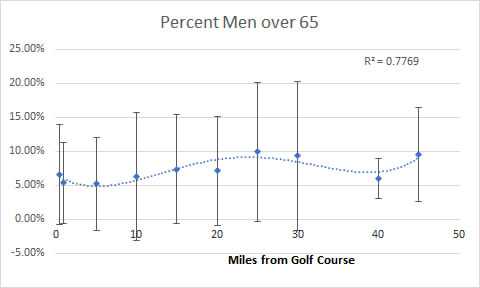
| Ave_PER_M65PLUS |
6.55 |
5.33 |
5.20 |
6.29 |
7.37 |
7.14 |
9.91 |
9.36 |
5.99 |
9.54 |
0.00 |
| SD_PER_M65PLUS |
7.34 |
5.93 |
6.87 |
9.45 |
8.03 |
8.04 |
10.19 |
10.97 |
2.95 |
6.88 |
0.00 |
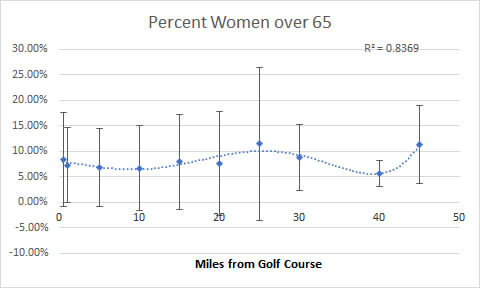
| Ave_PER_F65PLUS |
8.38 |
7.22 |
6.77 |
6.69 |
7.91 |
7.61 |
11.46 |
8.72 |
5.65 |
11.30 |
0.00 |
| SD_PER_F65PLUS |
9.31 |
7.37 |
7.71 |
8.32 |
9.33 |
10.14 |
15.02 |
6.45 |
2.48 |
7.65 |
0.00 |
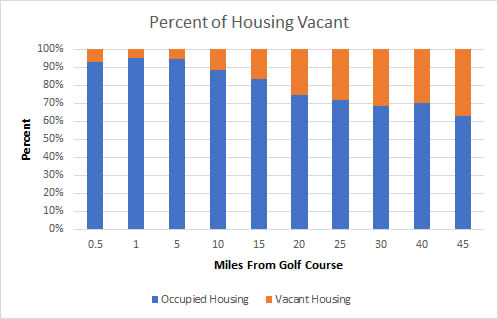
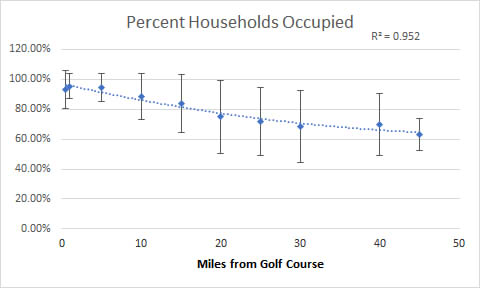
| Average Percent Households Occupied |
93.23 |
95.47 |
94.51 |
88.50 |
83.73 |
74.87 |
72.01 |
68.38 |
70.04 |
63.19 |
0.00 |
| SD Percent Households Occupied |
12.42 |
8.14 |
9.30 |
15.62 |
19.31 |
24.58 |
22.77 |
23.89 |
20.70 |
10.50 |
0.00 |
| Average Percent Households Vacant |
6.77 |
4.53 |
5.49 |
11.50 |
16.27 |
25.13 |
27.99 |
31.62 |
29.96 |
36.81 |
0.00 |
| SD Percent Households Vacant |
12.42 |
8.14 |
9.30 |
15.62 |
19.31 |
24.58 |
22.77 |
23.89 |
20.70 |
10.50 |
0.00 |
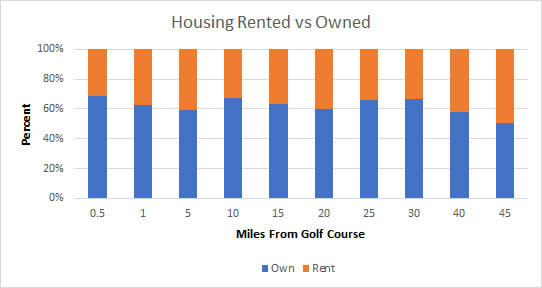
| Average Percent Households Owned |
64.00 |
59.85 |
56.14 |
59.70 |
53.16 |
45.01 |
47.45 |
45.55 |
40.46 |
31.94 |
0.00 |
| SD Percent Households Owned |
26.66 |
27.67 |
28.45 |
24.65 |
25.62 |
24.84 |
23.03 |
22.81 |
18.33 |
7.24 |
0.00 |
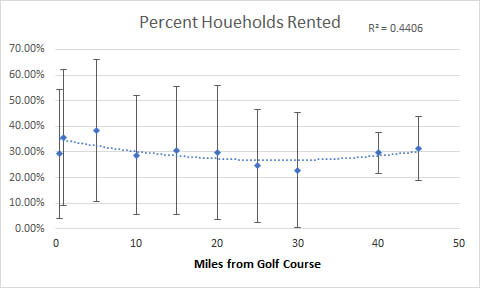
| Average Percent Households Rented |
29.23 |
35.62 |
38.37 |
28.80 |
30.57 |
29.86 |
24.56 |
22.84 |
29.59 |
31.24 |
0.00 |
| SD Percent Households Rented |
25.19 |
26.70 |
27.53 |
23.04 |
24.90 |
26.07 |
21.96 |
22.42 |
8.09 |
12.42 |
0.00 |