| Title Are there more fast food restaurants in low income neighborhoods? | ||||||||
|
Author Amie Mohai American River College, Geography 26: Data Acquisition in GIS; Fall 2018 | ||||||||
|
Abstract Low income neighborhoods are directly targeted for placement of fast food locations. | ||||||||
|
Introduction Who is really eating fast food? This is a question that is often hard to answer because on one hand, “it is obvious” that poor people eat more fast food due to the fact that there are more fast food restaurants in poorer neighborhoods than there is in non poorer neighborhoods. On the other hand, it seems like everyone eats fast food because it is convenient and cheap. According to the World Health Organization, over 1.9 billion adults were overweight for the year 2016. Obesity is when a person has a BMI of 30 or above. This is mainly due to poor eating habits and lack of exercise. Obesity is directly related to one’s income because wealthier people tend to be able to afford eating healthier foods and exercise on the daily, while non wealthier people are left with little or no access to quality grocery store. They are instead stuck with fast food restaurant since they tend to be quick and cheap. It is a known fact that poorer neighborhoods have more fast food restaurants than their middle-class counterpart. In 2008, Los Angeles banned new fast food restaurants from opening in the poor neighborhoods of South Los Angeles. (Los Angeles Times 2015) | ||||||||
|
Background Doing a quick Google search on fast food locations brings up alot of articles on fast food restaurants.Fast food chain restaunrants are specifically targeting children in low income communities, they tend to place these restaurants close to schools, billboards are usally heavily used and also the biggest one of all television advertisements. They are also being intentionally placed in lower income neighborhoods which makes them easy target for severe health conditons like obesity and etc (Food Research & Action Center). According to a journal article I read on elsevier "Disparities and access to healthy food in the United States: A review of Food deserts literature", people are more likely make choices on what type of food they consume based on what is availabe in their neighborhood. This is a major problem because low income communities and urban areas tend to have more fast food restaurants compared to higher income neighborhoods. Lower income neighborhoods are typically left with no choice but to eat what they have access to since grocery stores with healthy options are usually not accessible.There are other factors like access to transportation, and income that makes it difficult for people to just ignore a food that is close by to get somewhere farther away. (Health & Place 2010) | ||||||||
|
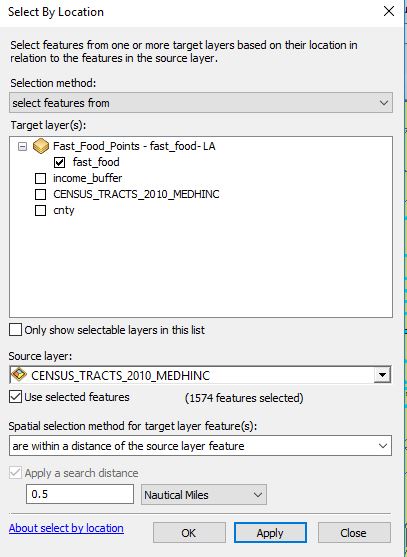
Methods Fast food restaurant data was retrived on ArcGIS online, the data was then saved to my content since I wanted to be able to open it in ArcMap for some analysis.Once the data was opened up in ArcMap, I clipped it into Los Angeles county boundary which I retrived from the Los Angeles county open data website. I examined the attribute table and performed a definition query to show only fast food restaurants in the city of Los Angeles. I also retrieved the 2010 census data from Los Angeles county open data which was downloaded as a zip file. Once the data was extracted in my working folder, I opened it in ArcMap to examine as well. I frist did a select by location on the census tract data to show me tracts whose income are below the state's median household income. Doing a quick search on the US Census Bureau website, I was able to find out that the median household income in California is $67,169. With that in mind, I selected household income less than $67,169 and based on that selection, I performed a select by location to show me fast food locations that are within half a mile of all census tracts that were selected. I was not surprised at my results because it is excatly what I expected. I then swicthed my selection to show me income greater than the states median household and did a select by location on how many fast food restaurants I can find within half a mile and again not surprised by my results. | ||||||||
|
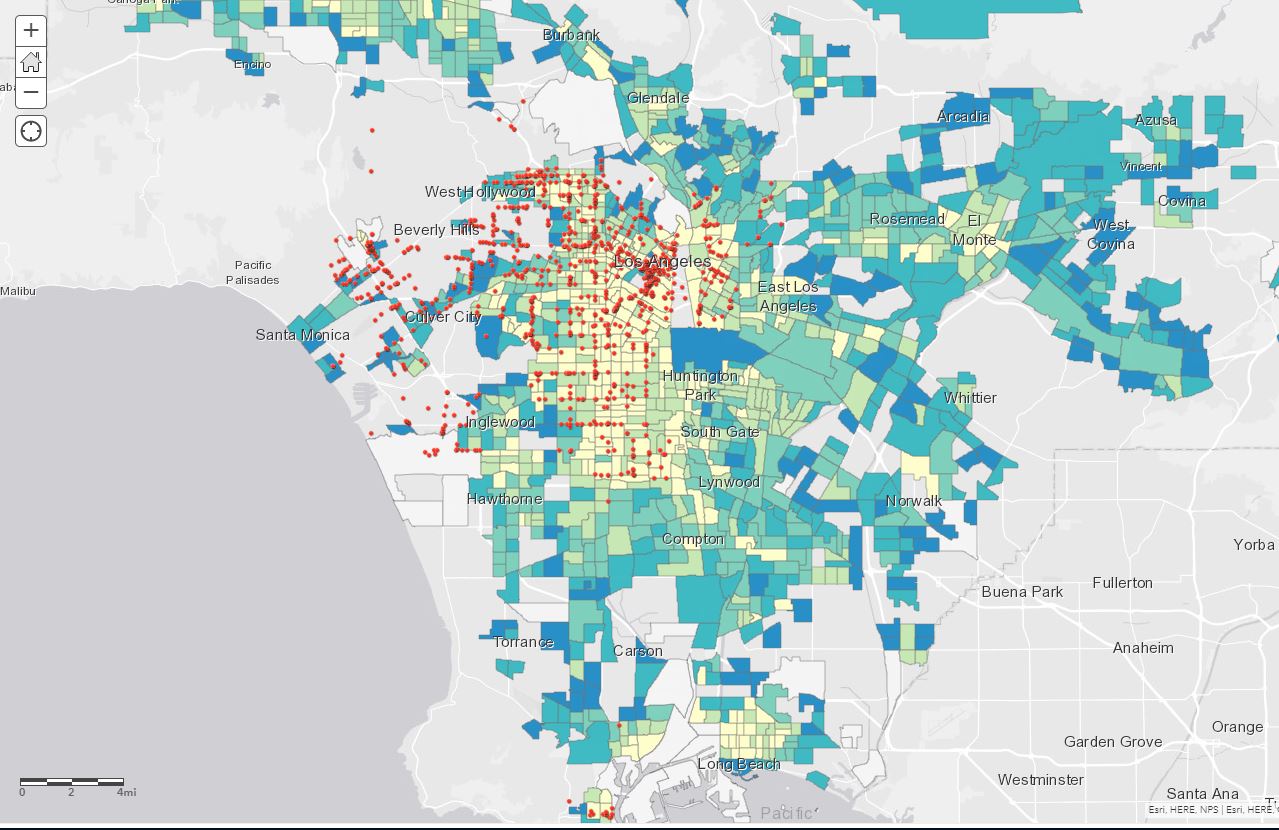
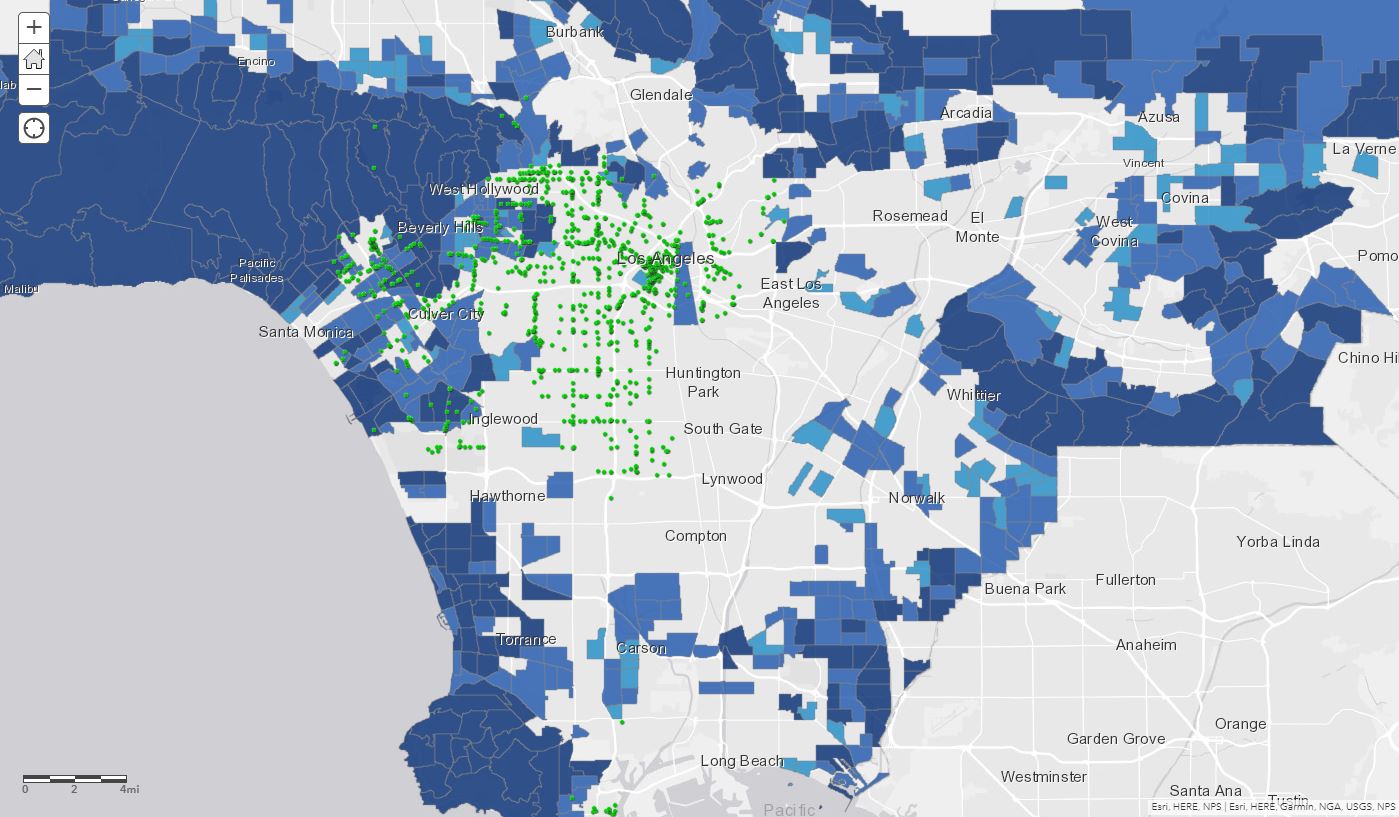
Results Just like I predicted, there are more fast food restaurants in lower income neighborhoods than there is in higher income neighborhoods. Out of 1,137 fast food locations in Los Angeles, 1,087 were found to be within a half a mile radius of neighborhoods whose household income is below the states median household income. 

Figure 1 shows the disparity of fast food locations in neighborhoods whose median household income is less than $67,169 
Figure 2 shows the disparity of fast food locations in neighborhoods whose median household income is greater than $67,169 | ||||||||
| Distance from Fast food | 0.5 miles | 1.0 miles |
|---|---|---|
| Median household income less than $61,143 | 1,087 | 1,133 |
| Median household income greater than $61,143 | 658 | 881 |
Analysis
The data that I retrieved from ArcGIS online succesfully gave me the results I was hoping. I am curious though to see if there is a significant change in income and fast food locations since the U.S. census data is from ten years ago. I feel as though incomes around the state are constantly changing due to gentrifications and many other factors that could give me a different result. I also would like to know if newer fast food chain restaurnats have been opened in Southern Los Angeles since the ban in 2008. Conclusions
In conclusion, I believe that there are more major fast food outlest in lower income communities than there is anywhere else. Based on these facts provided, there should be a restriction on how many fast food locations are allowed in low income communities, grocery stores and farmers markerts should also start replacing fast food restaurants. Fast food restaurants should also be forced to provide atleast a few healthy items on the menu that are the same price as the healthier options.References
Renee E. Walker, Christopher R. Keane, Jessica G. Burke, 2010. Health & Place. Disparities & access to healthy food in the United States: A review of food deserts literature.
Renee E. Walker, Christopher R. Keane, Jessica G. Burke, 2010. Health & Place. Disparities & access to healthy food in the United States: A review of food deserts literature.