Title
Crime Mapping with GIS: a 10-Year Holiday Season Comparison in Sacramento County, CA
Author Information
Lauren Alejo
American River College, Geography 350: Data Acquisition in GIS; Fall 2019
Abstract
The purpose of this project is to briefly examine how Geographic Information Systems enable the location factor in crime analysis with crime mapping. There are many applications that suit different areas and I have chosen to stick close by with a look at some criminal offenses within Sacramento County. Lexis Nexis contracts with Sacramento Sheriff’s Department to produce a public interface for interactive maps with real time data, up-to date projections, analytics, and potentially helpful information. I will go over a brief history on the emergence of computerized crime mapping, the process of using a GIS to conduct spatial analysis of crime problems, and the remarkable progress thus far in crime analysis. Utilizing some spatial analysis and 3D graphic representations, I will present my findings obtained from Community Crime Map, a free very user-friendly service.
Introduction
GIS technology has come a long way since its introduction as a necessary tool for crime analysis. Being able to identify where different types of crime and other incidents occur is and has always been an important function of crime analysis. However, putting dots on the map is just the initial step in understanding a crime problem. The context of the criminal event must be analyzed and compared with other crime data to derive meaning from it, detect patterns in the data, and grasp the bigger picture (ESRI). Coupled with the fact that some criminal activity is non-random raises questions about its location and the reasons for its location (Santos). In crime analysis GIS directly answers the location question and more. Crime mapping is a mere subpart of analysis but an important part nonetheless. Transitioning from traditional pin map styles to more sophisticated computerized GIS representations, crime mapping serves three main functions within crime analysis. Tactical crime analysis is used to identify patterns for crimes that may reveal clusters of activity at specific locations (Santos). Strategic crime analysis is used in a variety of functions such as long-term applications to look at the relationship between criminal activity and disorder, setting schedules, determining areas to patrol, to examine patterns around specific locations, to calculate crime rates, and to incorporate data with quality geographic information (Santos). Administrative crime analysis is used for information available to the public. There is no doubt that crime mapping could benefit all academic researchers and practitioners (Wang). Collaborations among academics like criminologists, geographers, and computer scientists with business and practitioner communities have led to important advancements. GIS applications have evolved from crime mapping to sophisticated spatial analysis and its integration in daily policing practices (Wang).
Background
Since crime data reporting and archiving became mandatory in the US criminal justice system, accurate location information for crime incidences has been required in all modern police departments (Wang). With the advancement of computer and information technologies, developments, in mapping and GIS, have readily became more powerful and user friendly. GIS and related technologies have turned crime mapping into a powerful decision-making tool for law enforcement agencies. However, GIS is beyond mapping, and increasingly so for crime analysis and law enforcement (Wang). Efforts to increase awareness and importance of GIS in crime analysis is evident in such areas like funding the development of CrimeStat, organizing the annual Crime Mapping Research Conference, ESRI’s intelligent mapping, and smart policing (ESRI).
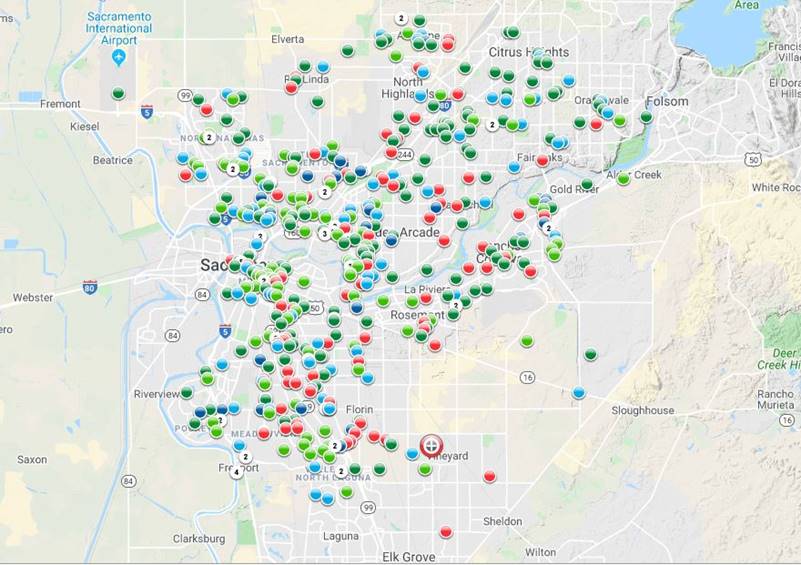
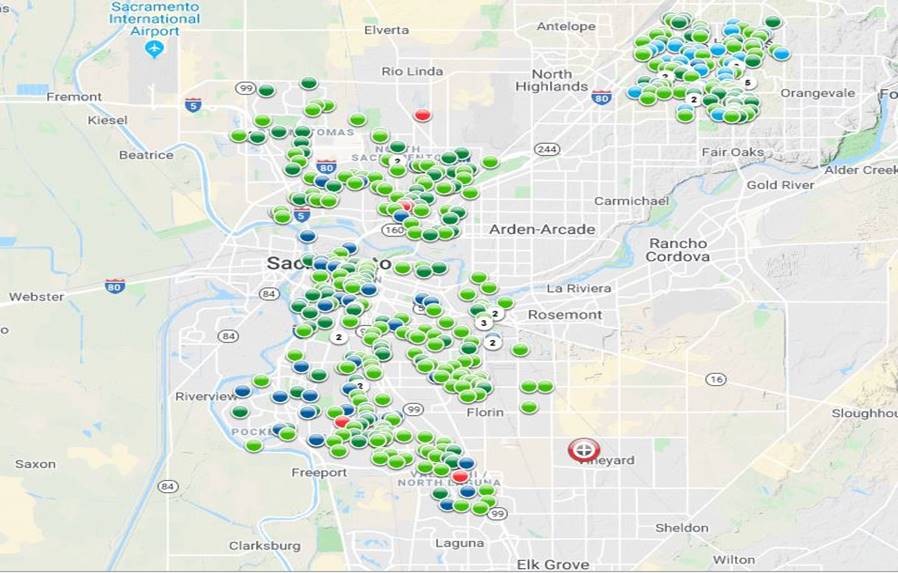
The Sacramento County Sheriff’s Department is contracted with the Lexis Nexis tool RAIDS Online to provide crime reporting, community awareness, and data transparency to the public. Citizens can view the reported crimes on a map or in a table. The Sheriff’s Department uploads completed crime reports to Lexis Nexis on a daily basis. The data does not include general calls for service or police activity where there was no crime report. In addition, some event types are withheld to comply with the law and to protect the rights of victims in cases such as sexual assaults, crimes against children, domestic violence, and calls that are medical in nature. Some case data may change if an ongoing investigation identifies more information about the crime. Citizens can view the categories of crimes being reported and click on a specific incident to view the information (https://www.sacsheriff.com/Pages/Services/OnlineCrimeMapping.aspx).
Methods
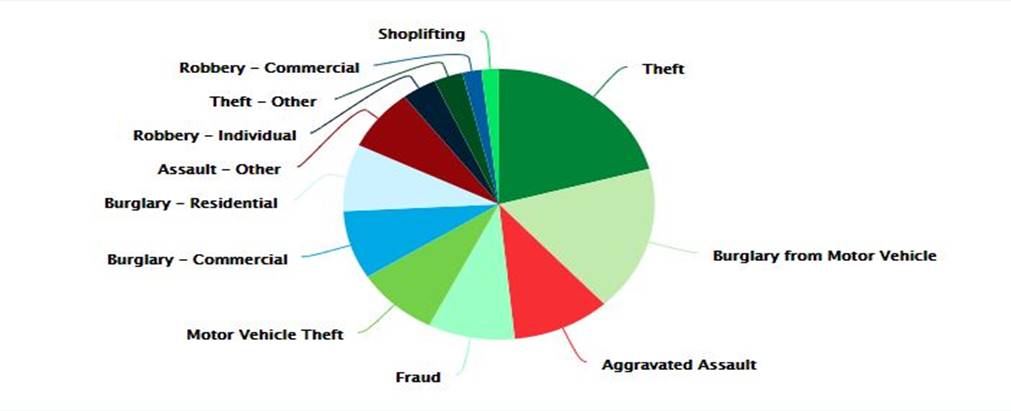
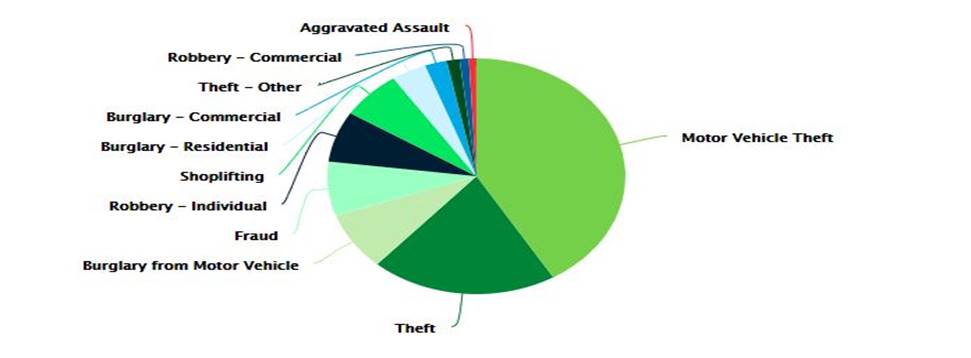
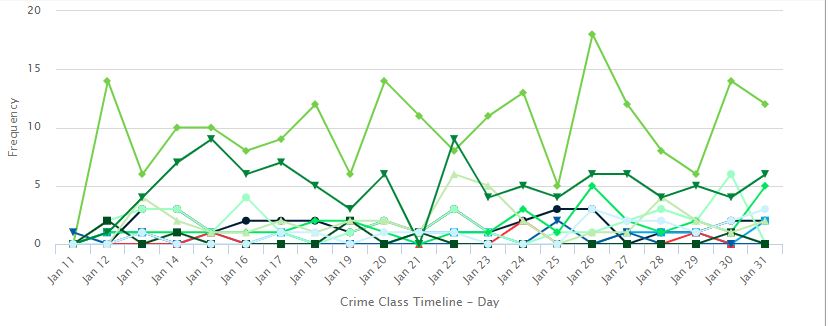
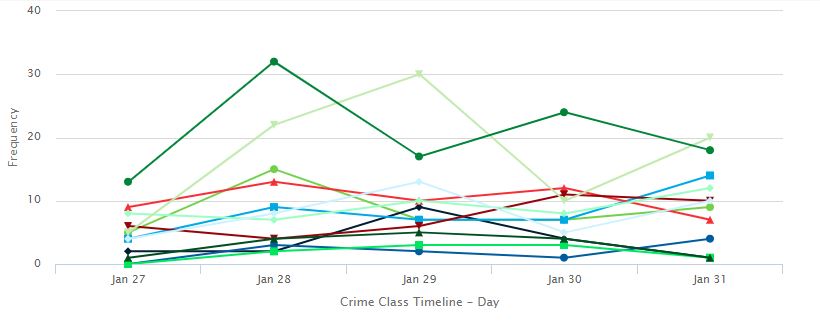
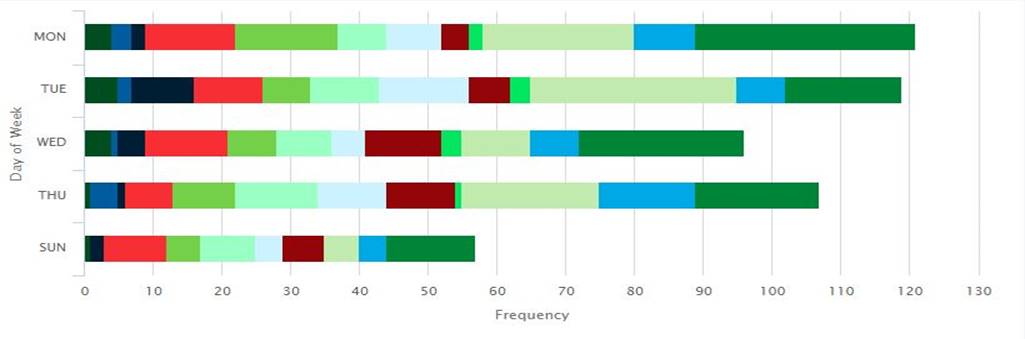
Using the interactive community crime map, I was able to search through specific filters to acquire the data for the time frame October 1st, 2008 thru January 31st, 2009 and Oct 1st, 2018 thru January 31st, 2019. I compared the data of ten criminal offenses that I thought might be considerably higher during a holiday season. I found that while some crime class rates remained similar, a few sparked off new rates. Obviously to compare crime peaking during the holiday season would require more data analysis of the entire year however, I was just curious of the overall crime rates for the various crimes during a shorter time period.
Results
|
Crime Class |
2008/2009 |
2018/2019 |
|
Aggravated Assault |
50 |
46 |
|
Burglary from Motor Vehicle |
86 |
35 |
|
Burglary – Residential |
40 |
21 |
|
Burglary – Commercial |
41 |
10 |
|
Fraud |
44 |
38 |
|
Motor Vehicle Theft |
45 |
215 |
|
Robbery - Individual |
18 |
46 |
|
Robbery - Commercial |
10 |
3 |
|
Shoplifting |
9 |
30 |
|
Theft |
106 |
91 |
Images on Left Side: OCT 2018 – JAN 2019 Images on Right Side:OCT 2008 – JAN 2009
|
|
|
|
|
|
|
|
|
|
|
|
Analysis
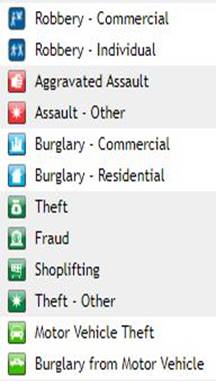
Fairly an easy process with the Lexis Nexis public interface that comprises the Community Crime Map. Narrowing down the topic to what I considered holiday related crimes such as theft, burglary, shoplifting and fraud was simplified with the event selection available to the user on the site. Citizens can readily view the data available and input information such as address, date range, crime type, crime density, or agency to locate specific incidents.
Conclusions
GIS is used as an effective way to inform citizens of updated crime information in their neighborhood and empower citizens to take caution or report valuable information. It provides great advantages to any system that requires a geographical approach to support data (Wang.) It is remarkably faster and more reliable to government agencies that require accuracy for decision making. The public interface does have disclaimers about its own susceptibility to some degree of error due to the collection, entry, and geo-processing of the data and merely serves as a public courtesy (SacSheriff). However, the data does maintain its integrity for private use which aids law enforcement and policing efforts in a more precise manner.
References
Wang, Fahui. 2012. Annals of GIS. Why police and policing need GIS: an overview. https://doi.org/10.1080/19475683.2012.691900
Santos, Rachel Boba. Crime Analysis with Crime Mapping, 4th ed. 2017
Sacramento County. Sacramento County Sheriff’s Department. 2019. https://www.sacsheriff.com/Pages/Services/OnlineCrimeMapping.aspx
LexisNexis. Community Crime Map. 2019. https://communitycrimemap.com/
ESRI. GIS for Crime Analysis Building Better Analysis Capabilities with the ArcGIS® Platform. 2017.
https://www.esri.com/~/media/Files/Pdfs/library/brochures/pdfs/gis-for-crime-analysis.pdf