| Title
Using Esri's Web AppBuilder to Manage Trail Issues |
|
|
Author
Michael Bean |
|
|
Abstract
Esri's Web AppBuilder can be used to create web applications to manage and visualize trails issue. |
|
|
Introduction
Trail systems are a recreation facility loved by the public but can be a challenge for agencies to manage and maintain. This project demonstrates how an Esri web based map application can assist land managers collect, visualize, and share trail issue data. The application displays trail issues reported from the public and staff that could feed into trail maintenance or closures. Elevation data is used to better understand where trail alignment might contribute to issues and allow for visualizing potential reroutes or new trail development. The BLM trails along the South Fork of the American River in El Dorado County, California was used as an example trail system for the application. |
|
|
Background
Two web resources provided some inspiration for this project. The first resource is the Trailforks website. The Trailforks website allows members to report on trail conditions on trails created from user GPS tracks. The second web resource is a tutorial provided by Esri https://learn.arcgis.com/en/projects/hiking-red-rock-canyon/ that demonstrates a web map that is shared through a web application with template designed to show elevation profiles. |
|
|
Methods
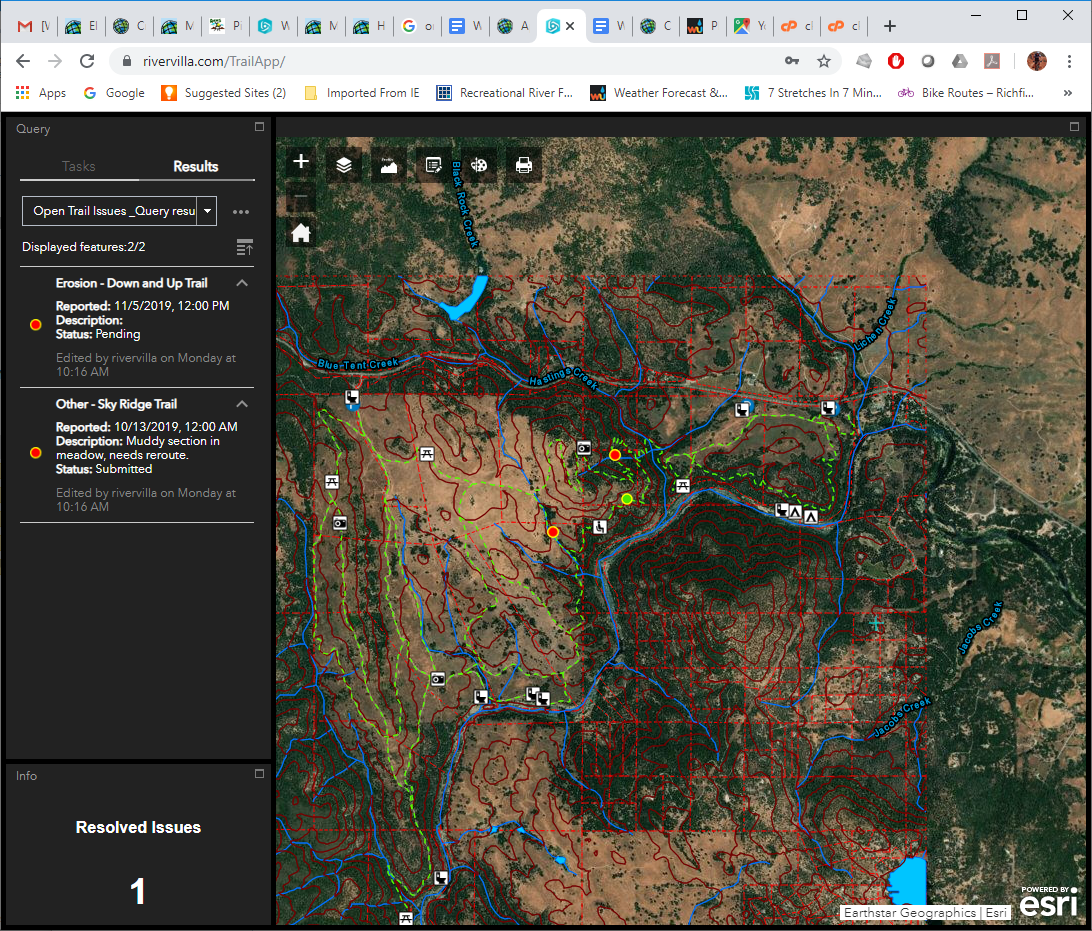
The initial map and data layers for the trail system at Cronan Ranch were developed in ArcGIS Pro. A simple rectangular study area was then defined (121.000W, 38.775N by 120.940W, 38.835N) which is slightly larger than the trail system at Cronan Ranch. The parcel data was extracted from a web application hosted by El Dorado County and clipped to the study area. The hydrography layers (rivers and streams, lakes and ponds) were created from the National Hydrography Database by downloading the dataset for the South Fork American River drainage (HU8_18020129) which covers the study area. The hydrography layers were also clipped to the study area. Two contour layers were created from 1/3 Arc Second USGS NED files which were mosaic together and clipped to the study area. Both 20ft and 100ft contour layers were created from the clipped elevation data after converting the elevation heights to feet. A hillshade and a slope layer were also created from the clipped elevation data. The trails layer came from OpenStreetMap data after comparing the trail alignments with a number of personal GPS tracks acquired for the trail system. A couple of trail alignment corrections were submitted to OpenStreetMap before the trails were extracted as a KML file using a tool provided by http://overpass-turbo.eu/. The trail data was then converted from KML to a line feature class. The points of interest layer was created to capture features near the trails including parking, restrooms, tables, benches, and viewpoints. Data in the points of interest layer is representative rather than complete. Finally the trail issues layer was created in Survey123 for ArcGIS to allow staff and/or volunteers to submit trail issues while using the trail system. Trail issues are represented in the web map as an open trail issues layer and a resolved trail issues layer based on the status of each issue. The map created in ArcGIS Pro was shared as a web map through an American River College organization Esri ArcGIS Online account. By sharing the map, hosted feature layers were created in ArcGIS online. Creating the trail issue survey form in Survey123 for ArcGIS created hosted layers which were included in ArcGIS Pro map as well as the web map created from the desktop map. The custom Elevation Profile widget does require a source for elevation data but in this application, the default Ersi provided web service specified in the widget was used. Some initial prototypes were developed using the ArcGIS Online version of Web AppBuilder with the published trail web map but the only means to display elevation profiles was a simple and fixed application template. A quick search online showed that a custom widget had been created to support elevation profiles on line features. This pushed development of the trail issues web application to use the Web AppBuilder for ArcGIS (Developer Edition). Setting up Web AppBuilder for ArcGIS (Developer Edition) required downloading the application to a PC and registering the application with an Esri ArcGIS Online account. The download includes a Web AppBuilder application is similar to the versions hosted on ArcGIS Online and Enterprise (Portal). On Microsoft Windows, a startup.bat file launches a local web server (via Node.js and Dojo Toolkit) which a developer connects to rather than ArcGIS Online or Enterprise (Portal). The first time Web AppBuilder is launched there are prompts for an ArcGIS organizational account and an App ID created in the ArcGIS organizational account for Web AppBuilder. 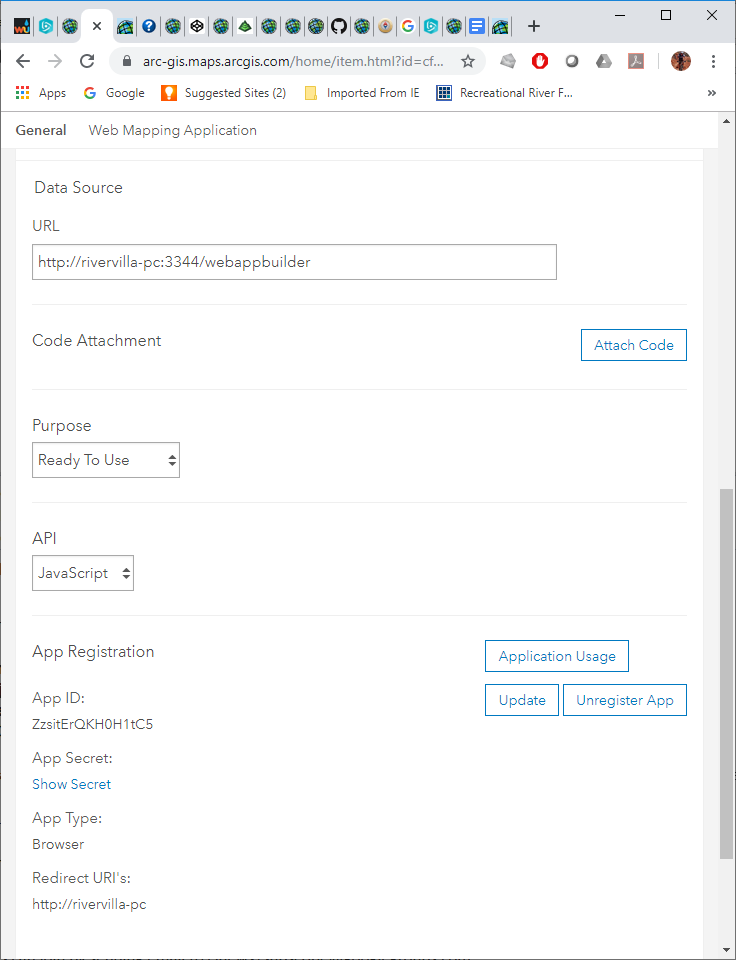 Linking Organization Account with Web AppBuilder for ArcGIS (Developer Edition) The process to get started with Web AppBuilder for ArcGIS (Developer Edition) is described in: https://developers.arcgis.com/web-appbuilder/guide/getstarted.htm Once configured, the local copy of Web AppBuilder for ArcGIS (Developer Edition) has access to content accessible with the configured ArcGIS organizational account. In order to use a custom widget, a developer needs to download the widget files and copy them into a specific location in the local copy of Web AppBuilder for ArcGIS (Developer Edition). In this case, the Elevation Profile Widget was downloaded and added to the local copy of Web AppBuilder for ArcGIS (Developer Edition). 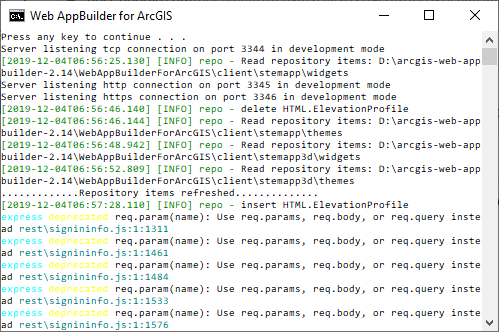 Web AppBuilder for ArcGIS Output on Microsoft Windows 10 Now that the local copy of Web AppBuilder for ArcGIS (Developer Edition) was properly configure it was time to start creating the trail issues application. The dashboard theme was selected as it provided side panels where open issues and a count of resolved issues could be displayed. The layout was adjusted to have two side panels to the left of the map panel. In the first panel, a Query Widget was configured to select the open trail issues. The second panel was configured with Infographic Widget and configured to have the number of resolved issues. Next the widgets located in the map panel were configured. The dashboard theme allows for five widgets to be specified in the map panel. The first widget position was configured with the Layer Widget which would allow a user to modify the layers shown on the map. The second widget position was configured with the Elevation Profile Widget which would allow users to draw lines and visualize an elevation profile for that line as well as visualize an elevation profile for a selected trail. Elevation Profile Widget features are documented at: Adding the Elevation Profile Widget was problematic which is described later in this report. The third widget position was configured with Edit Widget so users could modify the trail issues, points of interest, and trail layers. The fourth widget position was configured with the Draw Widget which allows users to annotate the map with text and shapes that could assist with collaboration on potential trail projects. The fifth and final position was configured with the Print Widget so that hard copies could be created for sharing and use in the field. 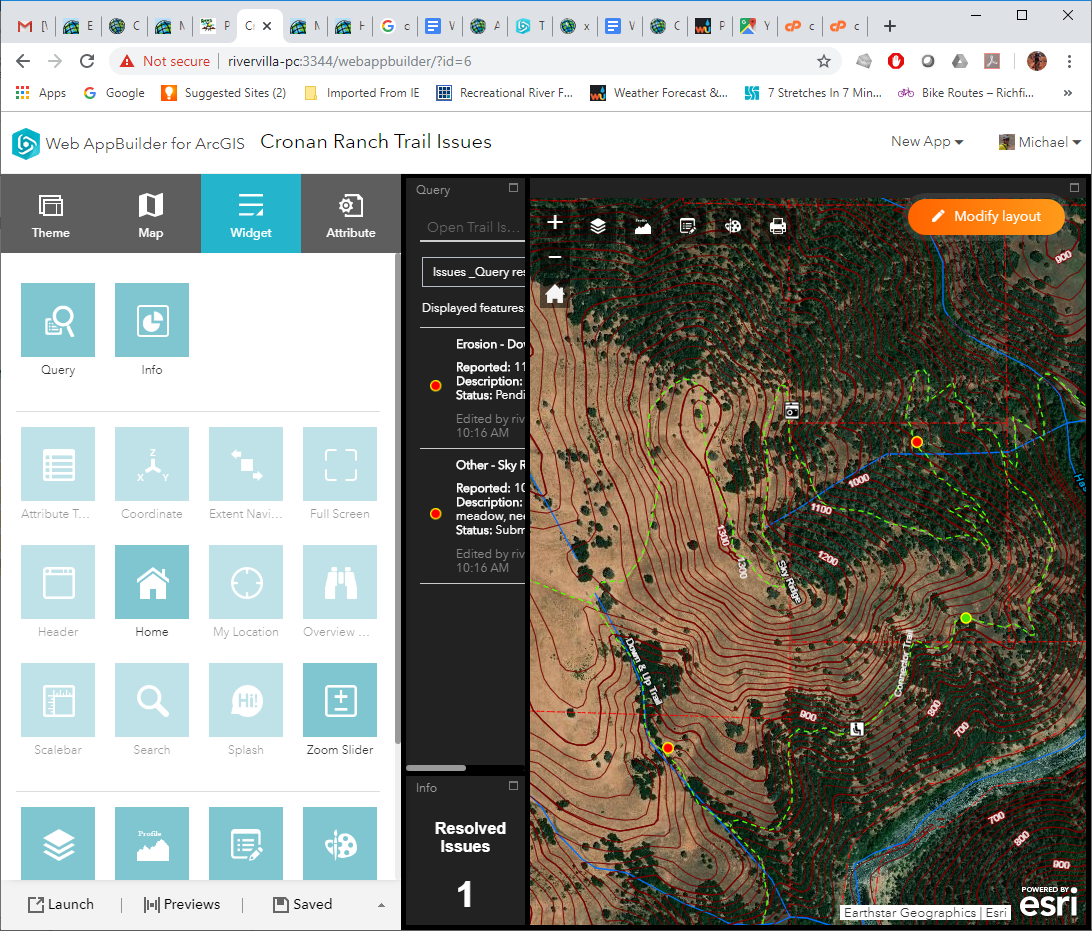 Creating Application in Web AppBuilder for ArcGIS (Developer Edition) Once the trail issues application was configured and working as expected, it needed to be deployed on a public facing web server rather than the unreachable PC hosting Web AppBuilder for ArcGIS (Developer Edition). To deploy the trail issues application publicly, the application was exported in a zip file containing JavaScript and configuration files for the application. This zip file was extracted to a personal web server hosted by Bluehost at: https://rivervilla.com/TrailApp/ The web map referenced by the application is not shared to everyone as a malicious user could make destructive edits. A version of the application with a web map that does not allow edits (using layer views) is located at: //rivervilla.com/TrailAppReadOnly/ |
|
|
Results
Below are some screenshots from the developed application: |
|
|
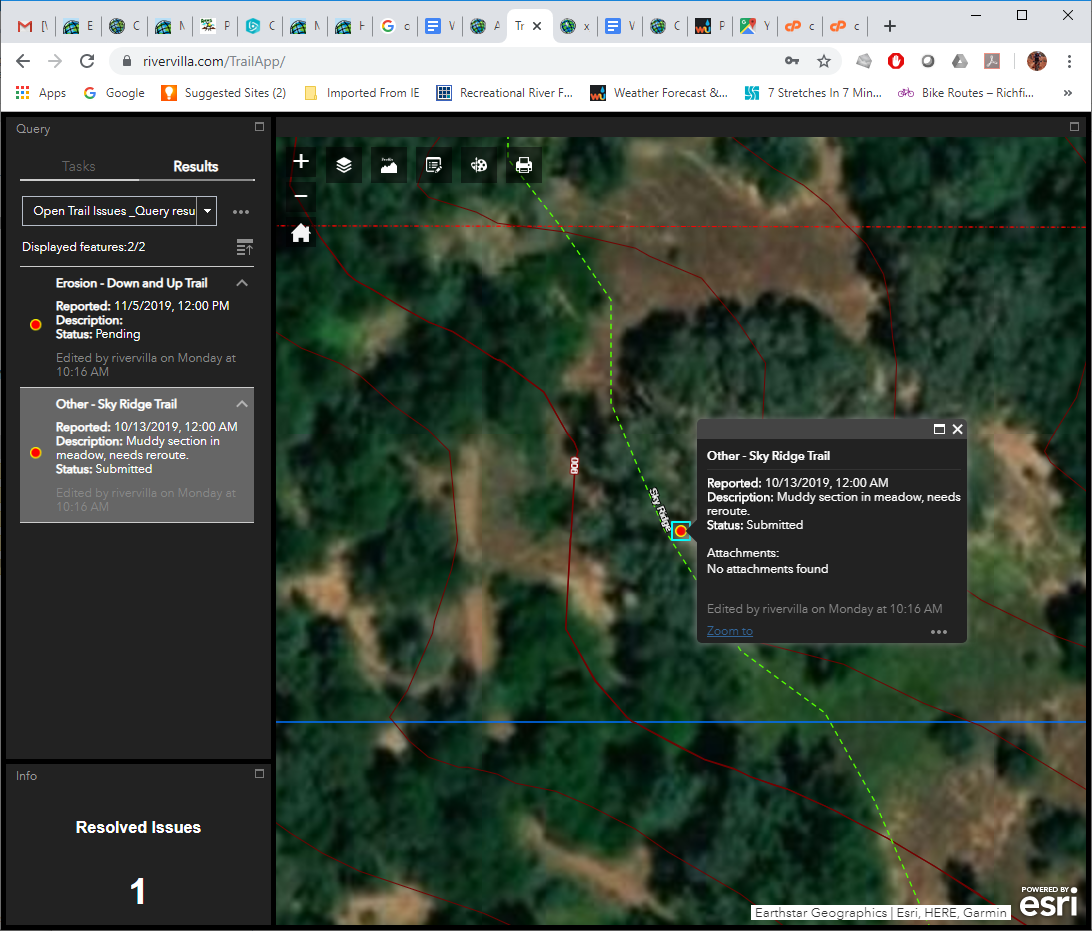
After signing in to application the user is shown a three panel display with a list of open issues, a count of resolved issues, and a map with default layers enabled. |
|
Selecting an open issue selects and zooms the survey point which can be created by a Survey123 for ArcGIS form. |
|
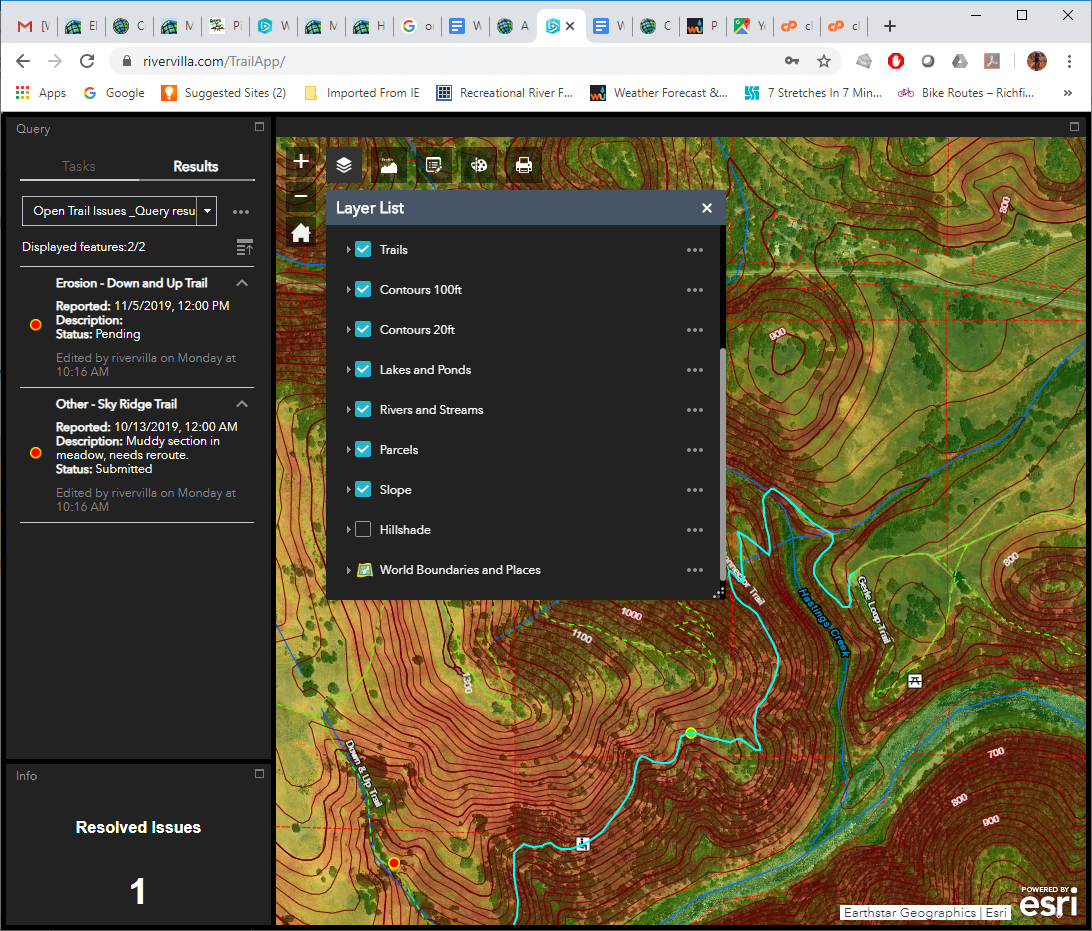
The Layer List Widget can be used to modify layers shown in the map. In this case a slope layer is being enabled with a configured transparency to allow imagery to still be seen. |
|
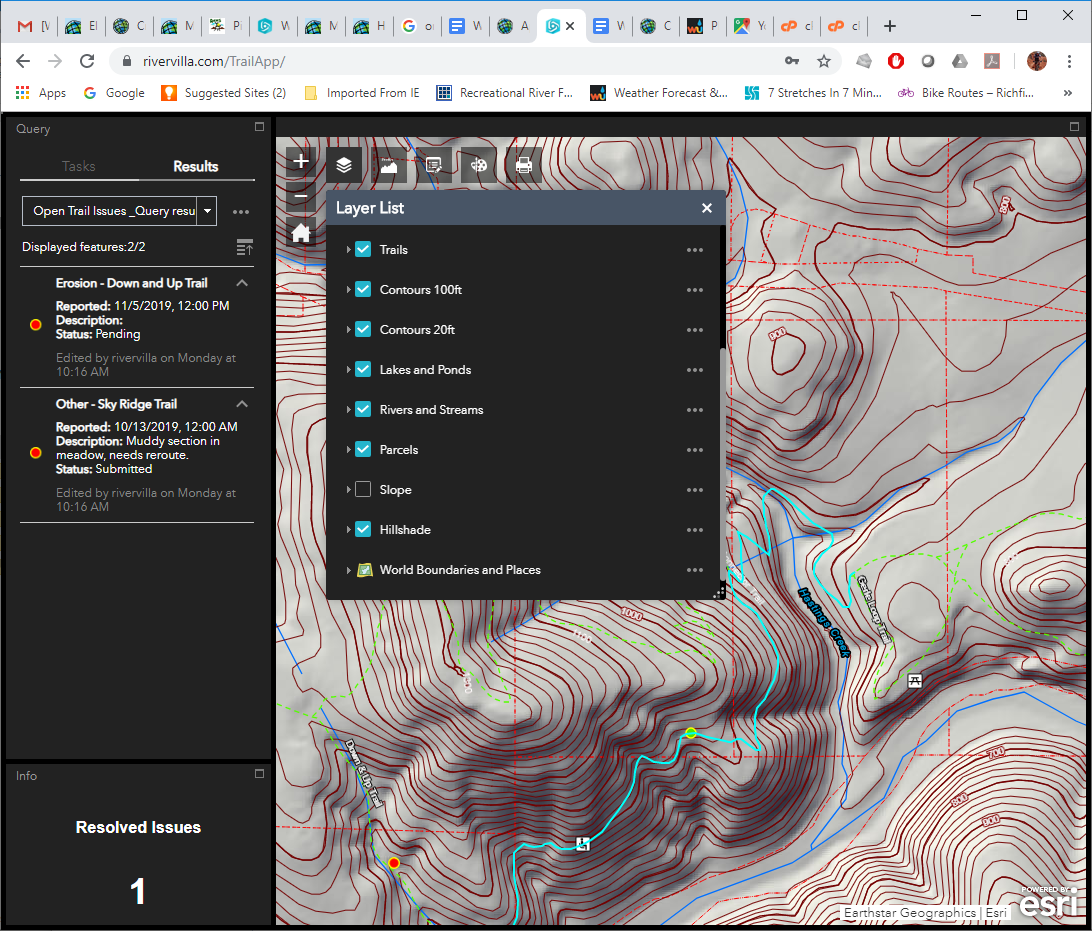
The Layer List Widget can be used to modify layers shown in the map. In this case a hillshade layer is being enabled. The hillshade layer provides an alternative to the imagery base layer. |
|
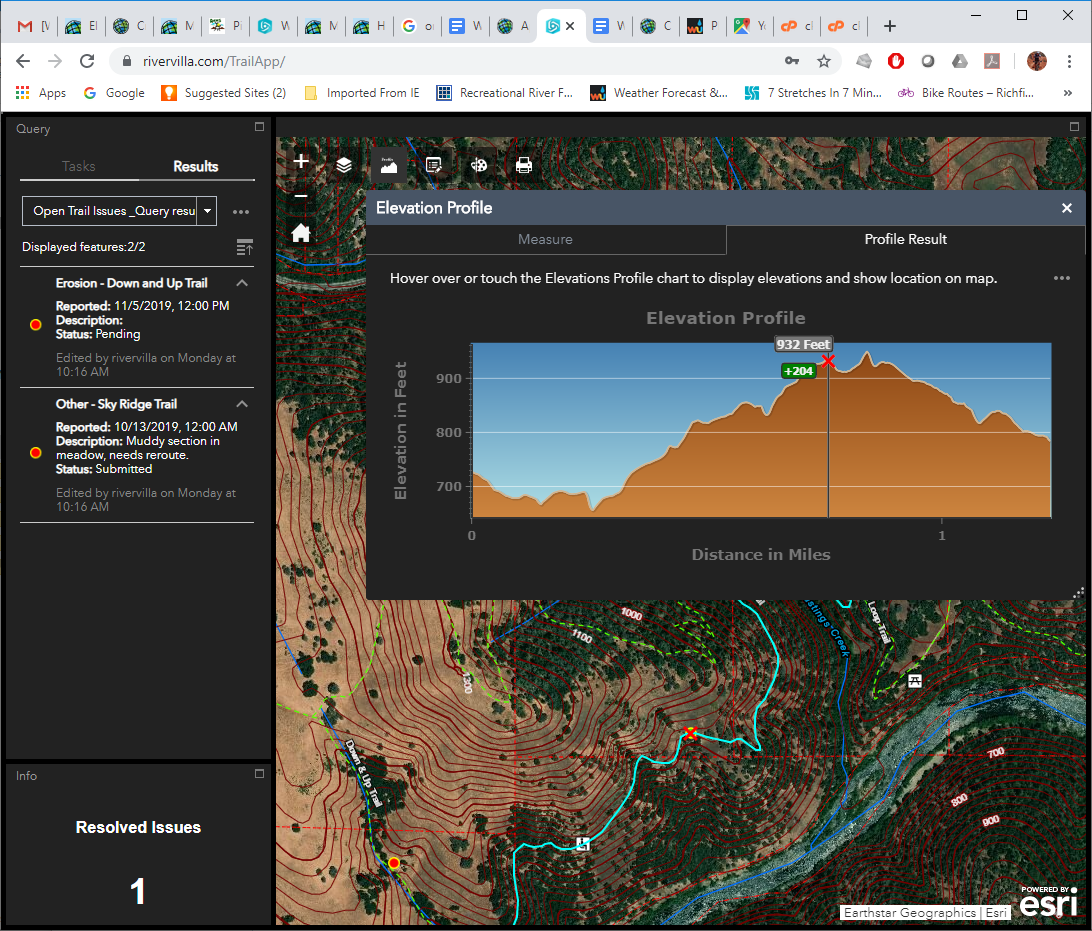
The Elevation Profile Widget is a custom widget developed by Robert Scheitlin. This widget allows getting an elevation profile for a line drawn on the map or selecting to profile a trail through an option on the pop-up associated with a selected trail. |
|
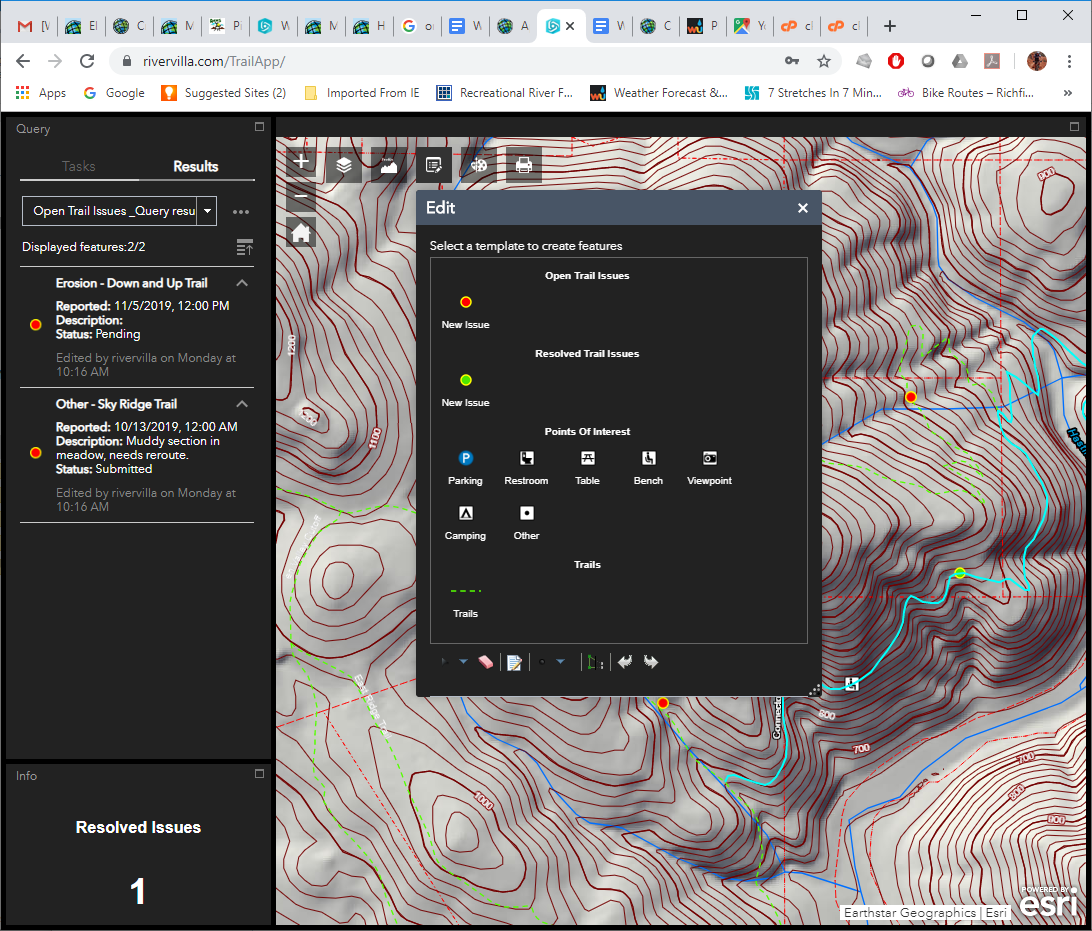
The Edit Widget allows a user to edit trail issues, points of interest, and trails. This widget provides an alternative to making edits through the web map associated with the application. |
|
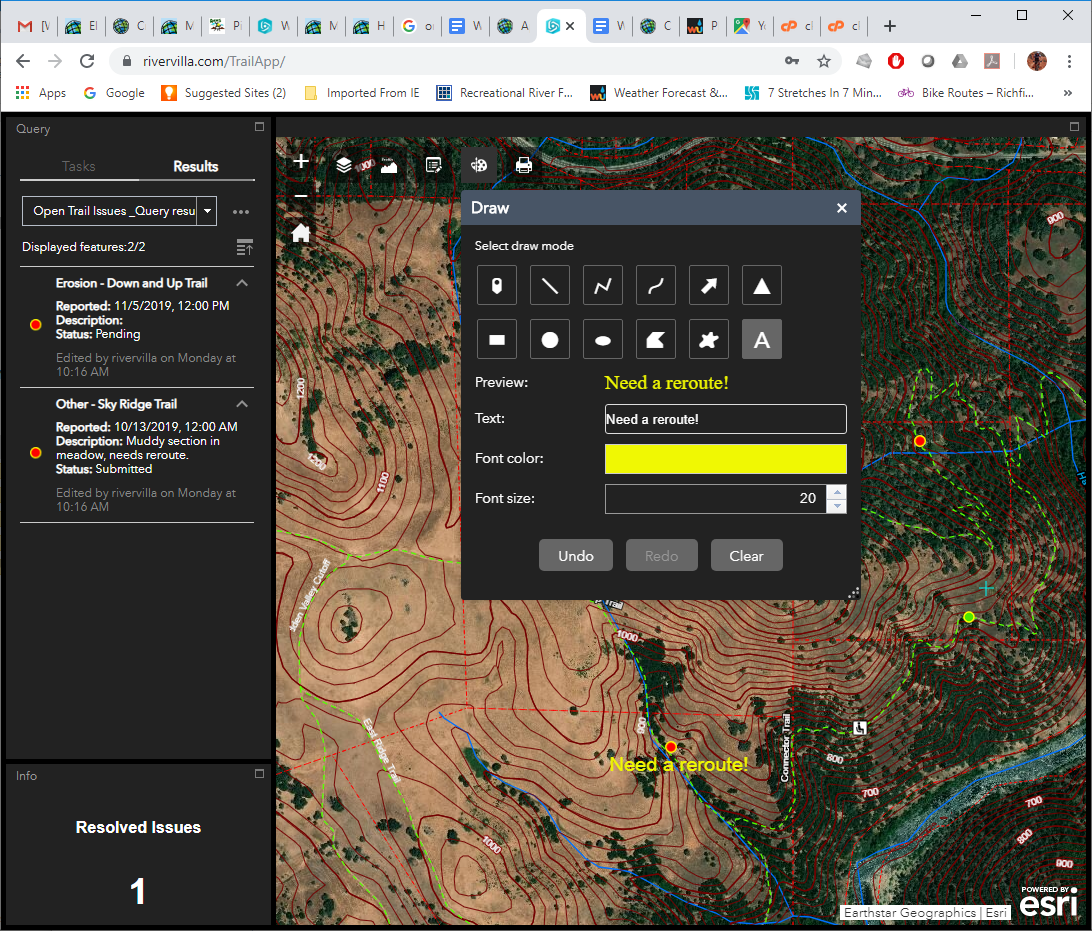
The Draw Widget provides the user with a tool to annotate the map with text and symbols. These annotations could help staff collaborate on ideas or add information before printing the map. |
|
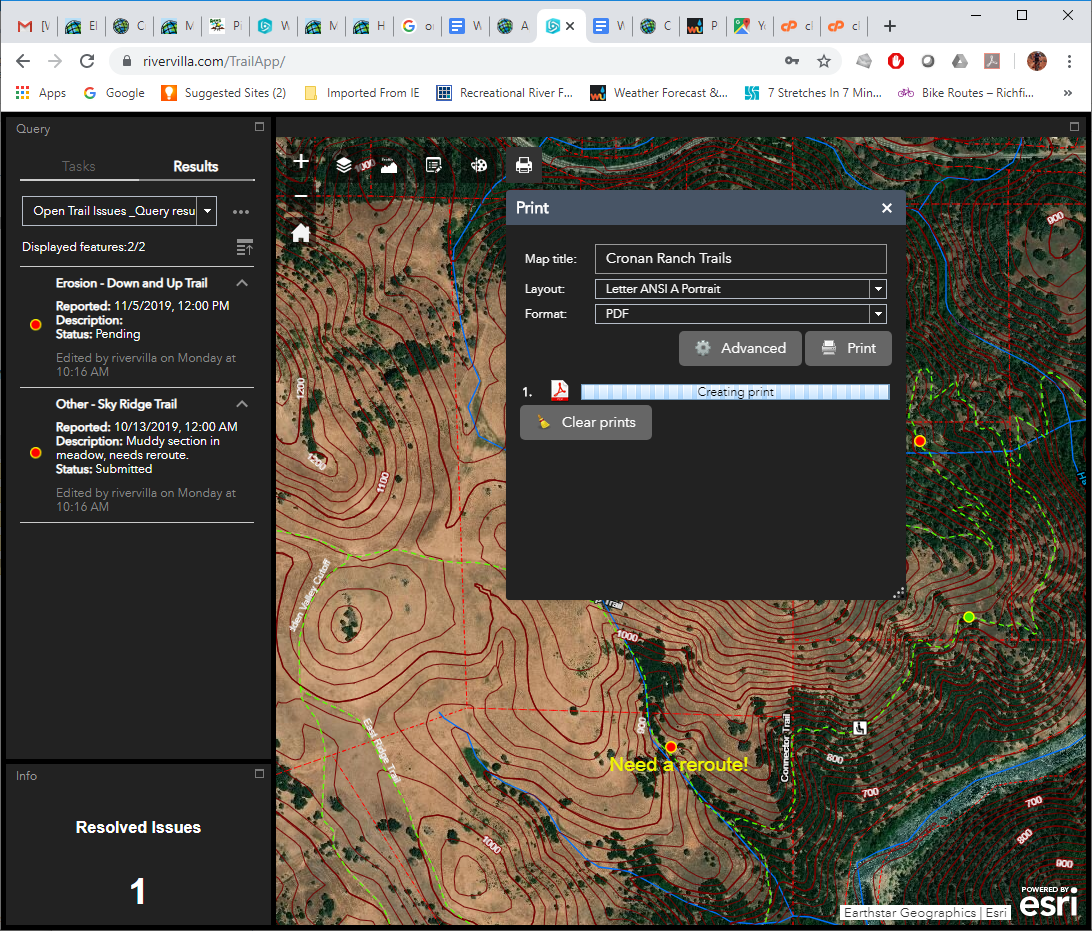
The Print Widget allows the map to be printed. Annotations made with the Draw Widget will be included in the output. |
|
|
|
|
Challenges and Issues
The first challenge for this project was understanding how to gain access to and configure Web AppBuilder for ArcGIS (Developer Edition). Documentation was a bit thin and had a few typos but through web search the "Web AppBuilder for ArcGIS: An Introduction" video from an Esri conference was found and filled in some gaps (see 1:00:55): How to add a custom widget was described in: The second issue developing the application was with the Elevation Profile Widget. After selecting the widget and clicking the "Ok" button to accept the settings nothing happened. The Developer Tools in Chrome browser were opened and there was an error being displayed in the console, JavaScript code was trying to access a variable that was undefined: 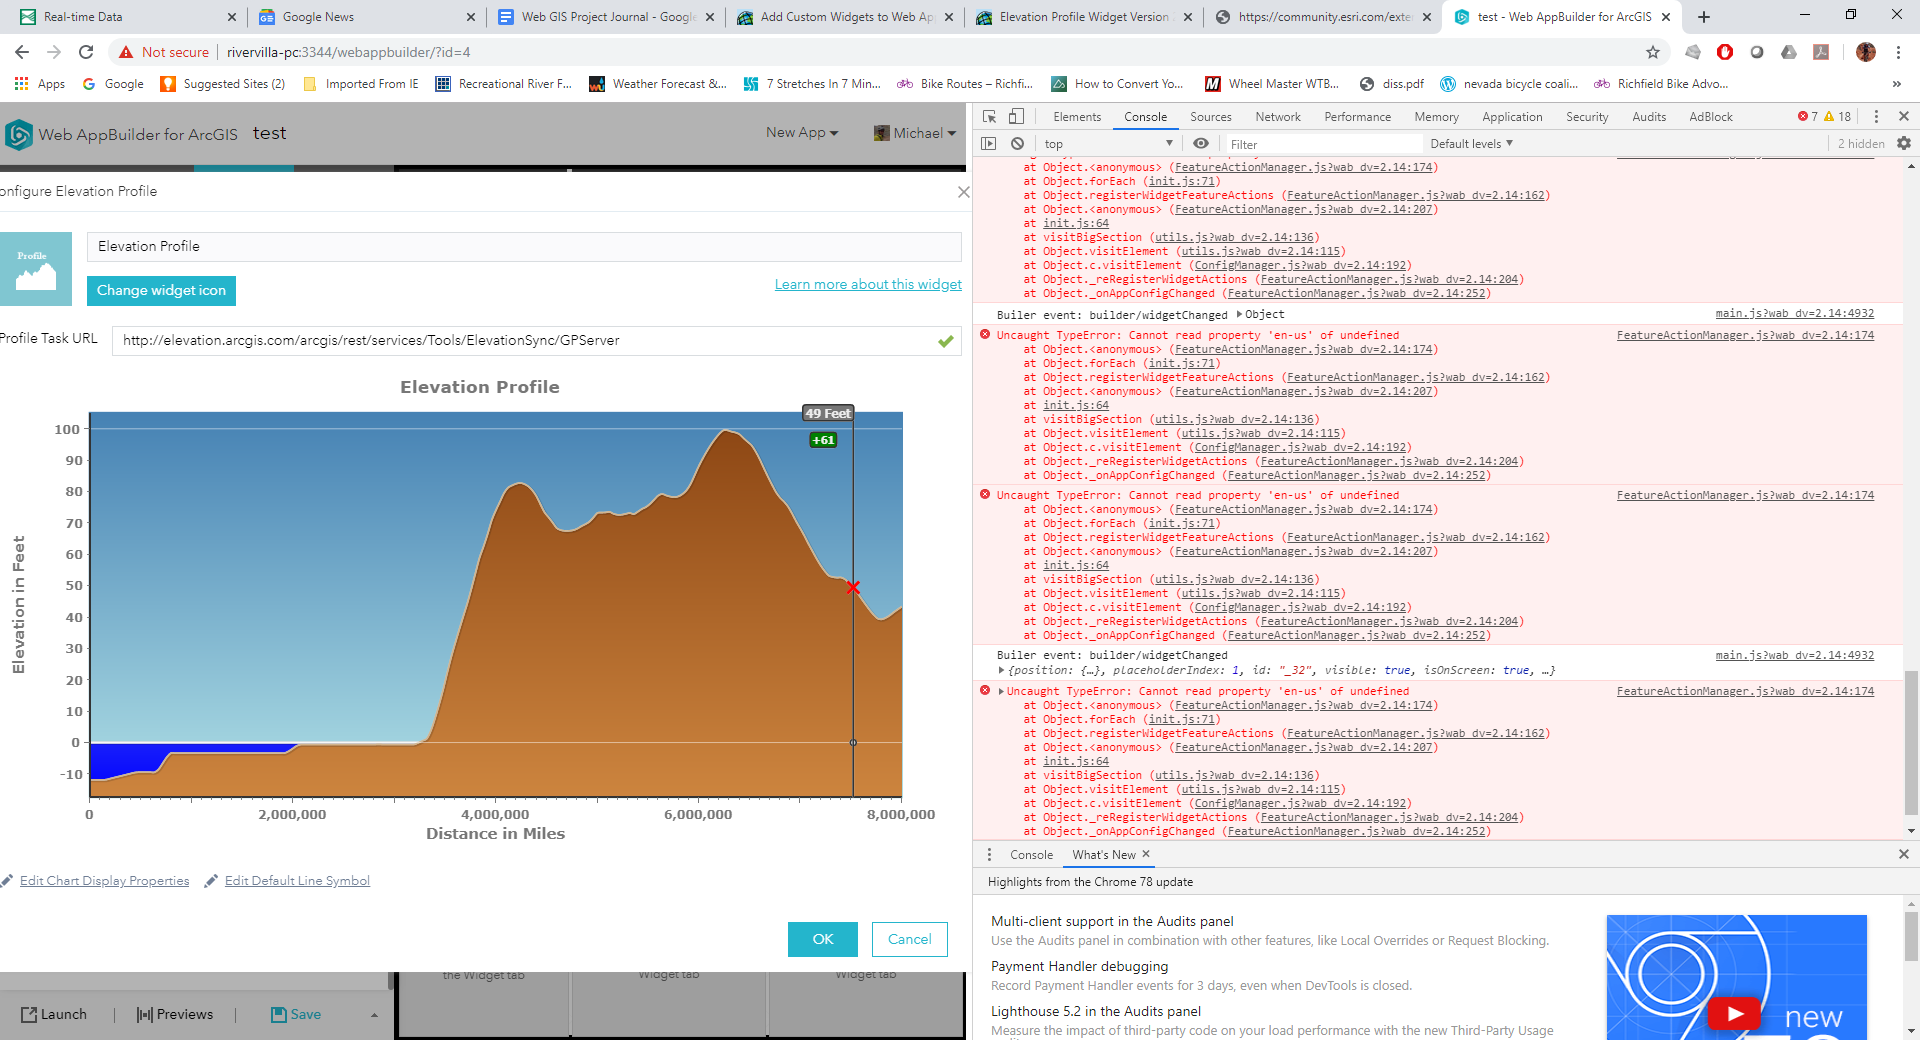 Chrome Developer Tools Showing Widget Error A search on Esri's GeoNet, an online community supporting ArcGIS developers, found there were others with the same issue and the author of the widget. The developer, Robert Scheitlin, was stumped on what was wrong (see bottom comments): https://community.esri.com/docs/DOC-3342-elevation-profile-widget-version-23-02142017 Robert's recommendation was to downgrade to a previous version. This workaround was used for a while but the application would benefit from the features in the latest version of the widget. So it was decided to look into the code for a solution to the bug. From the Chrome console, the location of the error and the structure holding the missing data was known. The next step was looking through the Web AppBuilder code looking for places where the missing data might be set. From there it was found that in order for the missing data to be set, a _widgetLabel property needed to defined for the widget. The _widgetLabel property had not been provided for the Elevation Profile Widget. The _widgetLabel property was added and the latest version of the widget could now be used. The proposed fix was sent to the author of the widget and credit for the fix was given in the announced fixed version sent out on GeoNet. One annoying issue is how ArcGIS Online renders labels. For both the contour 100ft and trail layers, a halo was specified for the labels but the halo was not always honored when the map was rendered. The halo issue appears to be a bug with Web Maps not Web AppBuilder. |
|
|
Conclusions
Overall the experience was positive and final application worked well. Certainly the points of interests layer could have more data and additional fields. Fences, signs, and gates were not represented in the map. Inspection could have been linked to various assets in the trail system. In addition to data improvements, the Elevation Profile Widget could be improved to display slope along the selected line and also show totals for elevation gained or loss rather than relative. As with most applications, feedback from potential users will dictate changes and enhancements. The goal was to allow a quick view of where problems were and allow topography to be visualized to suggest alignment issues and possible reroutes or additional trails. It was exciting to explore how to deploy applications with custom widgets and deploying web applications on a ordinary (non-Esri) web server. |
|