| Title Analysis of Vegetation Regrowth: One Year After the Camp Fire | |||||||||||||||||||||
|
Author Nate Cox American River College, Geography 350: Data Acquisition in GIS; Fall 2019 | |||||||||||||||||||||
|
Abstract I used image classification on a study area surrounding Paradise, CA, before and after the Camp Fire. I was able to determine what vegetation was lost, and what has grown back after one year. | |||||||||||||||||||||
|
Introduction 2018 saw the deadliest and most destructive wildfire in California history, consuming approximately 240 sq. miles, 18,000 structures, and 84 lives within a 17 day period. I wanted to see how Paradise, and surrounding areas affected by the fire, were healing one year later. 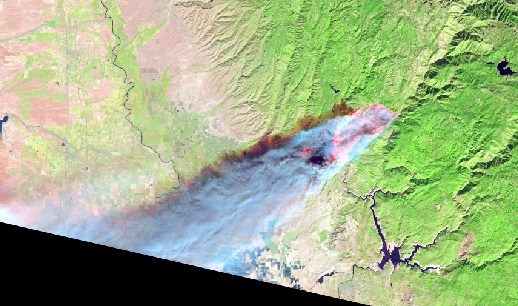 | |||||||||||||||||||||
|
Background Results highlight significant decreases in tree regeneration in the 21st century. Annual moisture deficits were significantly greater from 2000 to 2015 as compared to 1985–1999, suggesting increasingly unfavourable post-fire growing conditions, corresponding to significantly lower seedling densities and increased regeneration failure. Dry forests that already occur at the edge of their climatic tolerance are most prone to conversion to non-forests after wildfires. Major climate-induced reduction in forest density and extent has important consequences for a myriad of ecosystem services now and in the future.(Ecology Letters, 2017) | |||||||||||||||||||||
|
Methods To begin this analysis I first downloaded LANDSAT 8 images, that covered the study area, from the USGS EarthExplorer website. The images I selected were taken on 10-07-2018(one month pre-fire) and 10-26-2019(eleven months post fire). After putting the images into an ArcGIS Pro project the next step was to run an object-based image classification. I created four categories to classify the pixels; forest, shrub, barren, and water. Once the image classification was complete I ran the Zonal Histogram tool which produced the exact count of pixels within each category. With this exact count I was able to compare the percentage of landover type, and discover how things had changed. 10-07-18 LANDSAT 8 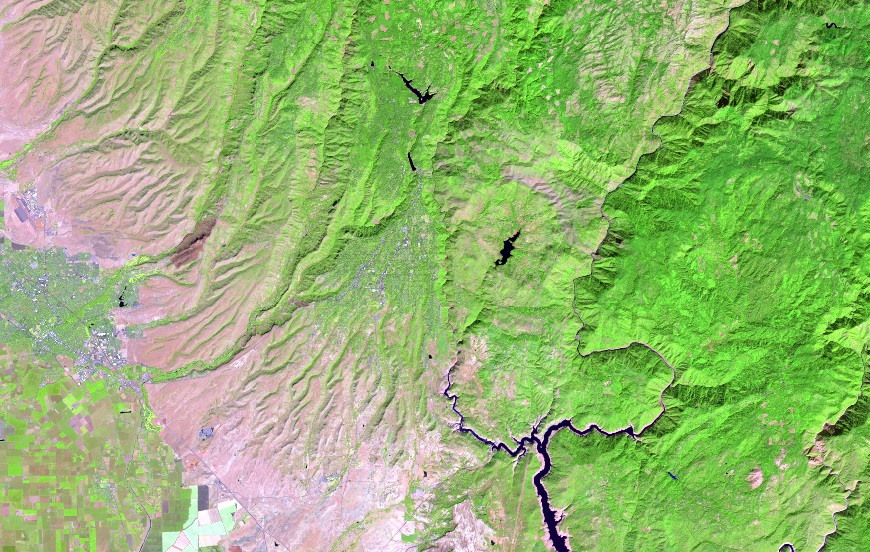 10-26-19 LANDSAT 8 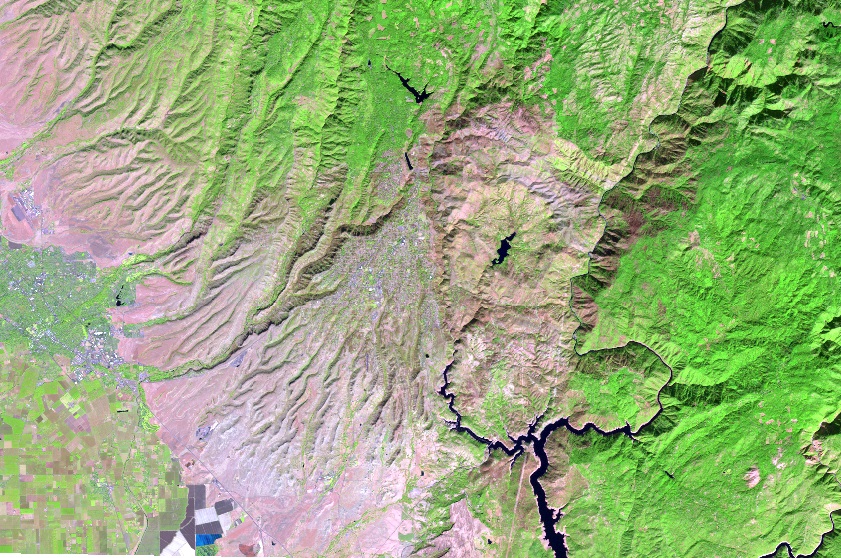 | |||||||||||||||||||||
|
Results I observed the following changes; Barren land increased by 5% from 20% to 25%, Shrub type landcover increased by 12% from 18% to 30%, forest landcover decresed by 17% from 56% to 39%, and hydrologic landcover remained the same at 6%.
| |||||||||||||||||||||
|
Figures and Maps 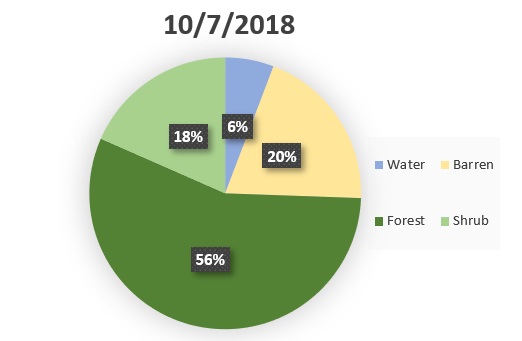 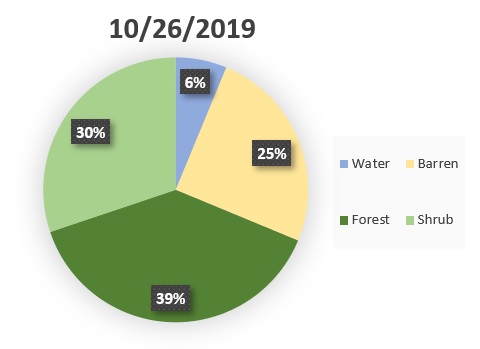 10-07-18 classified 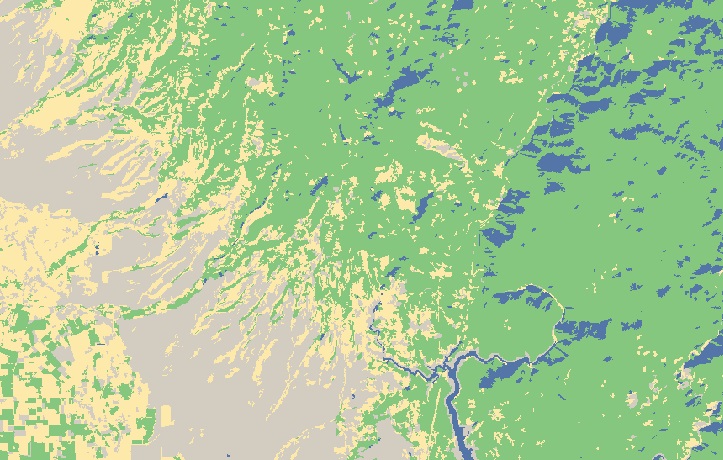 10-26-19 classified 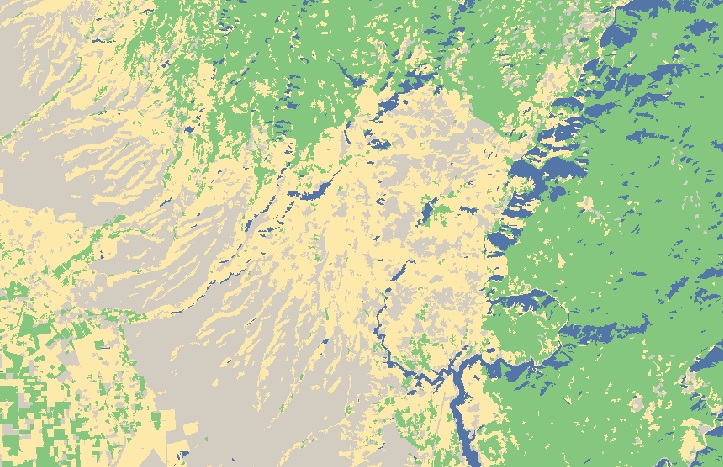 | |||||||||||||||||||||
|
Analysis Initially I had the idea of running this analysis on images taken every two months. Which would have produced a more accurate regrowth timeline. Unfortunatley due to snow cover this was not possible. However the results are still accurate. | |||||||||||||||||||||
|
Conclusions These results are indicative of typical regrowth patterns following large fires. A total recovery would consist of the same mix of grasses, trees, and shrubs. Typically grasses and short shrubs are the first to grow, followed by small trees. Total recovery may take decades. But the landcover that grows back is dependent on the region’s climate conditions. Drought resistant shrubs may replace trees that require more water. With the current changing climate, it is hard to predict if a total recovery is even possible. | |||||||||||||||||||||
|
References USGS Earth Explorer Camille S. Stevens-Rumann, Kerry B. Kemp, Philip E. Higuera, Brian J. Harvey, Monica T. Rother, Daniel C. Donato, Penelope Morgan and Thomas T. Veblen. (2017), Evidence for declining forest resilience to wildfires under climate change, Ecology Letters. | |||||||||||||||||||||
|
Appendices Material may be included in various appendix sections at the student’s option. | |||||||||||||||||||||