| Title Using GIS in Aviation Land Use Compatibility Planning | ||
|
Author Name: Spencer Day American River College, Geography 350: Data Acquisition in GIS; Fall 2019 | ||
|
Abstract Aviation land use compatibility planning have an impact on the types of land use that can be near airports. GIS is an essential tool for transportation planners to use to visualize compatible and incompatible land uses. This study looks at Sacramento International Airport and figures out how GIS can be used to help aviation land use compatibility. Using aviation and land use data, this study will see if the airports noise contours and safety zones and compatible with current Sacramento land use. The results of this study show that GIS can be used in aviation land use compatibility planning and highlight potential incompatible land uses based on aircraft noise and flight plan safety. It is clear in this study that GIS is a valuable tool for transportation planners to use to further study aviation land use compatibility. | ||
|
Introduction Airports are an important part of California’s transportation system and significantly impact their communities economically. There has been a problem with managing airports and making sure that the surrounding environment is safe and efficient. Airport managers and land use planners need to ensure that property near airports are compatible with existing and future airport development. The planners and airports should consider allowing agricultural, commercial, and industrial uses around airports. They should avoid allowing sensitive residential, educational, or public gathering land uses. Land use planning around airports must consider the operational environment of the airport, which includes any obstructions to navigable airspace, lighting, and visibility, and negative impacts by the airport such as aircraft noise, increased emissions, and congestion. GIS is a tool that can be used by planners to help address the challenges laid out by land use compatibility planning. GIS utilizes spatial data that can help visualize current and future development around airports showing any potential complications. This makes it easier for planners to spot risks and environmental hazards that can impact the airport or its surrounding land uses. GIS simplifies the way planners approach land use compatibility issues and gives them clear visualizations of any potential challenge or issue to current of future development. This study will focus on Sacramento International Airport and utilize aviation data acquired from Caltrans to accurately determine how GIS can be used in aviation planning. | ||
|
Background A recent study helped show how the FAA uses GIS to use and analyze geospatial data for aviation management (McNerney, 2014). To improve airport surveying and aeronautical information the FAA has implemented enterprise geospatial data. Using GIS, the FAA standardizes geospatial survey data for airports that they need to send grants to. Both airport and other aeronautical data are managed using GIS which helps them efficiently follow current air traffic management. They established a standardized method of collecting, managing, and producing data which helped save them time when compared to their previous methods. The FAA uses GIS to create standards on collecting high quality data, which includes surveying and geodetic control, aerial photography, and ways to attribute and organize the data into a database. There data collection allows them to extract airport features that include, pavement edges, paint markings, lighting and navigational aid facilities from georeferenced aerial photography. The FAA uses proper geodetic control using ground reference points to accurately record topological integrity of the features. The article shows how GIS can benefit airports by, “increasing productivity…. more efficient planning ...improved safety and efficiency ...elimination of redundant airport mapping and survey costs” (45-46). GIS has helped the FAA with coordination and has reduced the time and paperwork needed to establish instrument procedures at airports. Data is now organized and managed under one database which has created consistency and avoided redundant data creation help saving the FAA time and money. GIS allows the FAA to create metadata that can show the source of the data and the methodology established to create the data. Geospatial mapping helps improve situational awareness of pilots at airports which they utilize in their cockpits. The FAA shows how GIS is a helpful tool that can be utilized for transportation planning and land use compatibility for airports which ties directly with the topic of this project. GIS has been implemented in a study in Andhra Pradesh, India to help land use planning (Yekola, 2012). The article talks about how GIS can be used for “scientific investigations, resource management, asset management, environmental impact assessment, urban planning, cartography, criminology, history, sales, marketing, and logistics” (2168). This tool allows emergency planners to calculate emergency response times in the occurrence of natural disasters. Environmental planners can use GIS to view wetlands that need protection against pollution. The researchers in this article used AutoCAD drawings and word documents as data for their GIS analysis. The data they collected was georeferenced, digitized, and attributed using GIS. They applied GIS in their research to classify schools based on specific criteria to find schools that lack proper standards that the government requires. GIS has allowed the researchers to determine water distribution to identify which areas are most and least served. Traffic analysis is easily done using GIS allowing planners to determine where the most traffic occurs, to know where their attention needs to be given to most. They mapped pollution levels in their city to view which areas are most affected by pollution. With this knowledge, planners can know where to reduce traffic by lowering its volume and creating alternate routes to reduce pollution in that area. This study relates directly to this project with it showing how GIS can be used in land use planning. The ideas in each example used in this study can be utilized and appropriately modified to fit transportation planning standards and needs for aviation land use compatibility. This study has only a few examples of how planners are able to use GIS to visualize several problems and integrate each to make more informed decisions in land use planning. A recent study done by the Airport Cooperative Research Program explains how GIS can be used for collaborative land use planning near airports. The study shows how aviation transportation planners can utilize GIS to map aircraft noise in the form of noise contours. Noise contours can show which land uses near airports are within a certain noise level. The closer the land use is to the airport the louder the noise contour will usually be. It is important for planners to see if the proper land uses are within the noise contours because some land uses such as residential can be classified as sensitive groups and must be away from the high noise contours and a sufficient distance away from the low noise contours. The study shows how GIS can be used to map airport safety zones. Based on each airport safety policies, GIS can map the airports safety zones to show which land uses are within the airports airspace. This is important for planners to know to prevent certain land uses that can obstruct the airports airspace are far enough away to not cause any problems. Both the noise contours and safety zone map the study explains can be done with GIS are what this project focuses on. This study both inspired and helped direct this project to answering how GIS can help land use compatibility near airports. (National Academies of Sciences, Engineering, and Medicine, 2019). | ||
|
Methods This study follows the methodology explained in the “Using GIS for Collaborative Land Use Compatibility Planning Near Airports” study. Detailed in this study, the best source for land use planning data is from the county or city open data consortia. This project was narrowed down to focus on the Sacramento International Airport due to time constraints and the amount of data required to do data analysis on every California airport. The airport locations, boundaries, and runway GIS data were retrieved from Caltrans. Both the Sacramento International Airport noise contours, and safety zones were obtained from SACOG. Current land use data were obtained from the City of Sacramento Open GIS data library. Using the land use and transportation data acquired from Caltrans, SACOG, and the City of Sacramento two maps were created for this project. The first map deals with aircraft noise and uses the Sacramento International Airport’s noise contours to help show the noise extent of the airport. These contours are overlaid on the current land use data to visualize the levels of noise each land use near the airport experiences. This helps aviation planners see if there are any potential sensitive noise land uses near the airport. They want to know if each land use near the airport are compatible with the airport’s aircraft noise. The other map in this project shows the safety zones for the Sacramento International Airport. Using the same method as the other map, the safety zone maps overlays the airports safety zones on top of the current land use near the airport. This map can be used by aviation planners to see if there are any potential land uses that can obstruct or affect the flightpath of the airport’s aircrafts. This can help prevent any land uses that can cause problems for the airport from being within the safety zones. |
Results The GIS data for the airport’s location and runway were retrieved from Caltrans. This source was chosen based on my own experience with Caltrans data. My current internship with Caltrans Aeronautics division allowed me to know the accuracy of their GIS aviation data and gave me great confidence knowing that this data is the most accurate. The noise contours and safety zones for the airport were not found on Caltrans open GIS website, and from the ACRP report’s influence were discovered on SACOG’s Airport Land Use Commissions website. The ACRP report gave direction to where current land use data would be located. Based on the airports location, the Sacramento land use parcel data was accessed on the city of Sacramento’s open GIS website. All the sources used for both maps provided the most accurate and up to date GIS data and explain why this project sourced data from them. Figure 1 and 2 show the results of the noise contour and safety zone maps. Both maps were created using ArcGIS Pro and overlays the noise contours and safety zones of the Sacramento International Airport over current Sacramento land use data. These maps are formatted in this way to show if each land use is compatible with the airport and highlight any potential safety or noise problem that would make the current land use incompatible with the airport. |
|
|
Maps | ||
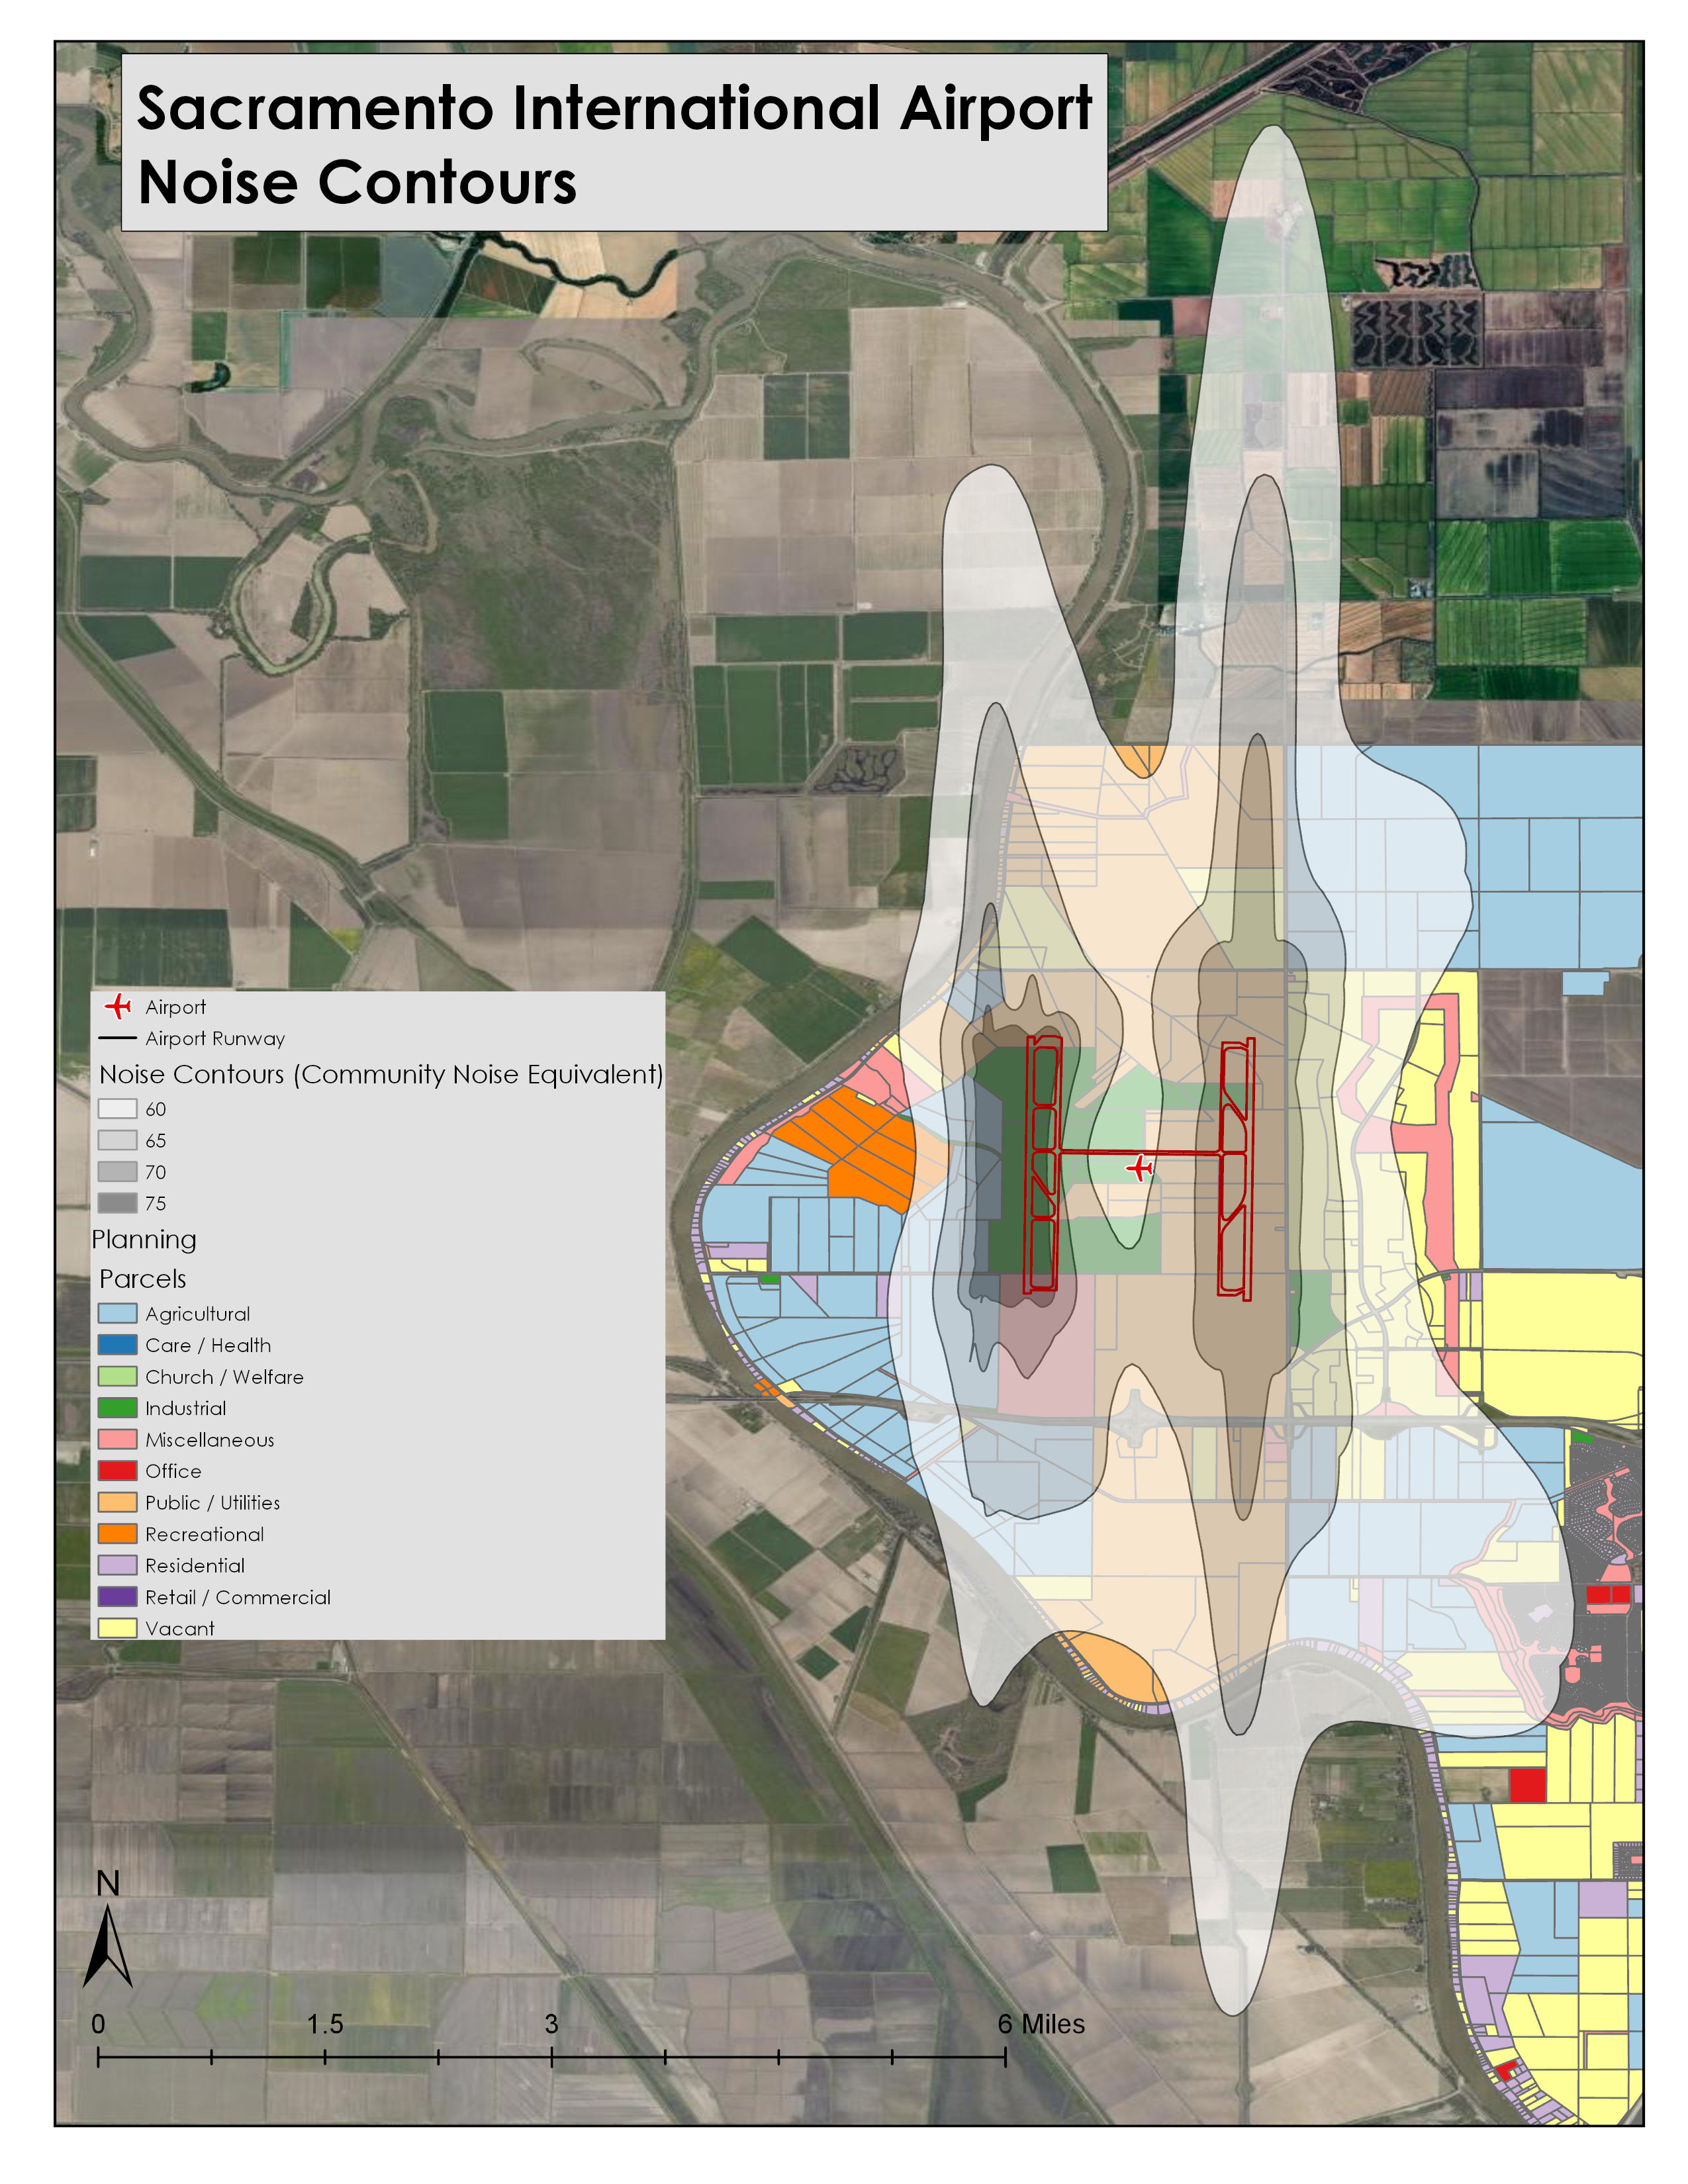 |
Figure 1: Sacramento International Airport’s Noise Contour Map | |
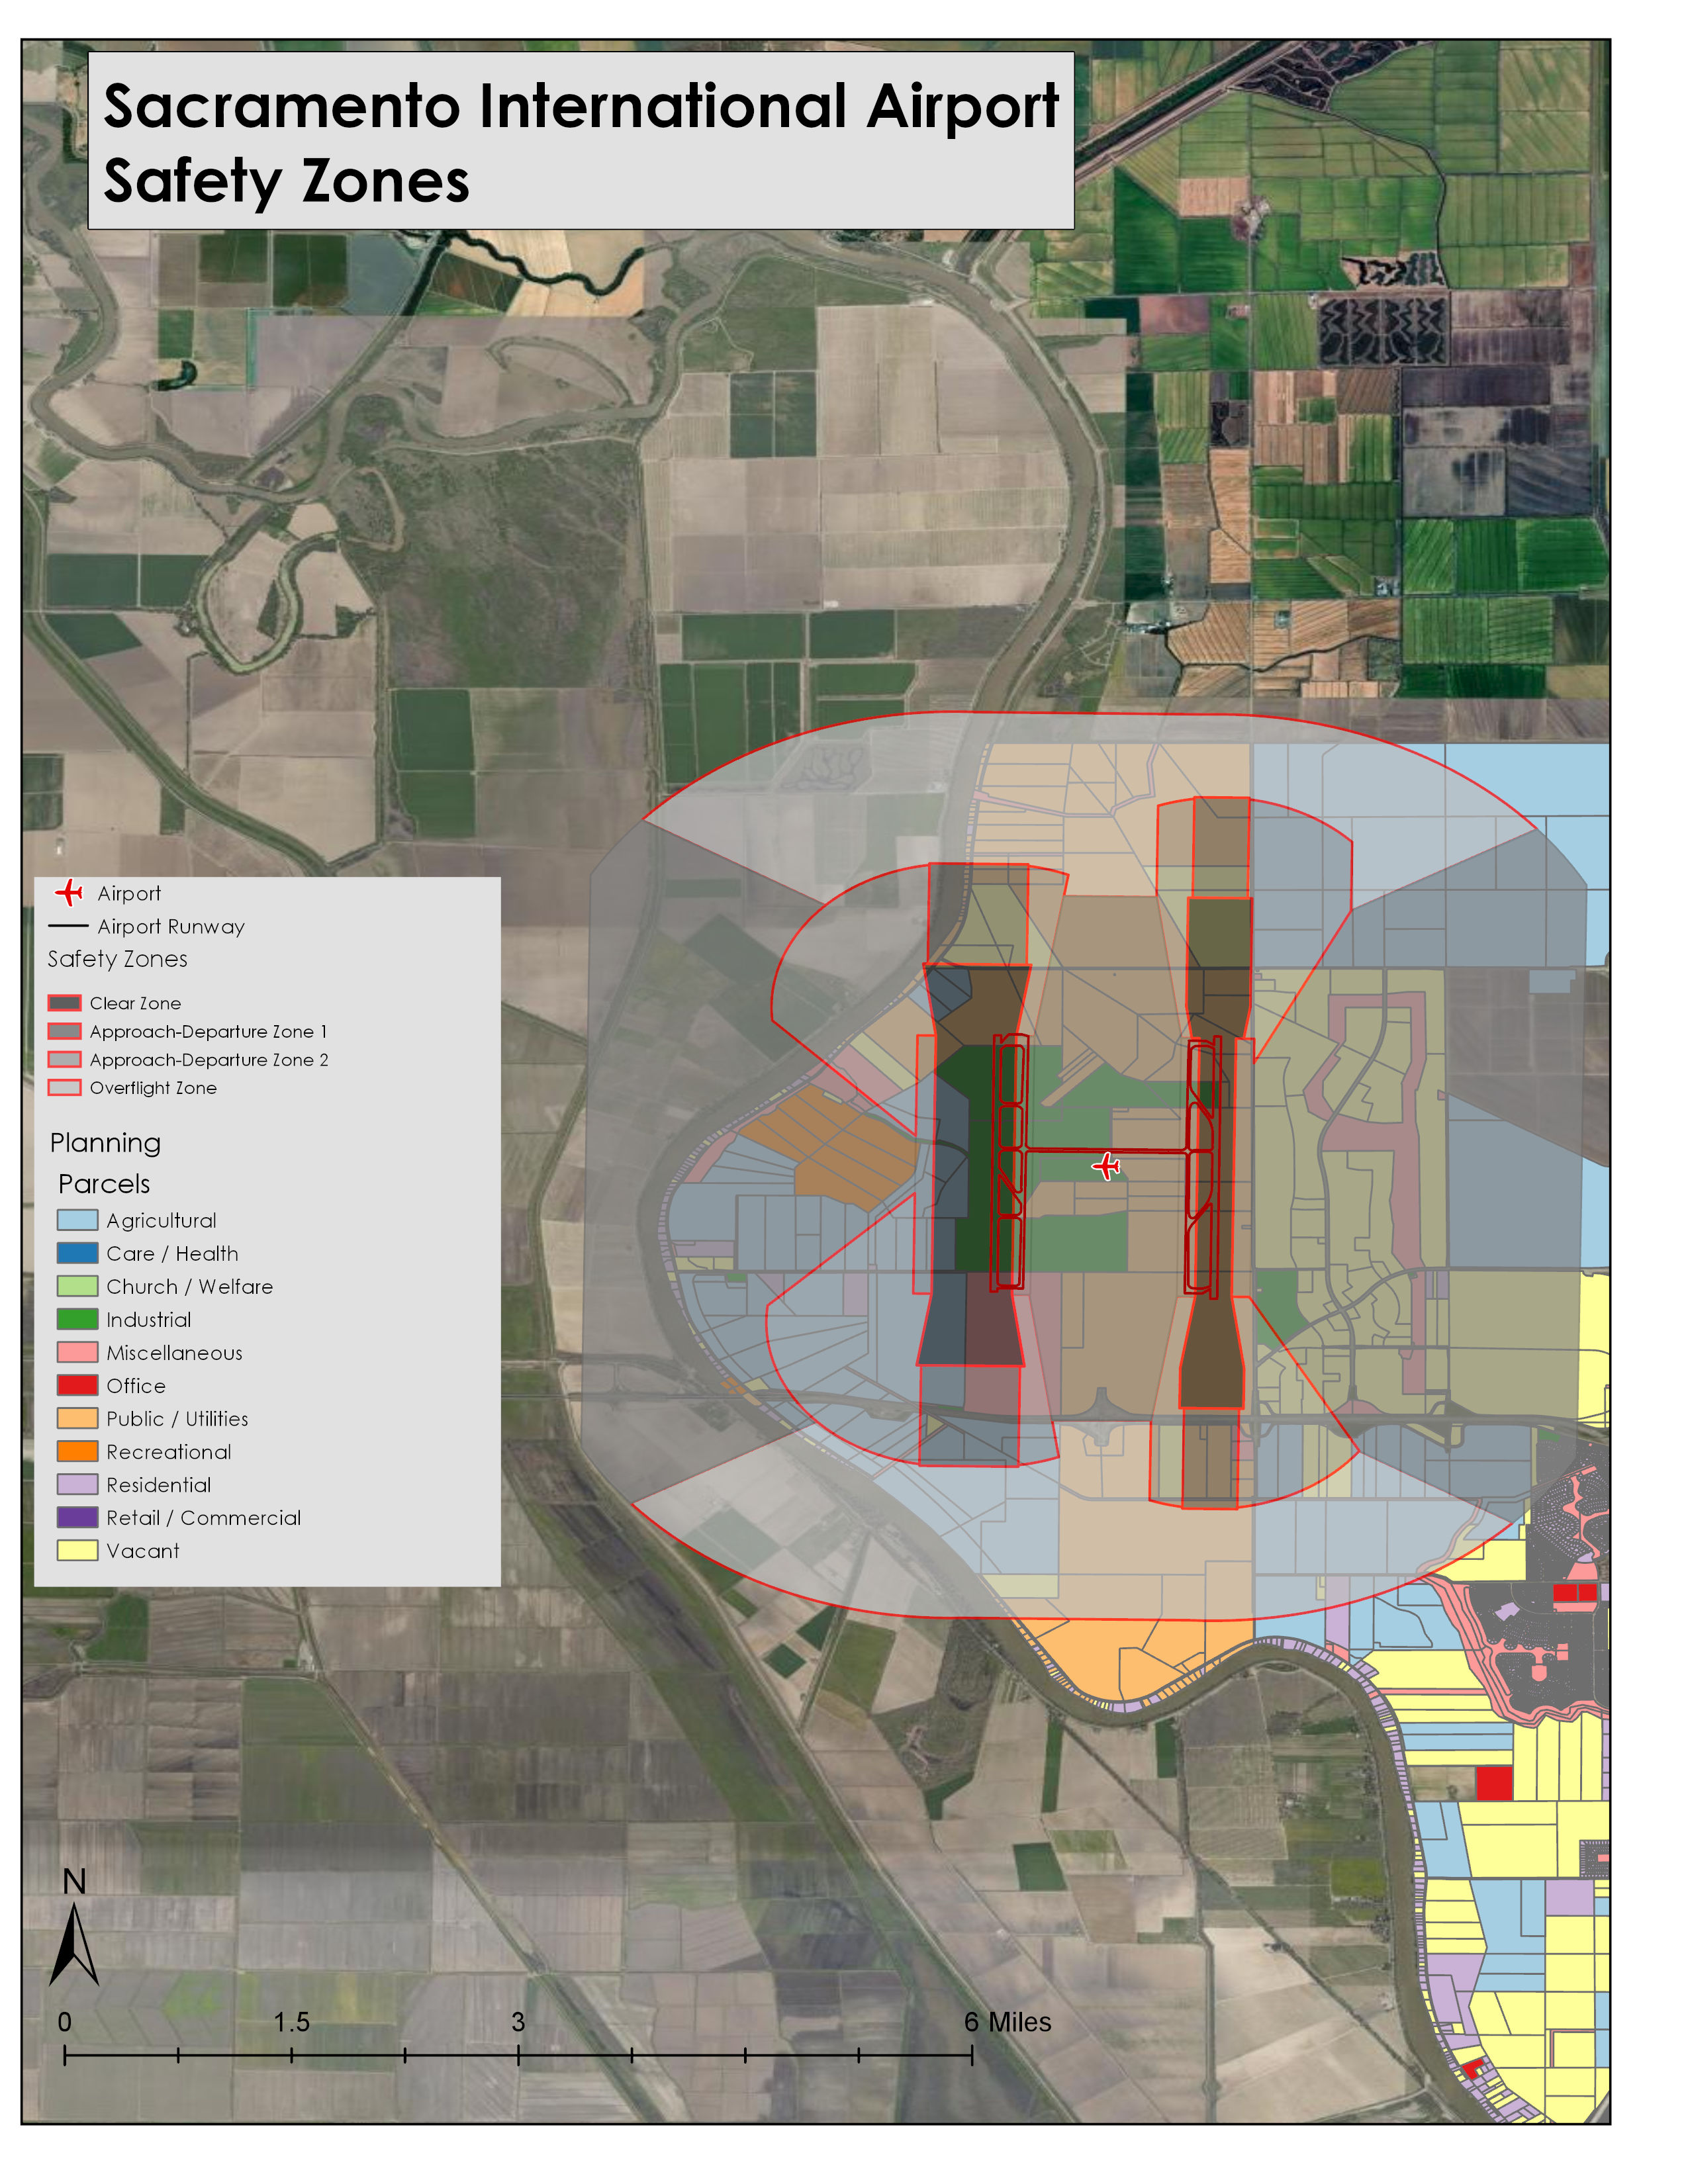 |
Figure 2: Sacramento International Airport’s Safety Zones Map | |
|
Analysis Based on Figure 1, it appears that airport itself is categorized as being both industrial and public/utilities land use. The airports boundaries show to be within the 70-75 decibel noise contours which represent the highest levels of noise the aircrafts create in the airport. The next two noise contours are 60-65dB and have a few different lands uses within them. Based on the Sacramento parcels, theses noise contours have recreational, agricultural, vacant, industrial, public/utilities, and residential land uses. Most of the land uses within the lower noise contours would be compatible with aircraft noise. The only land use that would seem to be incompatible is the residential land use in the light purple located in the 60dB contour southwest of the airport. Further analysis of this specific site shows that it is a single family rural residential home over 5 acres. Based on the Caltrans Airport Land Use Handbook, the 60-dB contour noise does not cause hearing loss, and typically causes moderate community reactions (Division of Aeronautics, 2011). This area may not cause hearing loss but can become a moderate irritant for anyone living in the residential land use. In Figure 2, the darkest zone labeled clear zone, known now as runway protection zone, has industrial, public/utilities, and agricultural land uses within it. Each of these land uses are normally allowed and should cause any safety concerns for the airport. Both Approach/Departure zones have agricultural, recreational, vacant, industrial, and residential land uses within them. This residential land use is the same area as identified as a potential noise problem in the previous map but based on safety standards is allowed due to having low density based on the low amount of people the land use permits but is limited in this zone. Typically for this safety zone, it is best to avoid putting high density land uses such as high residential and commercial areas. The last zone labeled overflight zone, also known as traffic pattern zone, in the map in Figure 2 has agricultural, vacant, and public/utilities in the zone. Each of these land uses are compatible with the safety standards for this zone which allows some residential uses that are however limited to the noise standards (Division of Aeronautics, 2011). This study has some clear limitations in that it originally covered a wide geographic area that included all airports in California but was reduced to Sacramento International Airport. Due to time constraints, only noise contours and safety zone maps created to help answer how GIS can help aviation land use compatibility planning. The safety and noise analysis are limited to just the one airport and does not include other airports to help see if other airports have safety or noise incompatible land uses near them. Both maps include general land use data and do not clearly specify what is in the land use. Despite these limitations this project was able to show how GIS can be used in aviation land use compatibility planning as far as aircraft safety and noise are concerned. | ||
|
Conclusions GIS is an essential tool when dealing with both transportation and land use. Land use compatibility is a significant part of transportation planning and needs GIS to help visualize any potential problems. Airport land use compatibility planners can use GIS to show potential noise or safety problems land uses near airports can create. Mapping current land uses and overlaying an airport noise contours can help the planner determine which land uses may be sensitive areas and have problems with high aircraft noise. Using the same land use data planners can also overlay the airports safety zones to show if there are any land uses that could potentially cause problems with an aircraft’s flight plan. It is important for planners to know in case of emergency that pilots can know where to land, avoiding high density land uses. Further research can be done to use GIS to visualize potential obstructions to an aircraft's flight plan, specific fauna that is hazardous to aircraft operations, solar interference, and other examples the ACRP report provides. This project only details two specific examples and only focuses on one airport, and further study can be done on other airports in California or elsewhere. | ||
|
References Caltrans, 2019. Aviation Datasets. https://gisdata-caltrans.opendata.arcgis.com/; web2019.12.10 City of Sacramento Planning, 2019. Parcels. Sacramento Open Data. https://saccity.maps.arcgis.com/apps/webappviewer/index.html?id=6f8e021cb286482b9a649e33 ac6e67ea; web2019.12.10 Division of Aeronautics. “California Airport Land Use Planning Handbook.” Caltrans. 2011. McNerney, Mike. “Using enterprise geospatial data for airport surveying and aeronautical information management programmes in the FAA.” Journal of Airport Management, Volume 9, Issue 1. 30 September 2014. National Academies of Sciences, Engineering, and Medicine. “Using GIS for Collaborative Land Use Compatibility Planning Near Airports.” Washington, DC: The National Academies Press. 2019. SACOG, 2019. Sacramento International Noise Contours. Airport Land Use Commission. https://www.sacog.org/post/airport-land-use-commission; web2019.12.10 SACOG, 2019. Sacramento International Safety Zones. Airport Land Use Commission. https://www.sacog.org/post/airport-land-use-commission; web2019.12.10 Yekola, S. Reddy, et al. "Land use planning using geographical information systems (GIS)." International Journal of Engineering Science and Technology, Volume 4, Issue 5 May 2012. | ||