| Title Worth the fire risk? A study on vulnerable populations within the Camp Fire boundary. | |||||||||||||||||
|
Author Michael Falsetto American River College, Geography 350: Data Acquisition in GIS; Fall 2019 Contact Information (email: w1680925@apps.losrios.edu) | |||||||||||||||||
|
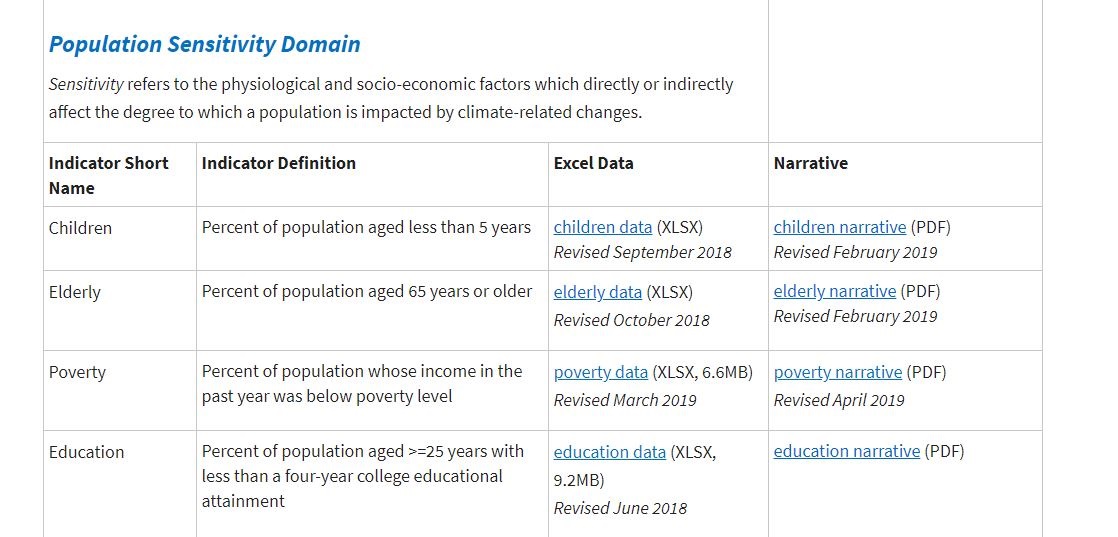
Abstract This project involves analyzing vulnerable populations within the Camp Fire boundary that occurred in the Fall of 2018. The Forest Resource Assessment Program (FRAP) of CalFire, compiled a 45-day report in the Camp Fire after math to better reduce public safety risks for over 200 of California’s most wildfire-vulnerable communities. Demographics were one of the factors in analyzing what communities are most at risk from wildfires. The methodology to determine population vulnerability to wildfire risk and climate effects was taken from the Department of Public Health’s California Building Resistance Against Climate Effects (CalBrace). Education, poverty, children under the age of 5, vehicle ownership, and physical and mental disabilities are just some of the climate change and health vulnerability data and indicators described in the assessment. Some of these indicators, (Under age 5, over age 65, percentage with disabilities, households with no vehicle, and population without health insurance), were used in the analysis by joining this data to census tracts contained within the Camp Fire boundary. | |||||||||||||||||
|
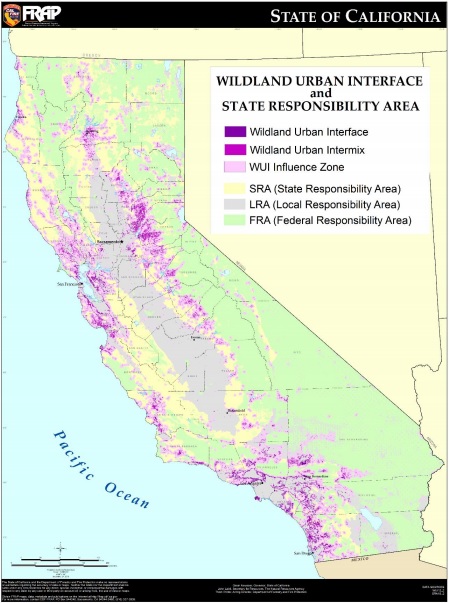
Introduction The great outdoors. Wilderness. Pristine natural landscapes. This what draws people out of the urban sprawl, moving further out into the Wildland Urban Interface (WUI). This is where the city meets the rugged mostly untouched topography. Who can blame someone for moving into this space? For vacation time, recreation, or affordability. But is there a risk to living in these landscapes due to increased incidence of wildfires? From 1990- 2010, there has been much expansion of people into the WUI. With this growth, more homes in this area can result in more ignitions. Coupled with dry conditions and increased tree mortality due to invasive species such as the pine bark beetle, all these factors exacerbate wildfire problems in the WUI. With spatial analysis and scientific research to establish these facts, various projects around California have been implemented through state and federal agencies to decrease fire risk within the WUI. The question I want to examine is, who are the people who are more vulnerable to increased fire risk, and where are they primarily located? This will be done by examining a portion of Butte County, specifically where the devastating Camp Fire took place in November 2018. WUI,2018. | |||||||||||||||||
|
Background The Camp Fire of 2018 was the most destructive wildfires in California history. Killing 86 people and destroying 18,804 residences, it burned for 17 days and wiped out the town of Paradise in Butte County. Washington Post, 2018. High temperatures, gusty winds, dead trees, and accumulated dry vegetation allowed for the perfect conditions for a swift moving wildfire that without notice, caught many in its path off guard and without time to plan. This disaster has resulted in many agencies coming together to develop both short term and long term plans to mitigate future wildfire in proximity to vulnerable communities. The Community Wildfire Prevention & Mitigation Report was released by CalFire earlier this year in response to Executive Order N-05-19, requiring CalFire to publish a report on recommendations to mitigate and prevent wildfires to the greatest extent possible. Factors involved in the spatial analysis included density of houses, proximity to Wildland Urban Interface (WUI), and socio-economic factors. | |||||||||||||||||
| : Composite ranks were made for both fire risk and socio-economic factors, and this along with the affected population and acreage were used to determine a final ranking of the projects for priority. 45-day report, 2019. I wanted to conduct my own analysis with GIS on some of the socio-economic factors by census tract level in the camp fire boundary to see where the most vulnerable persons were located, and the percentages of the total population they represented. |
| ||||||||||||||||
|
Methods I wanted to work entirely in ArcMap since this is what I am most familiar with. I thought I could use this and then create simple maps to illustrate both the fire severity, and percentages of a single attribute within the census tracts. To begin, I went to the American Census Bureau website to download shapefiles of California counties and census tracts. I had the Camp Fire Boundary Shapefile downloaded from ArcGIS Online and used the boundary to clip all census tracts contained within it. I then exported this into its own shapefile in ArcMap and downloaded the 15 census tract GEOID ID’s within the Camp Fire Boundary to a .csv file from the ArcMap attribute table. From here I was able to perform an Index Match in Excel for 5 of the socioeconomic described by CalBRACE and used in CalFire’s methodology for determining priority project rankings. | |||||||||||||||||
| These variables included the total population,
percent of children under 5, percent over the age of 65, percent living with a physical or mental disability,
percent living without health insurance, and percentage of households without vehicle ownership.
Once these percentages and total populations were compiled into the .csv file, it could be imported back to ArcMap
and be spatially joined to the census tract layer. From here, it was a matter of appropriately
symbolizing and splitting the ranges of percentages. I also used a CalFire shapefile of fire
responsibility areas to see what severity levels certain census tracts fell into. These severity zones range from Moderate to Very High.
CalBRACE, 2019. |
| ||||||||||||||||
|
Results I was able to get some information on the data I chose for this analysis.
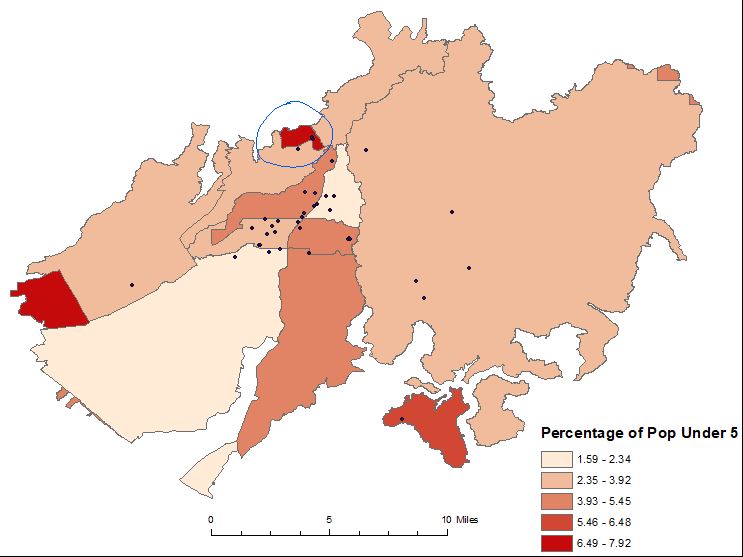
I saw that the largest percentage of the population under age 5 resided in census tract 17.03 (7.92%).
This is out of both federal and local jurisdictions in regards to fire responsibility areas. | |||||||||||||||||
|
Some of the larger census tracts were clipped using the clipping tool,
resulting in inaccurate geometry for the spatial join. One could perform the analysis including
all census tracts that intersect the Camp Fire boundary instead of being solely contained within it.
This would be more representative of the actual geometry and percentages associated with them. | ||||||||||||||||
|
Figures and Maps | |||||||||||||||||
 |
 | ||||||||||||||||
|
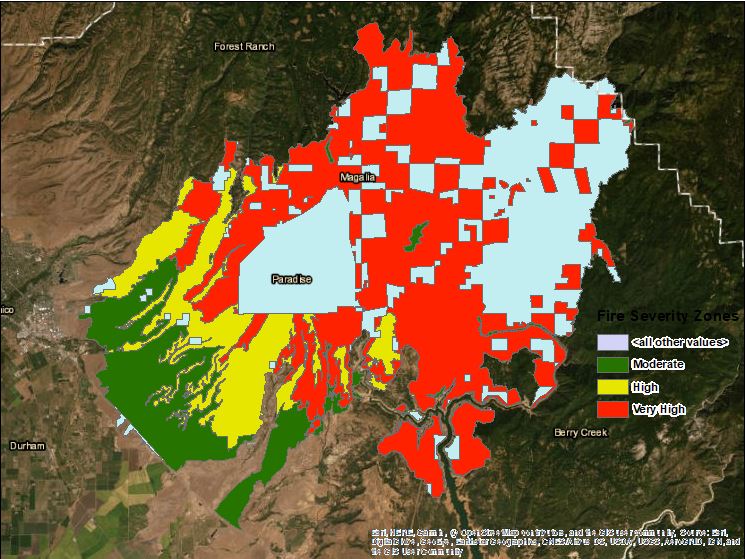
Left Above: Percentages of population under 5. Census Tract 17.03 is circled. Right Above: Fire Severity Zones. Census Tract 17.03 is in the 'Very High' Severity Zone. | |||||||||||||||||
|
Analysis I created two simple maps to illustrate how
one might perform a simple analysis using some of the data I imported.
Symbolizing the census tracts for percentage of population under 5 by natural breaks yielded
a good look at how percentages differed among census tracts. Census Tract 17.03 had the greatest percentage of 7.92%.
By a simple eye test, one is also able to see what Fire Responsibility Area this census tract is under.
I symbolized the Federal, Local, and State Fire Responsibility areas and concluded that census tract 17.03
was under total SRA of the highest severity. I also added critical facilities to the map to see if any were
contained within this particular census tract. The census tract contained a medical clinic, Fire Station,
and County Sheriff deployment. One could do much more with spatial analysis here, I wanted to demonstrate a small use of it,
and then explain what worked, what didn't, and what I would do differently. | |||||||||||||||||
|
Conclusions There can be many permutations done for analyses
involving fire severity zones and vulnerable populations. Firstly, geocoding raw data of persons
instead of joining aggregate data to census tracts would yield actual address that could be spatially analyzed.
One would have to consider De-identification for this purpose. Once geocoding is completed, once could use
a buffer from an emergency facility such as a fire station to see how many persons are within a certain response radius.
Other considerations for analysis would be using other socio-economic factors such as persons below the Federal Poverty Level,
percentage of population who do not possess a 4-year degree, race and ethnicity, etc. FRAP has cited that more
research into socio-economic vulnerability factors will be a part of their 45-day report (45-day report).
In conclusion, I accomplished what I set out to do in joining aggregate data to census tracts using socio-economic
indicators pertaining to those most at risk to wildfires. I learned that this methodology can apply to much
demographic data, and perhaps I will use this to apply to my own work at Social Services.
I have access to address data of persons that I can geocode to get specific locations and perform spatial analysis. | |||||||||||||||||
|
References American Community Survey (ACS), September 26, 2019. United States Census Bureau. Accessed September 29, 2019. Available: https://www.census.gov/programs-surveys/acs/data.html California Building Resilience Against Climate Effects (CalBRACE), October 15, 2019. California Department of Public Health. Accessed October 15, 2019. Available: https://www.cdph.ca.gov/Programs/OHE/Pages/CC-Health-Vulnerability-Indicators.aspx Community Wildfire Prevention & Mitigation Report, In response to Executive Order N-05-19, February 22, 2019. California Department of Forestry and Fire Protection. Accessed September 22, 2019. https://fire.ca.gov/media/5584/45-day-report-final.pdf Tiger/Line Shapefiles, September 18, 2018. United States Census Bureau. Accessed September 29, 2019 Available: https://www.census.gov/geographies/mapping-files/time-series/geo/tiger-line-file.html Volker C. Radeloff, David P. Helmers, H. Anu Kramer, Miranda H. Mockrin, Patricia M. Alexandre, Avi Bar-Massada, Van Butsic, Todd J. Hawbaker, Sebastián Martinuzzi, Alexandra D. Syphard, Susan I. Stewart. “Rapid growth of the US wildland-urban interface raises wildfire risk.” PNAS March 27, 2018 115 (13) 3314-3319; first published March 12, 2018. Accessed October 1, 2019. Available: https://doi.org/10.1073/pnas.1718850115 Wootson, Cleave Jr, November 26, 2018. The deadliest, most destructive wildfire in California’s history has finally been contained. The Washington Post. Accessed November 11, 2019. Available: https://www.washingtonpost.com/nation/2018/11/25/camp-fire-deadliest-wildfire-californias-history-has-been-contained | |||||||||||||||||