| Title A Flood Inundation Map of California State University, Sacramento | |
|
Author Joan Lopez American River College, Geography 350: Data Acquisition in GIS, Fall 2019 Contact Information w1667993@apps.losrios.edu | |
|
Abstract California State University, Sacramento is currently and has been susceptible to flooding in the past due to the close proximity of the American River flowing east of the campus. The university has experienced numerous occasions where the American River has spilled over the levee and inundated low lying areas on campus, most notably during the flood of February 1986. Since then, the campus has flooded intermittently during periods of heavy rainfall. FEMA categorizes the campus as in an area where there is ‘little flood risk due to levee’ but my project explores the possibility of a future flood on campus and what areas would be under water at certain depths. Using just an orthophoto of the area, a DEM of the campus, and a shapefile of the campus’s parameter, I utilized the raster calculator geoprocessing tool to synthesize several rasters representing inundated zones if the water line reached several elevations. This project confirms that specific areas are more susceptible to flooding than others because they are lower in elevation relative to other parts on campus. As someone who has attended Sacramento State for 5 years and worked on campus for the last 7 years, it is important for me to know what regions, buildings, and facilities will become inundated if the campus were to flood again. | |
|
Introduction California State University, Sacramento resides in the heart of Sacramento, the city with the greatest flood risk of any major city in the country, with only a 7 meter tall levee separating the 300 acres of campus from the American River to the east (SAFCA, 2008). The flood in February 1986 caused the river to swell over the top of the levees almost touching the bottom of the Guy West Bridge, a pedestrian bridge connecting the campus to a low lying neighborhood (Linggi and Rostad, 2012). Record flows eroded the levees and banks along the river and submerged the campus in flood water. The growing student body (over 31,000) and faculty population of the university renders the campus’ location as primed for another flood disaster. This project utilizes data from the Federal National Map Viewer, FEMA, and self-created shapefiles to synthesize a flood inundation map of the university. This map will show the areas that would be submerged at various depths if another flood were to engulf the campus. | |
|
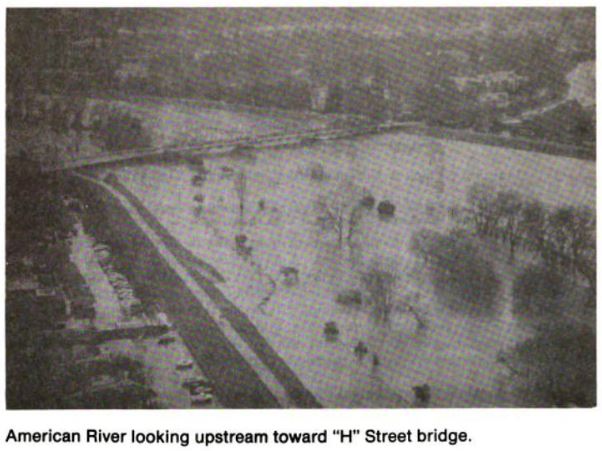
Background Sacramento has a long, documented history of flooding dating back to the mid-nineteenth century (SAFCA, 2008). A more notable flood that directly hit Sacramento State University occurred in February 1986 when Sacramento received 10 inches of rain in 11 days causing Folsom Dam to be downgraded to a 60-year flood level (SAFCA, 2008). This devastating flood resulted in 13 deaths and over $400 million in property damage, which included the campus facilities along the American River (SCWR). | |
This image to the right was taken from a report written by the U.S. Army Corps of Engineers (USACE) only 1 year after the 1986 flood. The image is of the American River looking upstream toward J Street Bridge with the university in the bottom left during the 1986 flood event (USACE, 1987). |
|
Sacramento continues to experience high flow events after the February 1986 flood during the years of 1995, 1997, 2006, 2009, and most recently 2017 (SCWR). In response to these flood events, the Sacramento Area Flood Control Agency (SAFCA), Federal Emergency Management Agency (FEMA), Bureau of Reclamation, and USACE implement flood protection initiatives to make Sacramento and Sacramento State University safer during high flow events (SAFCA, 2008). These initiatives include upgrading Sacramento’s levees to the goal of a 200-year flood protection level (Linggi and Rostad, 2012). | |
|
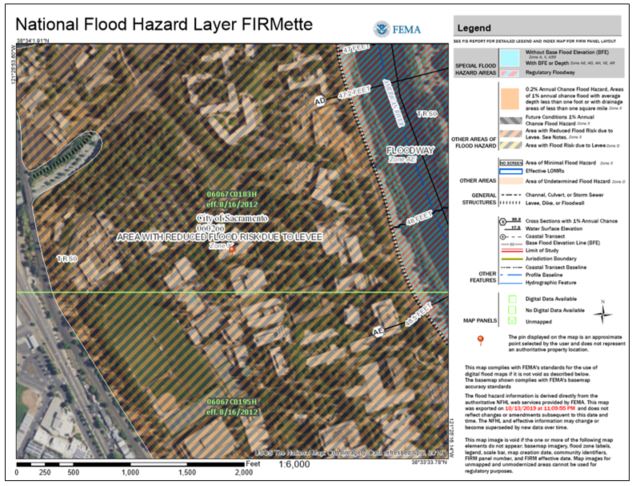
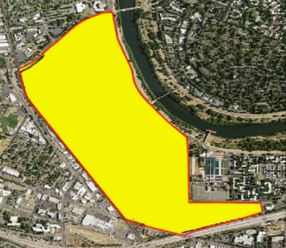
The image to the right was downloaded from the FEMA Flood Map Service Center and shows that the university is currently zoned as “area with reduced flood risk due to levee” (FEMA). My project focuses on mapping the areas of campus that will be flooded at multiple depths if the levee breaks or the water level goes above the elevation of the levee. |
|
|
Methods In order to make a flood inundation of the university, I needed data showing the current flood risk, a high resolution elevation model, and a recent orthophoto of the area. The United States Geological Survey (USGS) maintains a dataset called the National Map. The National Map is part of the USGS National Geospatial Program but collaborates with many other Federal, State, and local partners to update and deliver topographic information to the entire country (USGS). I downloaded and used several orthophotos of the campus as well as a digital elevation model (DEM) of the local area. The two orthophotos that I mosaicked together into one raster is from 2016. The digital elevation model has a resolution of 3.4 meters and is from 2009. Next, I uploaded a layer from Living Atlas in ArcPro called ‘FEMA_100-Year_Flood_Zones_in_the_USA’ to verify that the university is classified as residing in a non-flood zone according to FEMA. To this day, the campus is not considered at risk of flooding due to current levee integrity (FEMA). | |
Next, I made a shapefile of the campus boundary. After this was complete, I had all the data necessary to make a flood inundation map of the campus. To localize the DEM I downloaded, I clipped the raster to the campus boundary shapefile. I then created a hillshade from the clipped DEM of the campus to add texture to the elevation surface. |
|
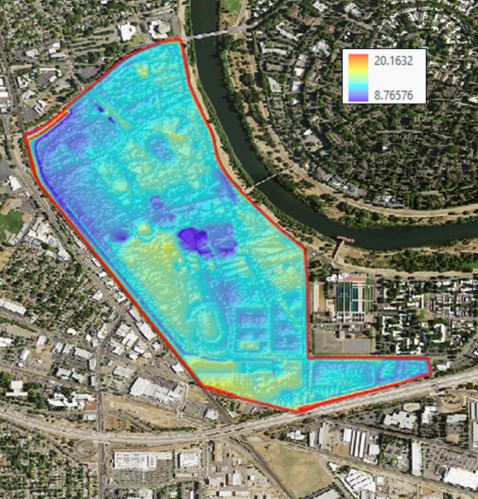
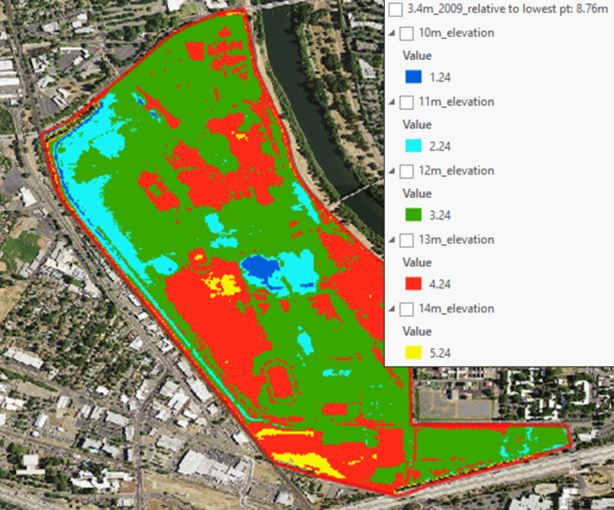
Now that I had all the layers I needed, I began to analyze the DEM. I found that the lowest elevation on campus is 8.76 meters and the highest point on the levee is 16.04 meters. I then used the geoprocessing tool ‘raster calculator’ to produce rasters that represent surfaces below specific elevations. I chose to display surfaces that are at the following elevations: 10 m, 11 m, 12 m, 13 m, and 14 m. I then used the raster calculator tool again to make all the raster surfaces relative to the lowest point on campus (8.76 meters). Therefore, at 10 meters in elevation, the water depth is 1.24 meters from the lowest point on campus. At 11 meters in elevation, the water depth is 2.24 meters. At 12 meters in elevation, the water depth is 3.24 meters. At 13 meters in elevation, the water depth is 4.24 meters. And at 14 meters in elevation, the water depth is 5.24 meters. | |
| |
|
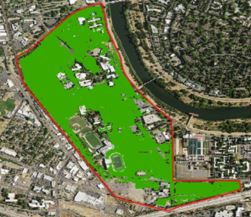
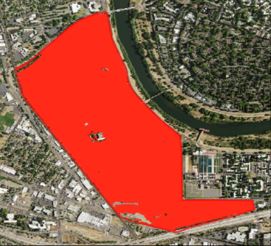
Results Below are figures showing the individual areas of inundation if the water line were to reach 10 meters, 11 meters, 12 meters, 13 meters, and 14 meters in elevation. | |
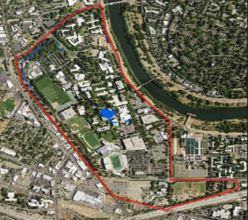 |
10 meters (1.24 meter depth) |
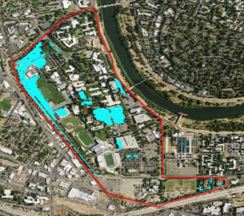 |
11 meters (2.24 meter depth) |
 |
12 meters (3.24 meter depth) |
 |
13 meters (4.24 meter depth) |
 |
14 meters (5.24 meter depth) |
|
Analysis The first thing I noticed about the areas inundated at 10 meters in elevation was that the main area is in the middle of campus. This area is the Sacramento State Library basement that has been flooded before in 2009, where heavy rainfall damaged archives and classrooms (Linggi and Rostad, 2012). The areas to be undated at 11 meters were also in the middle of campus now including the Student Union and the northwest side along J Street and Elvas Avenue. Eventually, the entire campus is inundated when the water line reaches 14 meters in elevation, under over 5 meters in flood water. The main purpose of this project was to display areas of inundation if the water line exceeded the levee height or if the levee were to break. The above results show this. | |
|
Conclusions My project results show me that the library basement is the most vulnerable area if a flood were to occur on campus again. It’s important that students, staff, and faculty are aware of the flood risks around them when working at and attending Sacramento State University. The past has shown us on numerous occasions that the university is at risk of flooding over and over again but that the integrity of the eastern levee is strong and there are many organizations and agencies monitoring the flood barriers. However, with the rise of climate change affecting most parts of the world, it’s important to look at how intense rainfall will affect Sacramento’s levees, infrastructure and overall geomorphology, especially in a well populated area such as Sacramento State University. | |
|
References Federal Emergency Management Agency (FEMA), FEMA Flood Map Service Center, https://msc.fema.gov/portal/home Accessed 30 Sept. 2019. Linggi, Robert and Rostad, Bernt, 2012, “Do Levees Put Sac State at Risk?”, The State Hornet, https://statehornet.com/2012/10/do-levees-put-sac-state-at-risk/ Accessed 13 Oct. 2019. Sacramento Area Flood Control Agency (SAFCA), 2008, “Sacramento Area Flood History”, http://www.safca.org/history.html Accessed 30 Sept. 2019. Sacramento County Water Resources (SCWR), “Region’s Flooding History”, https://waterresources.saccounty.net/stormready/Pages/Region's-Flooding-History.aspx Accessed 30 Sept. 2019. U.S. Army Corps of Engineers (USACE), 1987, “American River Watershed, California”, Information Paper, https://play.google.com/books/reader?id=r_UnQA-aImsC&hl=en&pg=GBS.PP1 Accessed 8 Dec. 2019. U.S. Geological Survey (USGS), The National Map, https://viewer.nationalmap.gov/basic/ Accessed 30 Sept. 2019. | |