Title
California Selective Dangers Map
Author Information
Joshua J. Pirhofer
American River College, Geography 350: Data Acquisition in GIS; Fall 2019
4700 College Oak Dr, Sacramento, CA 95841
w1455381@apps.losrios.edu
Abstract
A working 'build-upon' map of the state of California that highlights various hazards to human health. The maps goal is to
organize any type of hazardous spatial data into an easily accessible easy to use ArcGIS map for anyone to use as they see fit.
The map has no end goal in mind but to be a user friendly map that may or may not help individuals or organizations in solving problems
related to human well-being.
Introduction
There are roughly 40 million people living in California today and each one of them faces a multitude of dangers in their everyday lives. From car accidents to slips
trips and falls human beings can not only be a victims of their own circumstance the geography with which we live in constantly affects our livelihood and
well being in many negative ways. Last year alone 82 people died in the "camp fire" in paradise. Collection of data from past or ongoing geographic related
incidents may help people prepare and be more proactive in avoided an incident or may come up with more prepared contingency plans. A simple easily accessible for anyone
to use map that outlines all the various threats related to geography and human health is attempted to be made using free data accessible to anyone. The map as it
stands is but a springboard of what the idea encompasses with all the data both recent and old all visually appealing and viewed with a few simple clicks, I believe
could be very useful in solving problems in the future and potentially save people. The ArcGIS web map is a simple topographic basemap imagery that using layers
that can be turned on or off to view data (that again could be built-upon) to view and read visual and statistical data that any individual or agency could use
for their specific purposes.
Background
In 1854 an outbreak of cholera was poisoning and killing many residents of Soho, London. A physician named John Snow looked into solving the outbreak.
While chasing down the origin of this sickness Snow designed a map with dots that represented the concentration of cholera cases.
After further study Snow was able to trace the origin of the virus to a pump well on Broad street. John Snow's efforts in using visual representation
and essentially a rudimentary form of GIS helped him to save many lives. This effort is the foundation of my project as we look at how maps have been and will
continue to be used in visualizing geographically linked hazards in order to locate, isolate and potentially eliminate their threats to human life and health.
Methods
The building of this map was all done in the ArcGIS pro software using only data that was obtained the programs living atlas. The only requirements
needed for the data that is visually appealing, had an understandable legend, be related to human health, and be of a sound source. This layers coming
from ESRI made it extremely easy. All the data comes from reliable sources USGS, CalFire etc.
Results
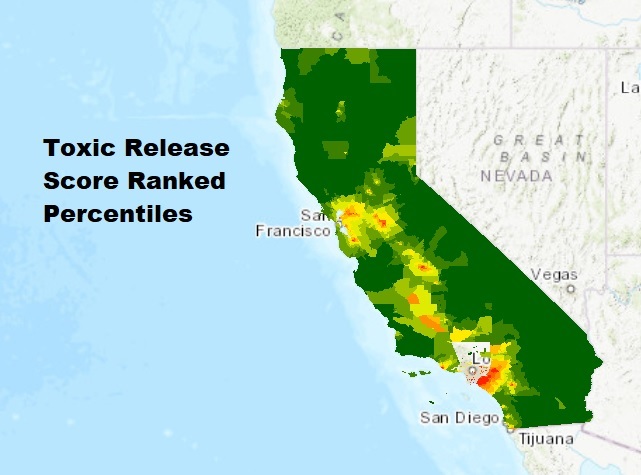
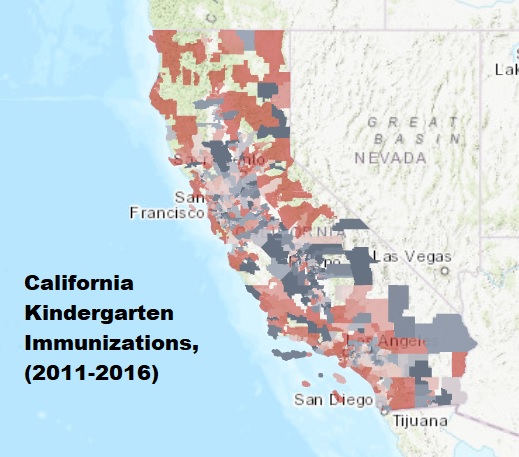
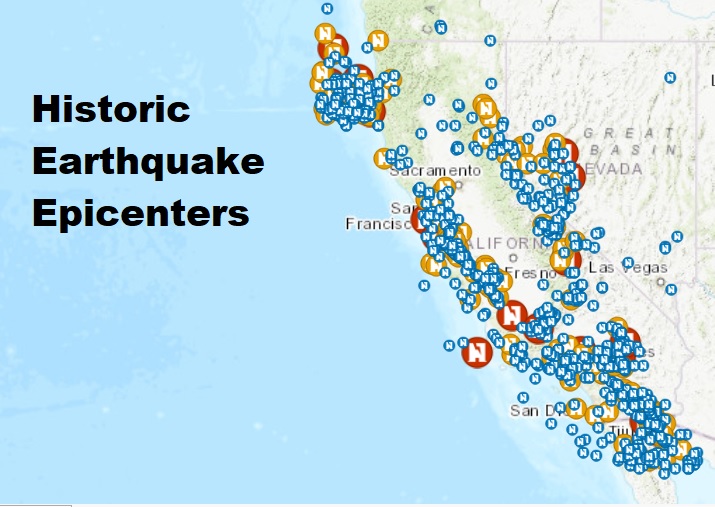
The results is a working web mab with feature layers that can be selected 'on' or 'off'
The compiled data is organized into this interactive web map:
Interactive Map
Analysis
The resulting web map is the basis for the entire idea, the more informational layers added to the map the more data can be used
for purposes that vary from individual or organization. The difficult part of the process was sifting through
various types of the same data to find layers that were already visually pleasing. This process involved first
checking for good sources of data that was the same then sampling in ArcPro which would be the most useful as far
as becoming a feature layer to the map
Conclusion
The possibilities of a simple user friendly map is boundless.
A vast spatial data library was the ambition for this project because I do believe that
large amounts of readily viewable data, available to a potentially unlimited amount of viewers
could result in collaborative problem solving on a massive scale and maybe one day prevent the next
illness or danger that threatens the inhabitants of this planet.
References
https://en.wikipedia.org/wiki/John_Snow
http://www.arcgis.com/home/webmap/viewer.html?webmap=8b3a7c57dbe64a77a9aae26291fc4acc