| Title What if the Great 1906 San Francisco Earthquake Happened Today? | |
|
Author Kathleen Steinbroner American River College, Geography 350: Data Acquisition in GIS; Fall 2019 | |
|
Abstract What risk does the San Francisco Bay Area face when the next damaging earthquake occurs? This project looks the current demographics and infrastructure of the area and places it back in 1906. | |
|
Introduction On the 30th anniversary of the October 17, 1989 M6.9 Loma Prieta Earthquake that struck the Bay Area, and two days after two midsize earthquakes struck the East Bay Area, there is no better time to discuss the risk that living in the San Francisco Bay area has. While the 1906 earthquake occurred over a century ago it is still shaping the San Francisco Bay area. The question that I raise is what if this earthquake happened today? What would it look like? The demographics of San Francisco Bay area are drastically different from 1906. It's a different world and I'd like to see what it'd look like. How many homes would be affected? How many people would be displaced? Placing the footprint of the inferred USGS 1906 ShakeMap over the San Francisco of today would reveal the vulnerabilities that the area faces. | |
|
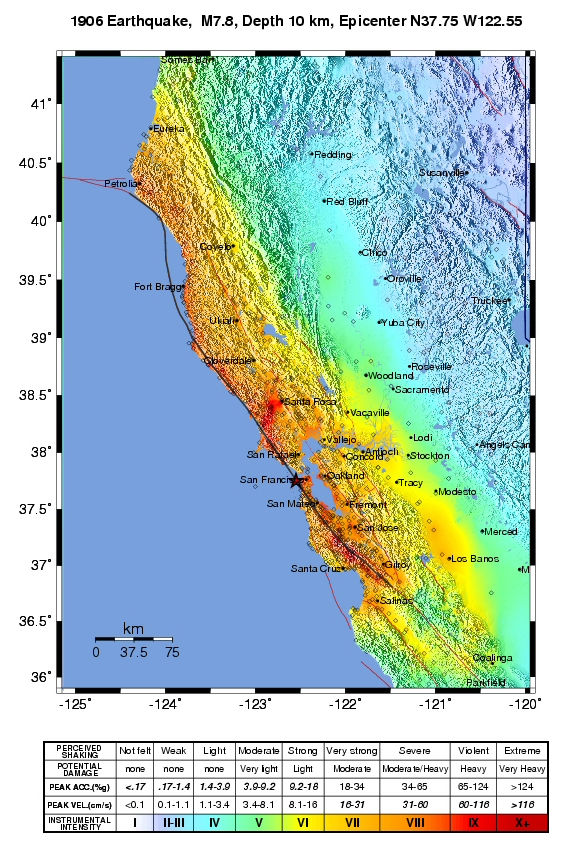
Background The Great 1906 San Francisco Earthquake happened on April 18, 1906 at 5:12 AM. It is considered the most significant earthquake in modern California history. The fault that ruptured was the San Andreas fault, the rupture length was approximately 296 miles (477km), with a maximum surface offset of 20 feet (7m), and a depth slip ranging from 8 to 28 feet (2.4m - 8.5m). The shaking intensity has been debated, due to the historic nature of the earthquake and the lack of seismometers in use at that time, the values range from a magnitude 7.7 to magnitude 8.3. The shaking lasted for about 45 to 60 seconds and was felt from southern Oregon to Los Angeles to central Nevada. During this time the population of San Francisco was 400,000 individuals and the earthquake with fires following caused approximately 3,000 deaths, left 225,000 homeless, 28,000 buildings destroyed, and an estimated monetary loss of $400,000,000 (1906 dollars), of which $80,000,000 were the from earthquake alone. In addtion this earthquake is attributed to the dawn of modern study of the San Andreas fault system in California. Professor Andrew C. Lawson of the University of California, Berkeley lead the way and his final report is still considered one of the leading sources of seismographic information and set the benchmark for future studies in California. This report also provided the basis for the "theory of elastic rebound", the theory that underlays our current view of earthquakes across the world. This subject interests me due to my line of work. I currently work for the State of California at the California Earthquake Authority (CEA). The CEA is the largest carrier of residental earthquake insurance in the state of California. I analyze earthquakes and their potential losses to our Book of Business, meaning how many of our policyholders would be effected if an earthquake were to occur in California today. The analyses I perform directly imapct how much money we need to have on hand to pay the insurance claims. ("The Great 1906 San Francisco Earthquake." USGS Earthquake Hazards Program. United States Geological Survey. n.d.) | |
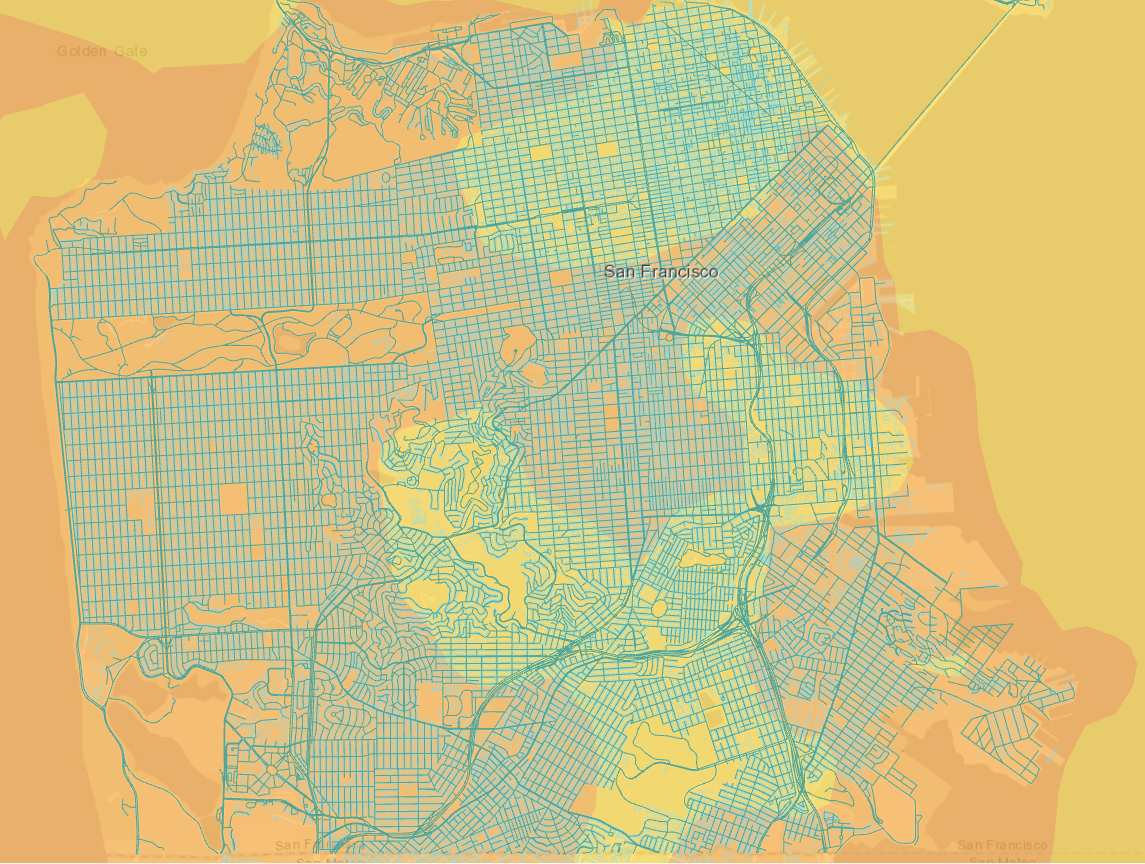
The map to the right is the inferred USGS ShakeMap for the 1906 Earthquake. This map shows the full rupture of the earthquake: The ShakeMap is an automated tool that estimates the shaking variations thoughout a geographic region. These maps are a valuable tool direcly after an earthquake. It shows the intensity of ground shaking which then helps the decision makers send out assistance and aid to the affected communities. USGS Earthquake Hazards Program |
|
|
Methods | |
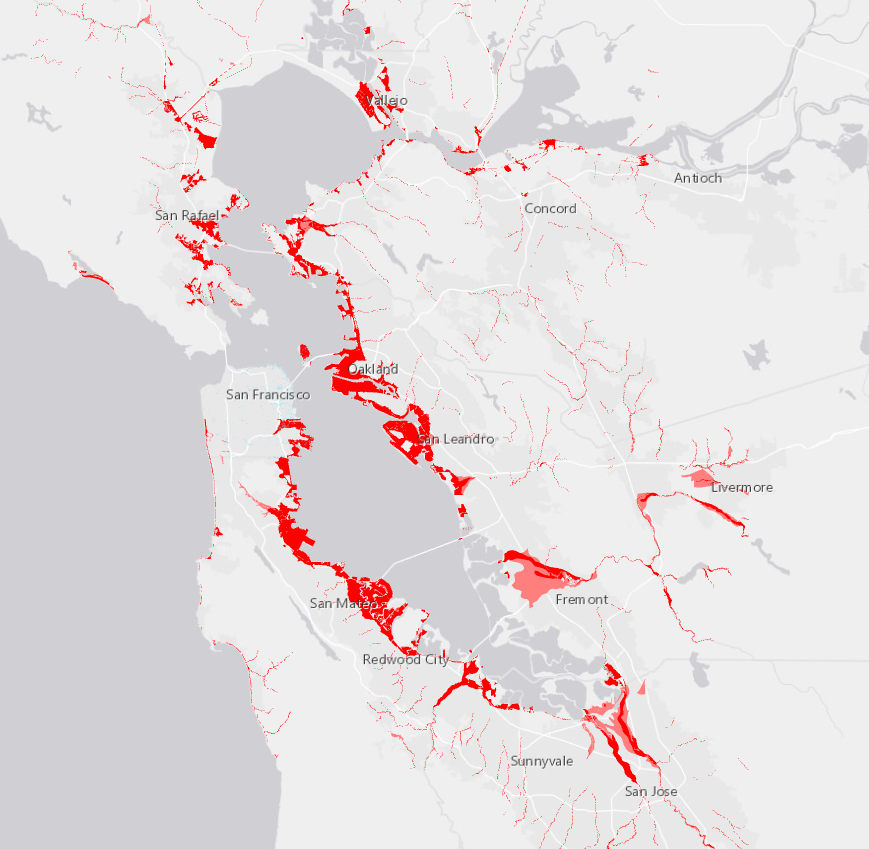
Due to the nature of my work, I was familair with this earthquake and the impact it still has on California. I used ArcGIS Pro to do my cartography work. My first step was fiding the USGS ShakeMap for the 1906 earthquake. The ShakeMap is the basis for my whole anaylsis. It determines the amount of ground shaking and gives me the "bands" of intensity which will contstrain my data. Once that was loaded in, I focused on other hazards that could happen during an earthquake, most notably Liquefaction. Liquefaction is when water-saturated sediment temporarily loses strength and acts as a fluid. This occurs from strong ground shaking. The result is ground failure which can cause severe structural damage. |
|
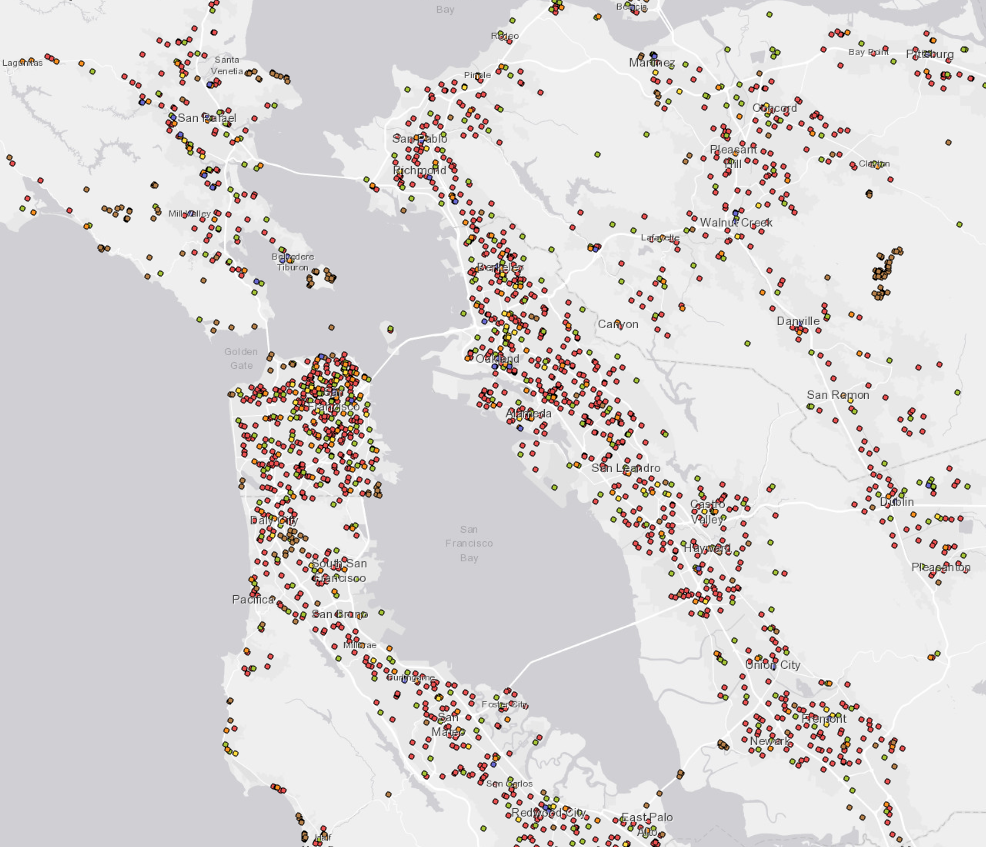
After loading in the hazards of ground shaking potentional and ground faliure from liquefaction, I focused on the human aspect of the earthquake. I researched the U.S. Census Bureau website and found the 2018 American Community Survey population data. I downloaded the County of San Francisco data direcly from "data.census.gov". The current population of the County of SF is 883,305. I also downloaded population data from the surrounding counties. I then focused on what buildings or structures would be the most important after and earthquake. I went to the USGS National Map and found the "National Structures Dataset for the State of California". This robust dataset includes all of the following structures: Education, Emergency Response and Law Enforecement, Mail and Shipping, Health and Medical, Public Attractions and Landmark Buildings, and Government and Military. |
|
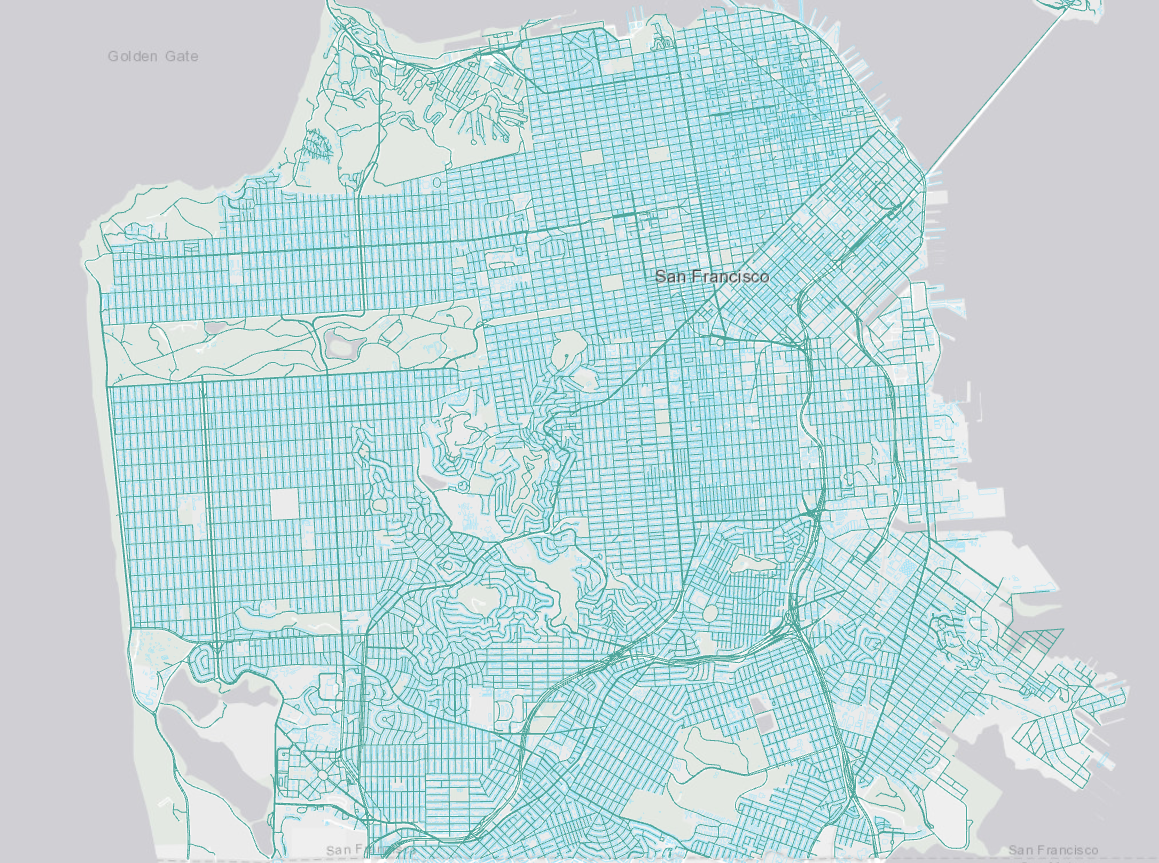
I next focused on the building and road inventory in the City of San Francisco. I decided to zero in on the city because it has some of the oldest infrastructure in the region. I found my next two datasets on the Data.gov website which directed me to open data sources for the U.S. I found a building shapefile through the City of San Francisco Open Data Hub and a roads shapefile through the Department of Commerce Data Hub. |
|
|
Results After layering the above datasets the map created shows the vulnerabilites of the San Francisco Bay region, with a focus on the City of San Francisco. Taking a deeper dive into population, the population of San Francisco County, as of 2018, is 883,305 with 101,436 being 14 years and younger and 138,128 being 65 years and older, both being the most vulnerable populations. The surrounding counties, which consist of: Alameda, Contra Costa, Marin, Napa, San Mateo, Santa Clara, Solano, and Sonoma have a total population of 7,753,023 with 1,316,306 being 14 years and younger and 1,188,840 being 65 years and older. Looking at the "important" buildings in the region, where the population would go for assistance or shelter after an earthquake, there are 335 buildings in San Francisco alone, 62 of which are Emergency Response and Law Enforcement and 14 are Health and Medical. Layering the at the building and road inventory of the City of San Francisco with the USGS ShakeMap, all roads and buildings in the city proper at risk of damage. There are 177,023 distinct buildings in the city and 4,589 road segments all in the Strong (IV), Very Strong (VII), and Severe (VIII) shaking potential bands. |
|
|
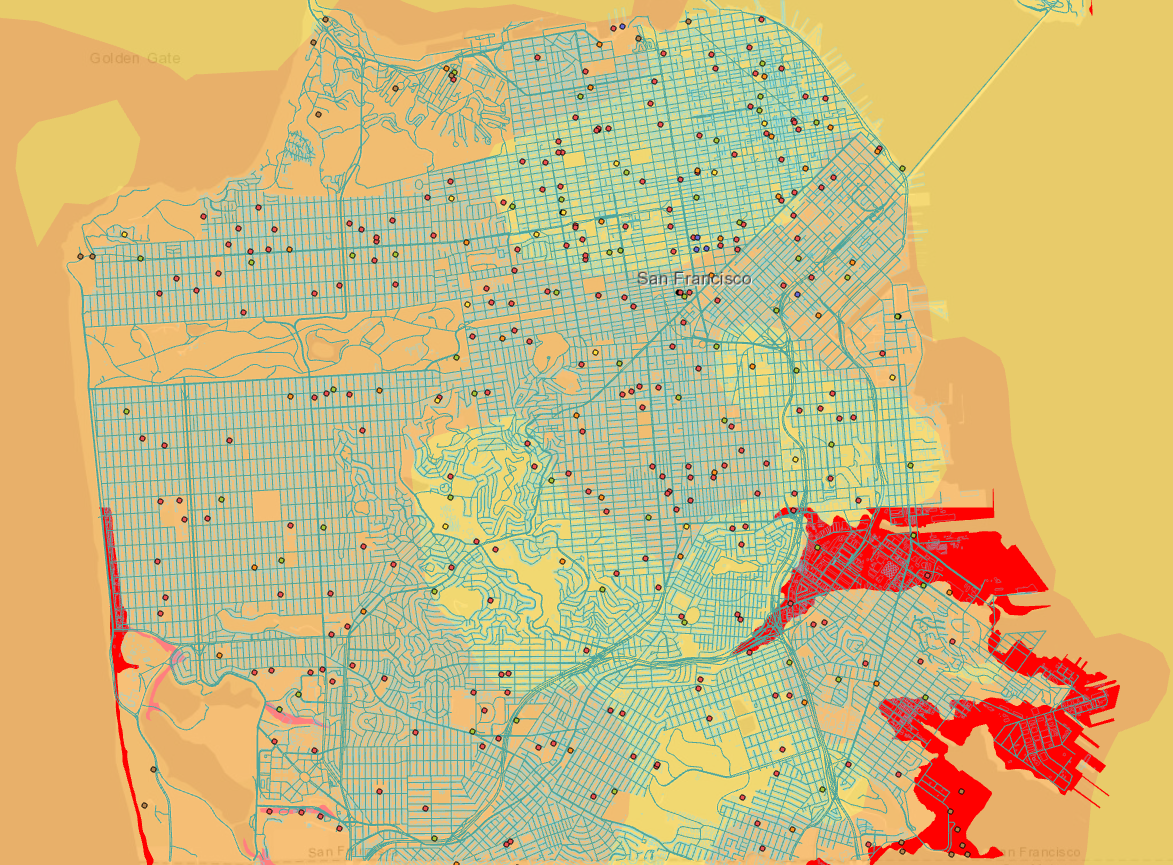 |
The map to the left has all layers I have discussed toggled on. |
|
Analysis Based off the research I did and the previous knowledge I have regarding earthquake loss estimation and hazard prepardness, this tells me that the Bay Area is at high risk for earthquake damage, especially in the City of San Francisco. The city has a large builidng and road inventory that is vulnerable to ground motions and failures. Due to the high population of the city and the region, there is potential for the "important" structures to not be available to the public after the earthquake. The challenges I faced trying to execute this project is trying to find updated, relevant data that could be imported into ArcGIS Pro. Also, I had trouble making the decision on how the data should be displayed once it was imported into the software; as in how to display it in an impactful and meaningful way. The art of map design is very important and something I need to work on. | |
|
Conclusions There is no one solution to the problem. A few ideas is to keep the threat of earthquakes fresh in the minds of Bay Area residents, have prepardness drills and kits to hand out to the public. One thing to focus on, I think, woudld be to make sure that the "important" buildings (as I have defined them in this project), hospitals, fire stations, police stations etc... are up to seismic code so they are available to the public after a damaging earthquake event. | |
|
References Zoback, Mary Lou, 2006. The 1906 earthquake and a century of progress in understanding earthquakes and their hazards. GSA Today, 16(4/5): 4-11. "The Great 1906 San Francisco Earthquake" Earthquake Hazards Program USGS n.d. | |