| Title The Use of GIS for Hydrography and Studies of Watersheds | |
|
Author Jacqueline Chapman American River College, Geography 350: Data Acquisition in GIS; Fall 2020 | |
|
Abstract GIS is a powerful and quickly growingly useful tool for many fields today. With personal interests in civil and environmental engineering this project will have to do with what uses GIS can provide to improve work quality with those fields, particularly I found that it could be very useful as a tool in the field of hydrology and water related topics. For that reason, the data provided will be data on watersheds, precipitation, and other general uses for GIS in similar topics with an area of study being the state of California in the years 2000 and 2010. | |
|
Introduction Water is an important resource and is continually used and reused for a thriving population. The responsibility of managing our groundwater, surface water, and other water sources lies with human beings. The ability to manage and ensure the integrity of water sources lies in the hands of those that set fourth to monitor the sources, train themselves, and inform the public or make educated responses on matters of water sources. Without proper education on how to manage and where to look for problems our entire way of being would cease to exist, and the ecosystem would encounter grave problems. To manage these resources, you must have a bountiful amount of data to monitor natural and unnatural changes to know what is cause for concern. Data that is sampled from wells, lakes, rivers, and other sources are to be gathered and reviewed for changes. In my goal of pursuing environmental engineering GIS is an important tool to monitor data to be aware of changes to the hydrological environment. Further, for the purpose of the project, I will limit the study area to the State of California. | |
|
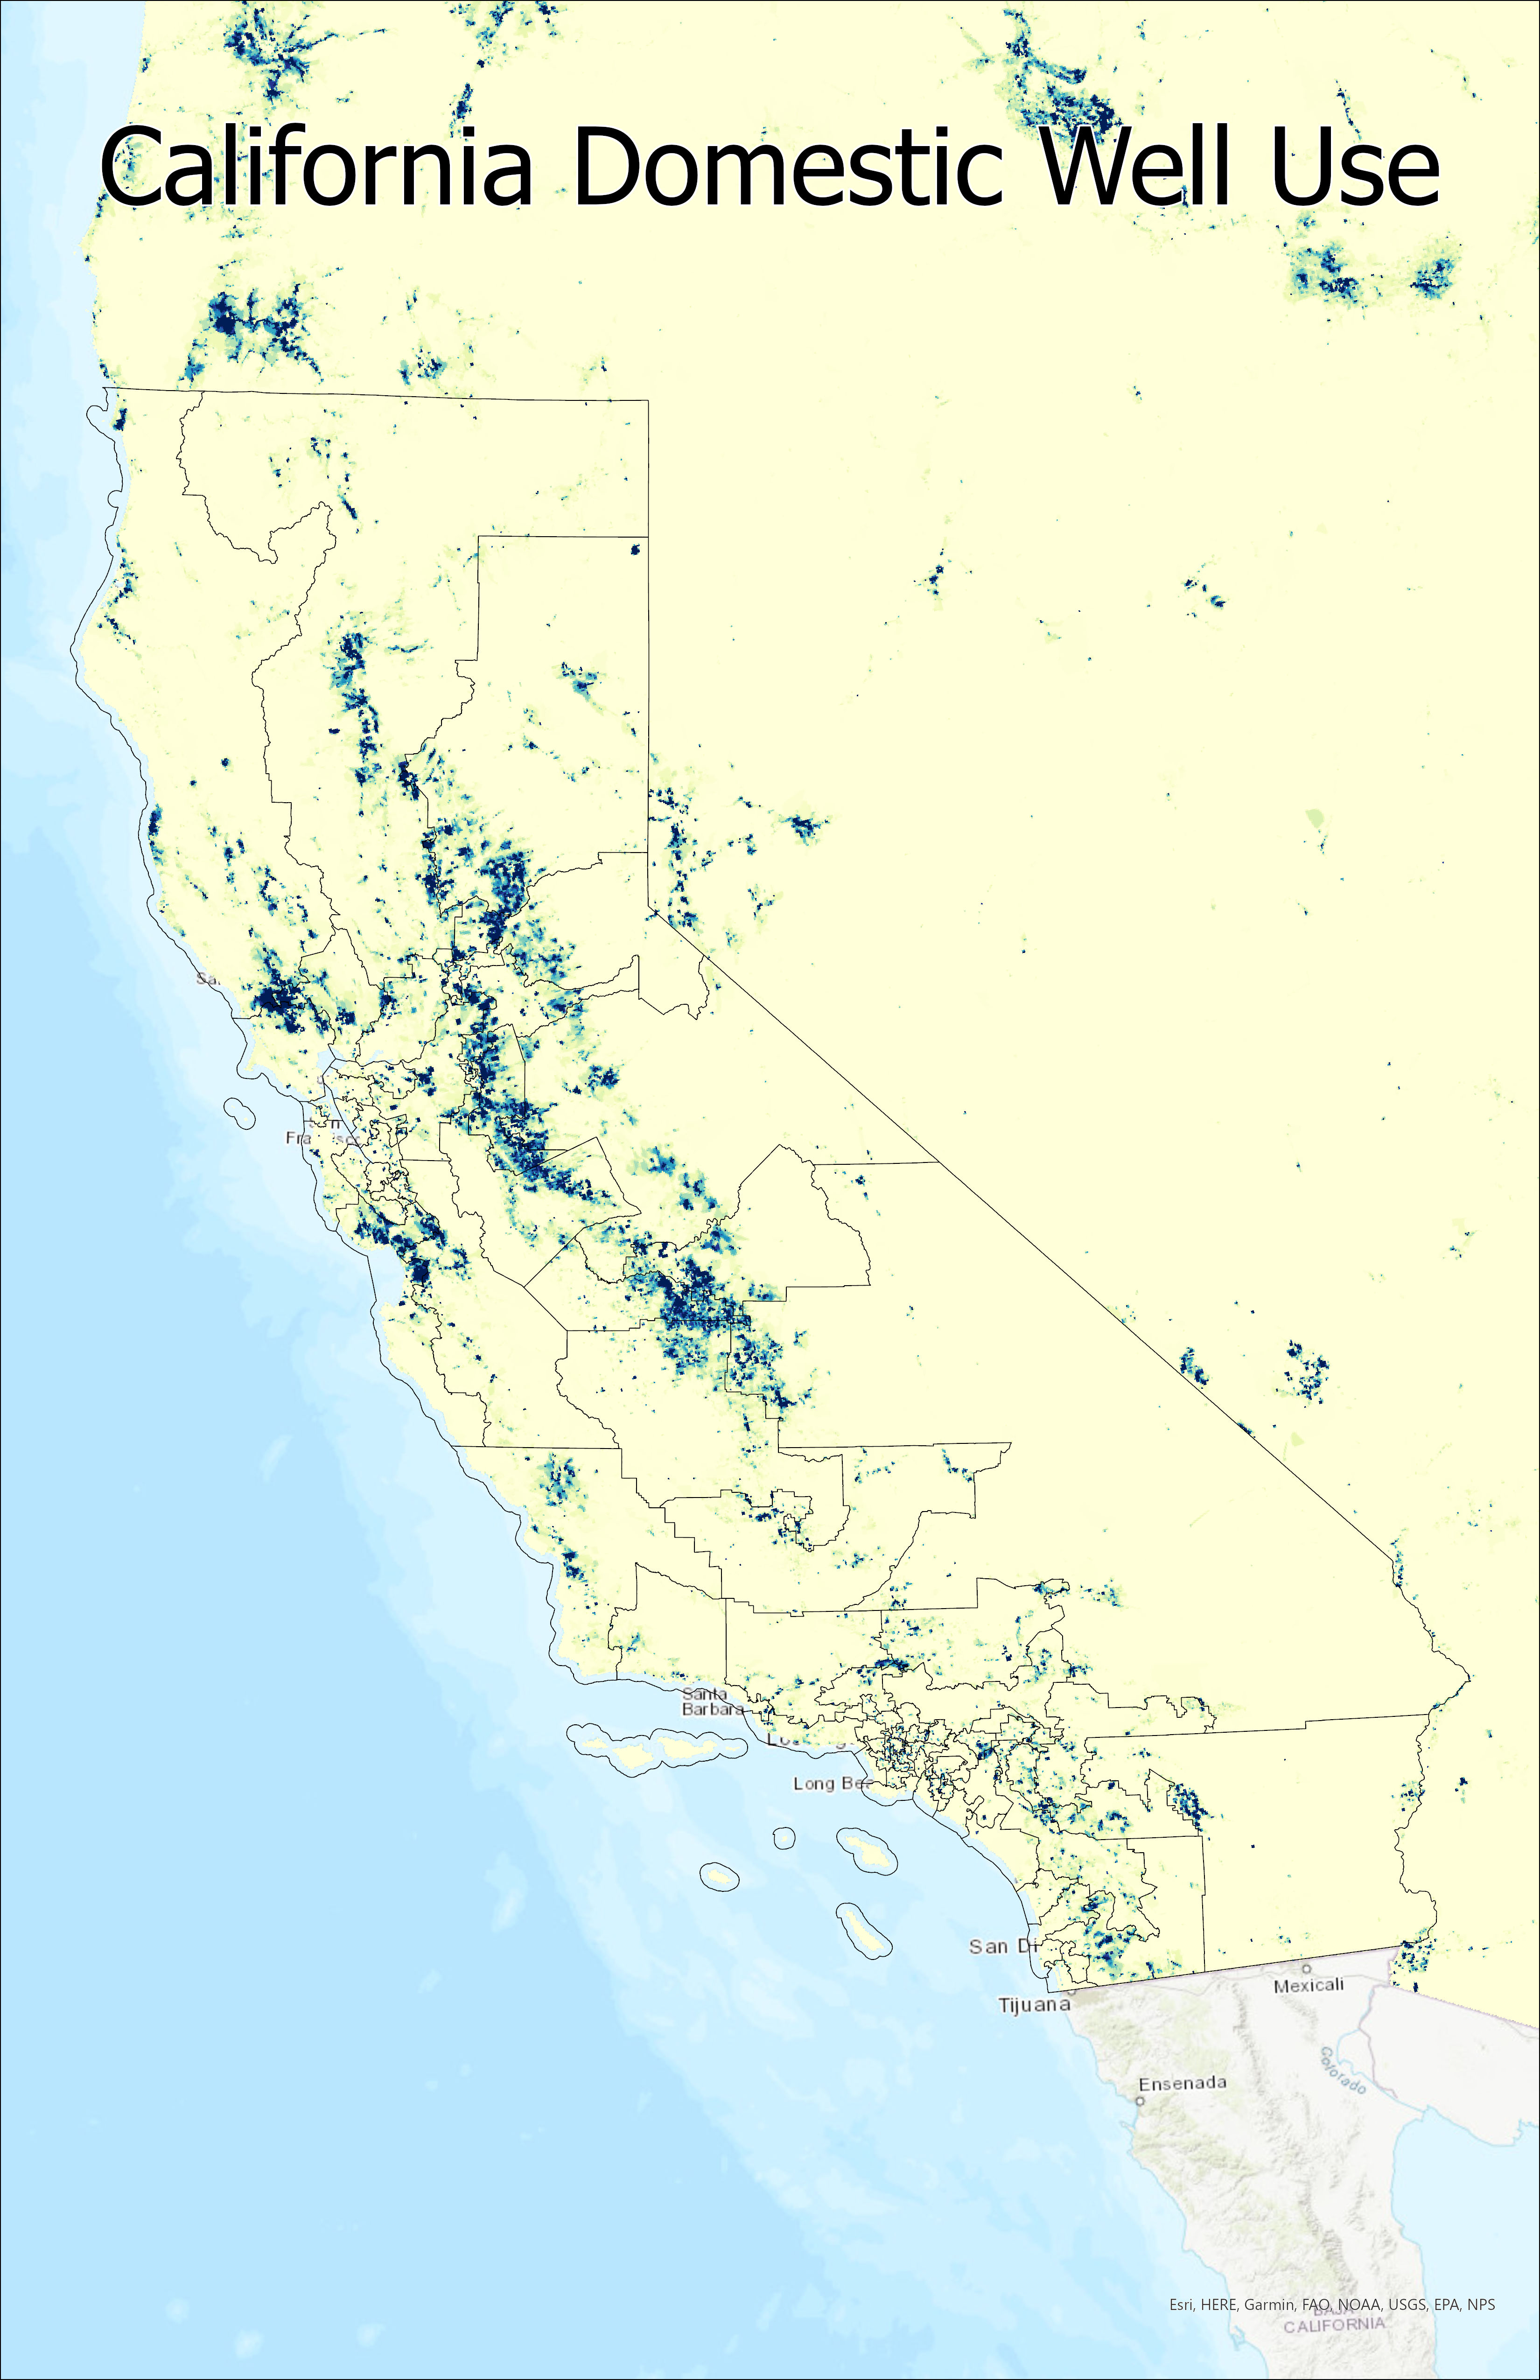
Background In looking for a good source of data for this project I found that the majority of in depth watershed data that I would be most interested in would be something that would need to be paid for. Surface water and precipitation was not too difficult to find. The search for a quality and informative data source was lengthy but in the end successful. The website earthstat.org has data on the worlds watersheds usage against annual renewed water along with other data that can be related to water usage and its effect or possible casues. The data on this site is cited to be collected in the year 2000. The usgs.gov site provides much hydrography data and was a good source for precipitation. Sciencebase.gov provided data for well locations within the United States. Well Sites are especially important to those looking to go into any study of hydrology and learning where to acquire this data could be useful for that matter. | |
 | |
|
Methods I used ArcGIS Pro after collecting my data to clip my layers to desired location. Once layers were clipped to the state of California it took some time to determine the rest of the geoprocessing that I would need to do in order to include what I found interesting in the data. One of the more important subjects I needed to determine was how data was symobolized according to Earthstat so that I could give accurate data in the legend. The data was symbolized with unique values according to a special field that EarthStat had created for their data. I then chose which pieces of data pertained to my project and clipped layers, made legends, and exported my maps to be shared. This turned given data of the entire world to a smaller more visible range of California. | |
Example Data Before Geoprocessing 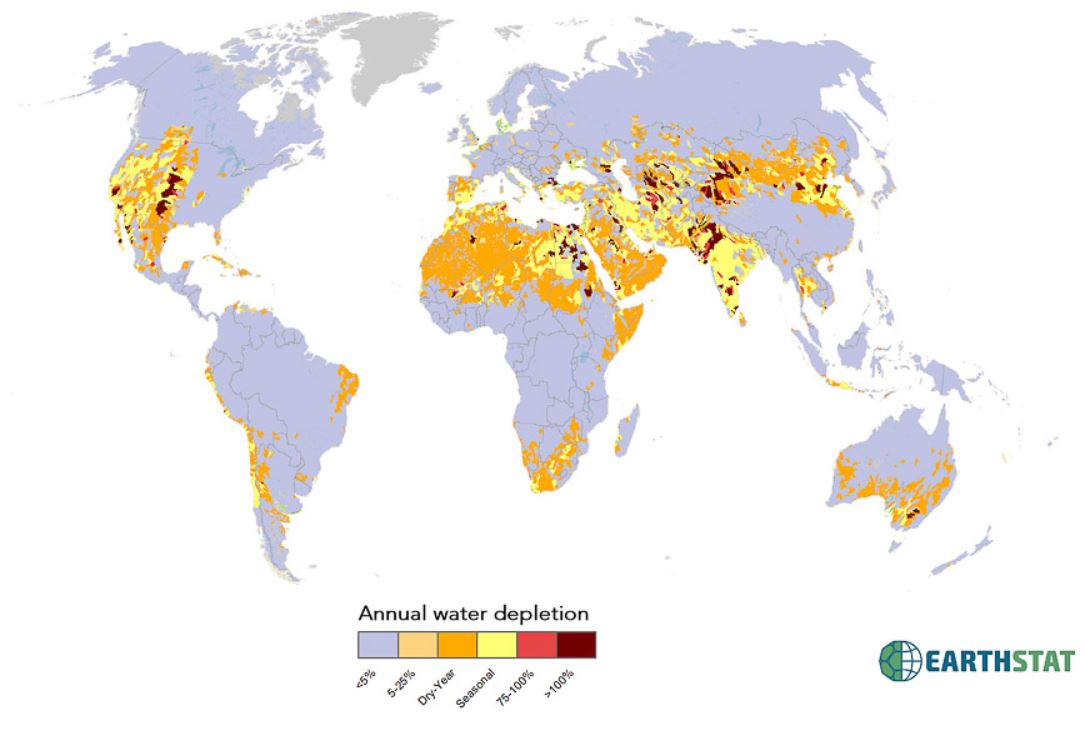 | |
|
Results My initial task was to find where my data would come from. I believe this to be the most important
work for this project as data acquisition is the course. There are many data dources for hydrology but what one is looking for can mean an extra amount
of digging, or buying data. For the purpose of this project I chose to keep the topic general but with a study area of California in something somewhat
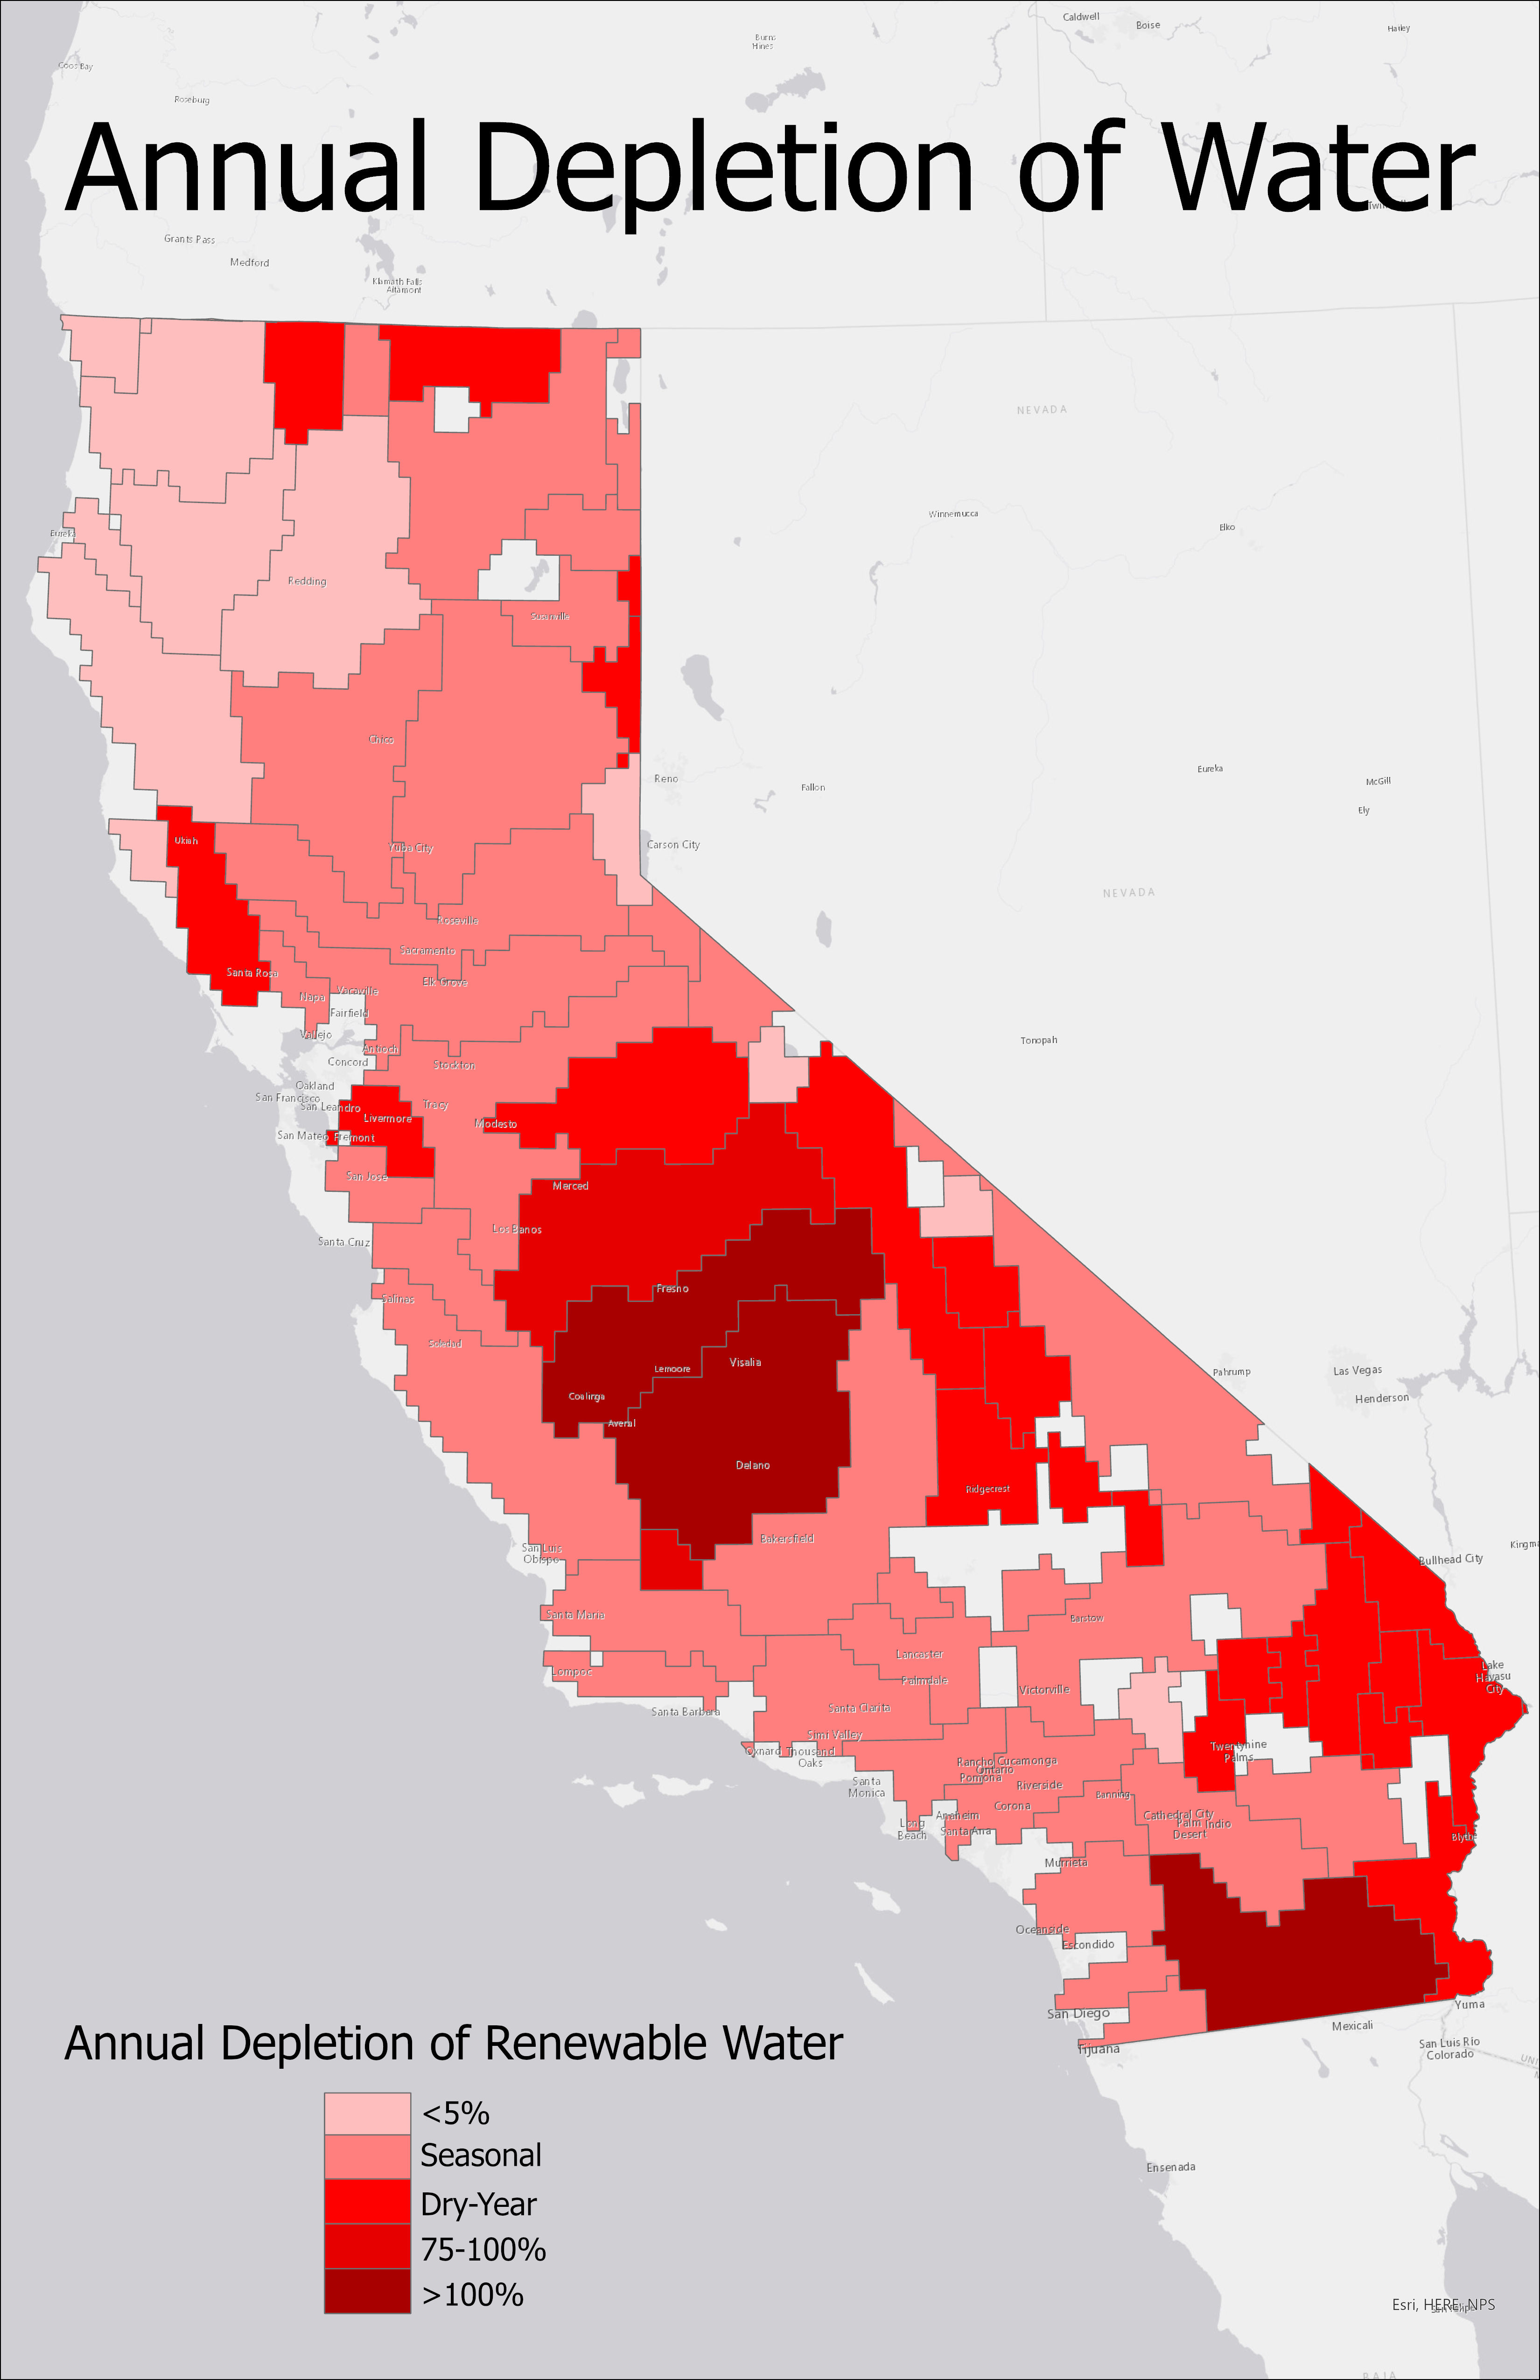
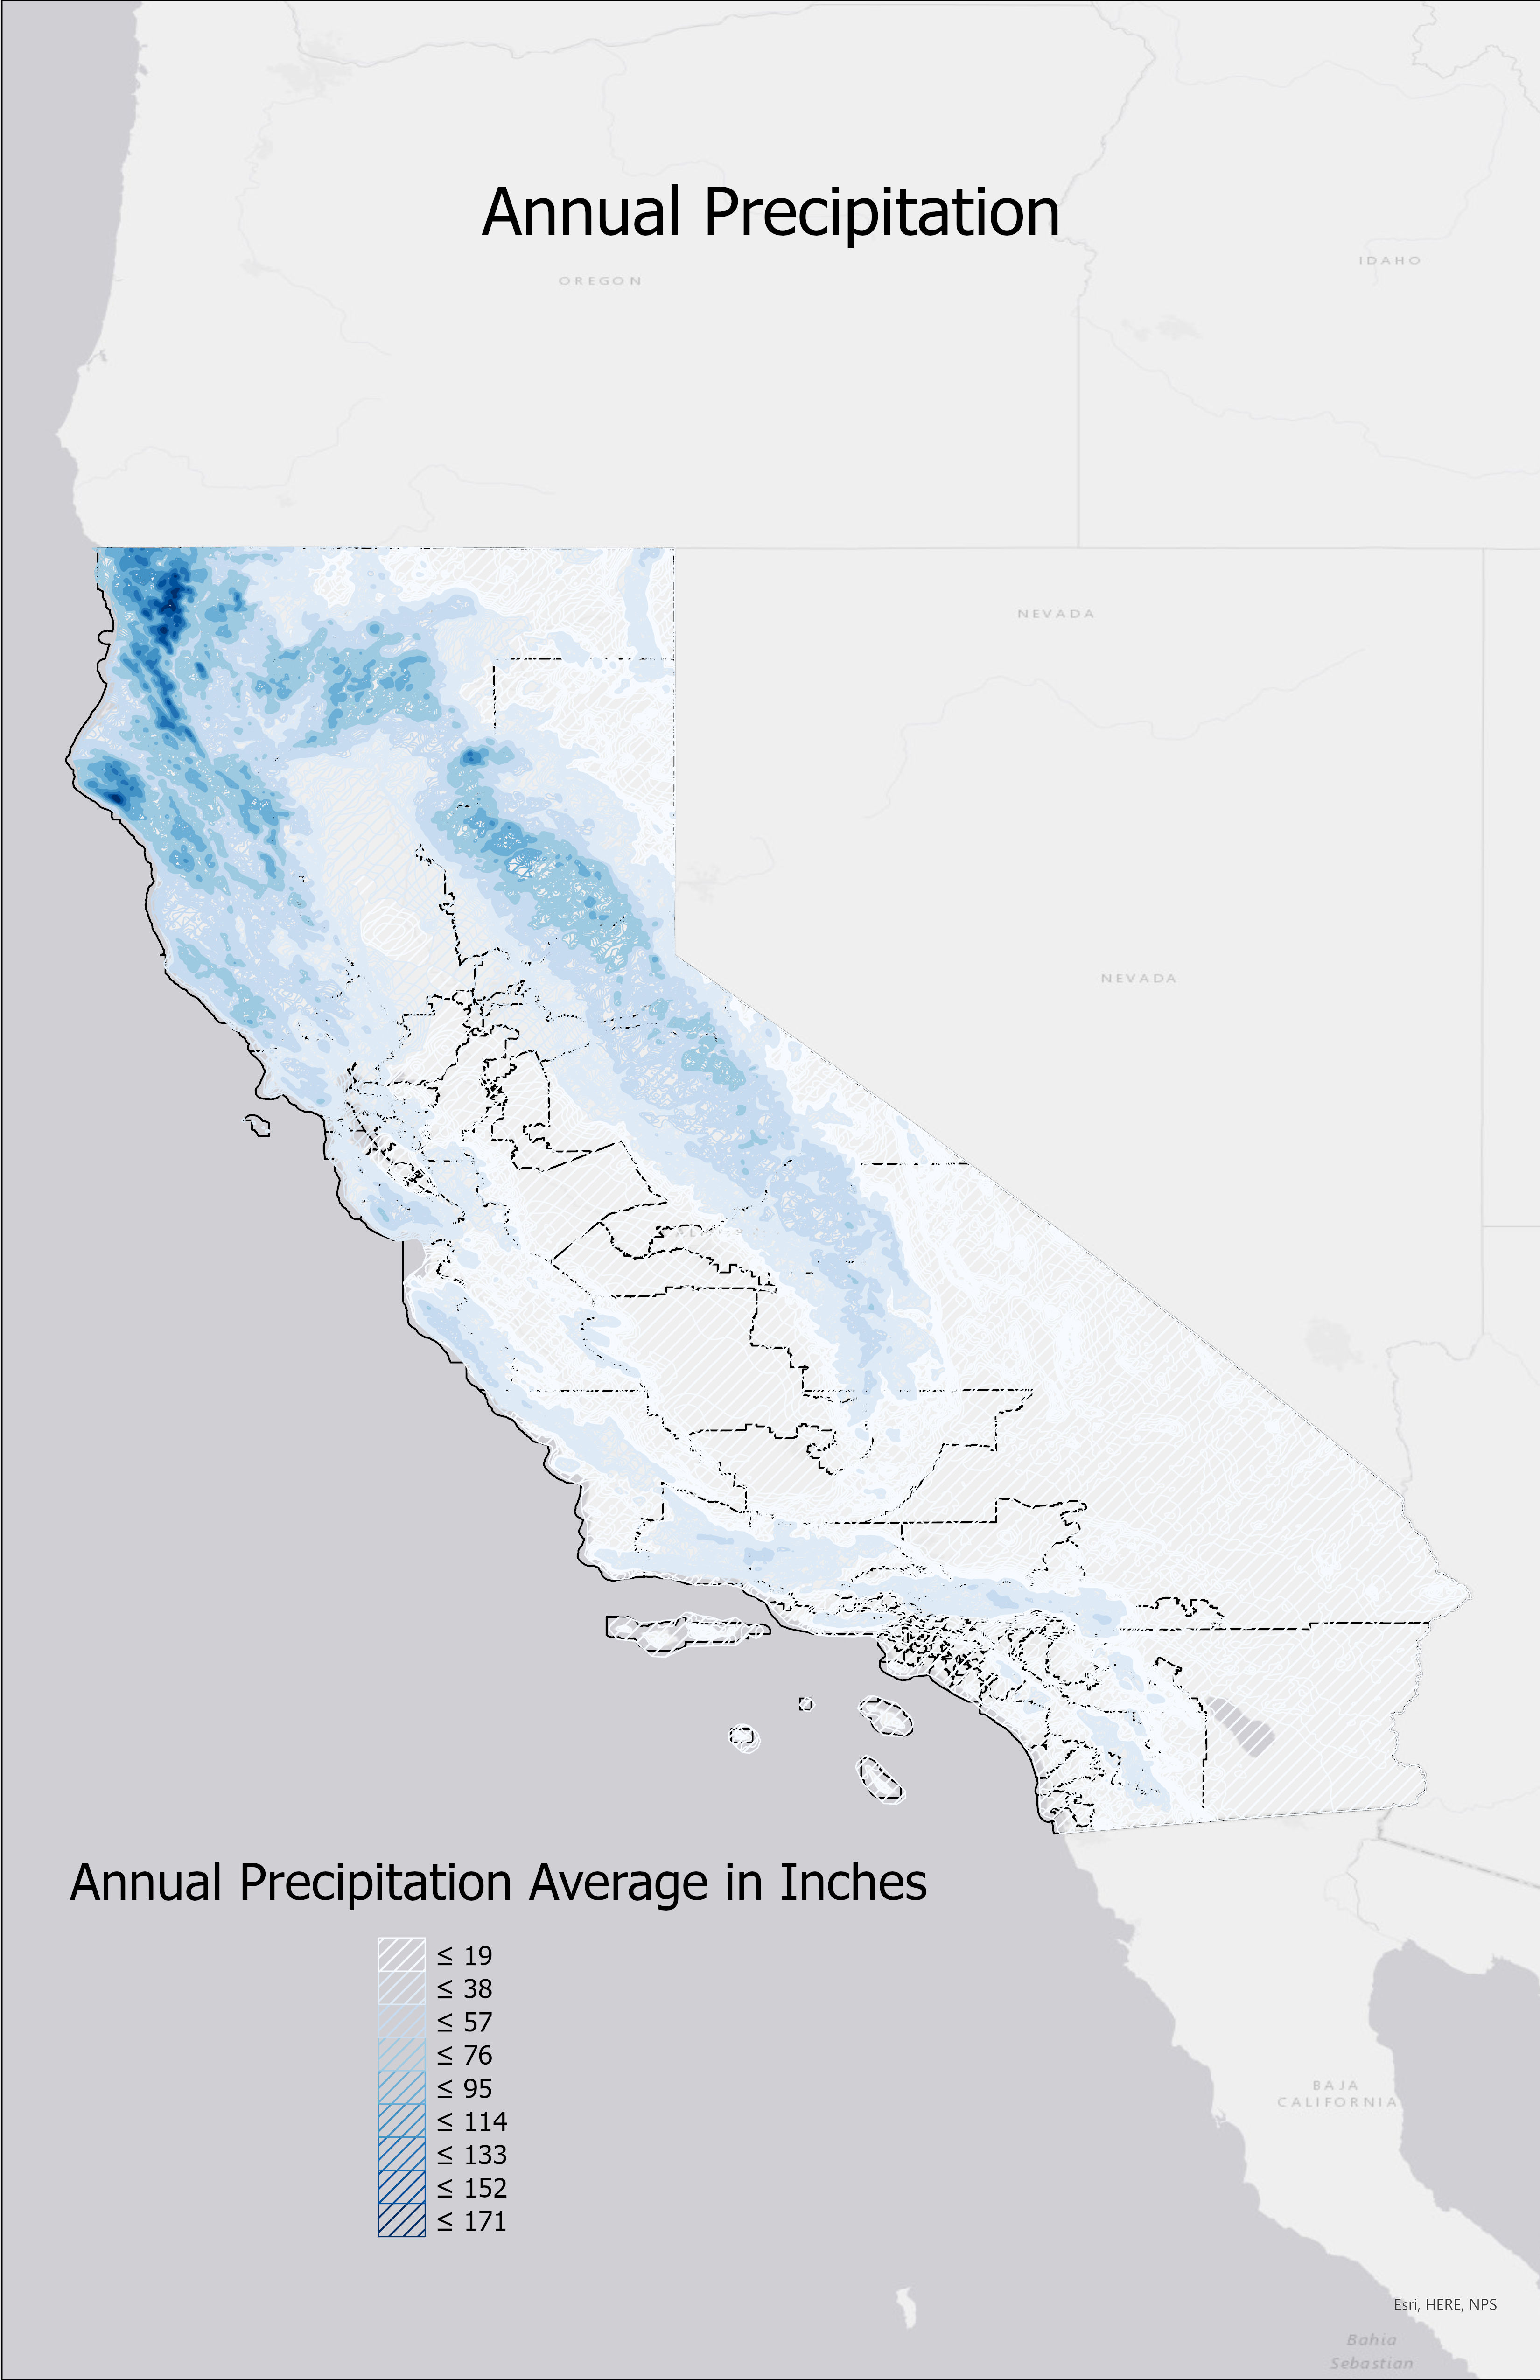
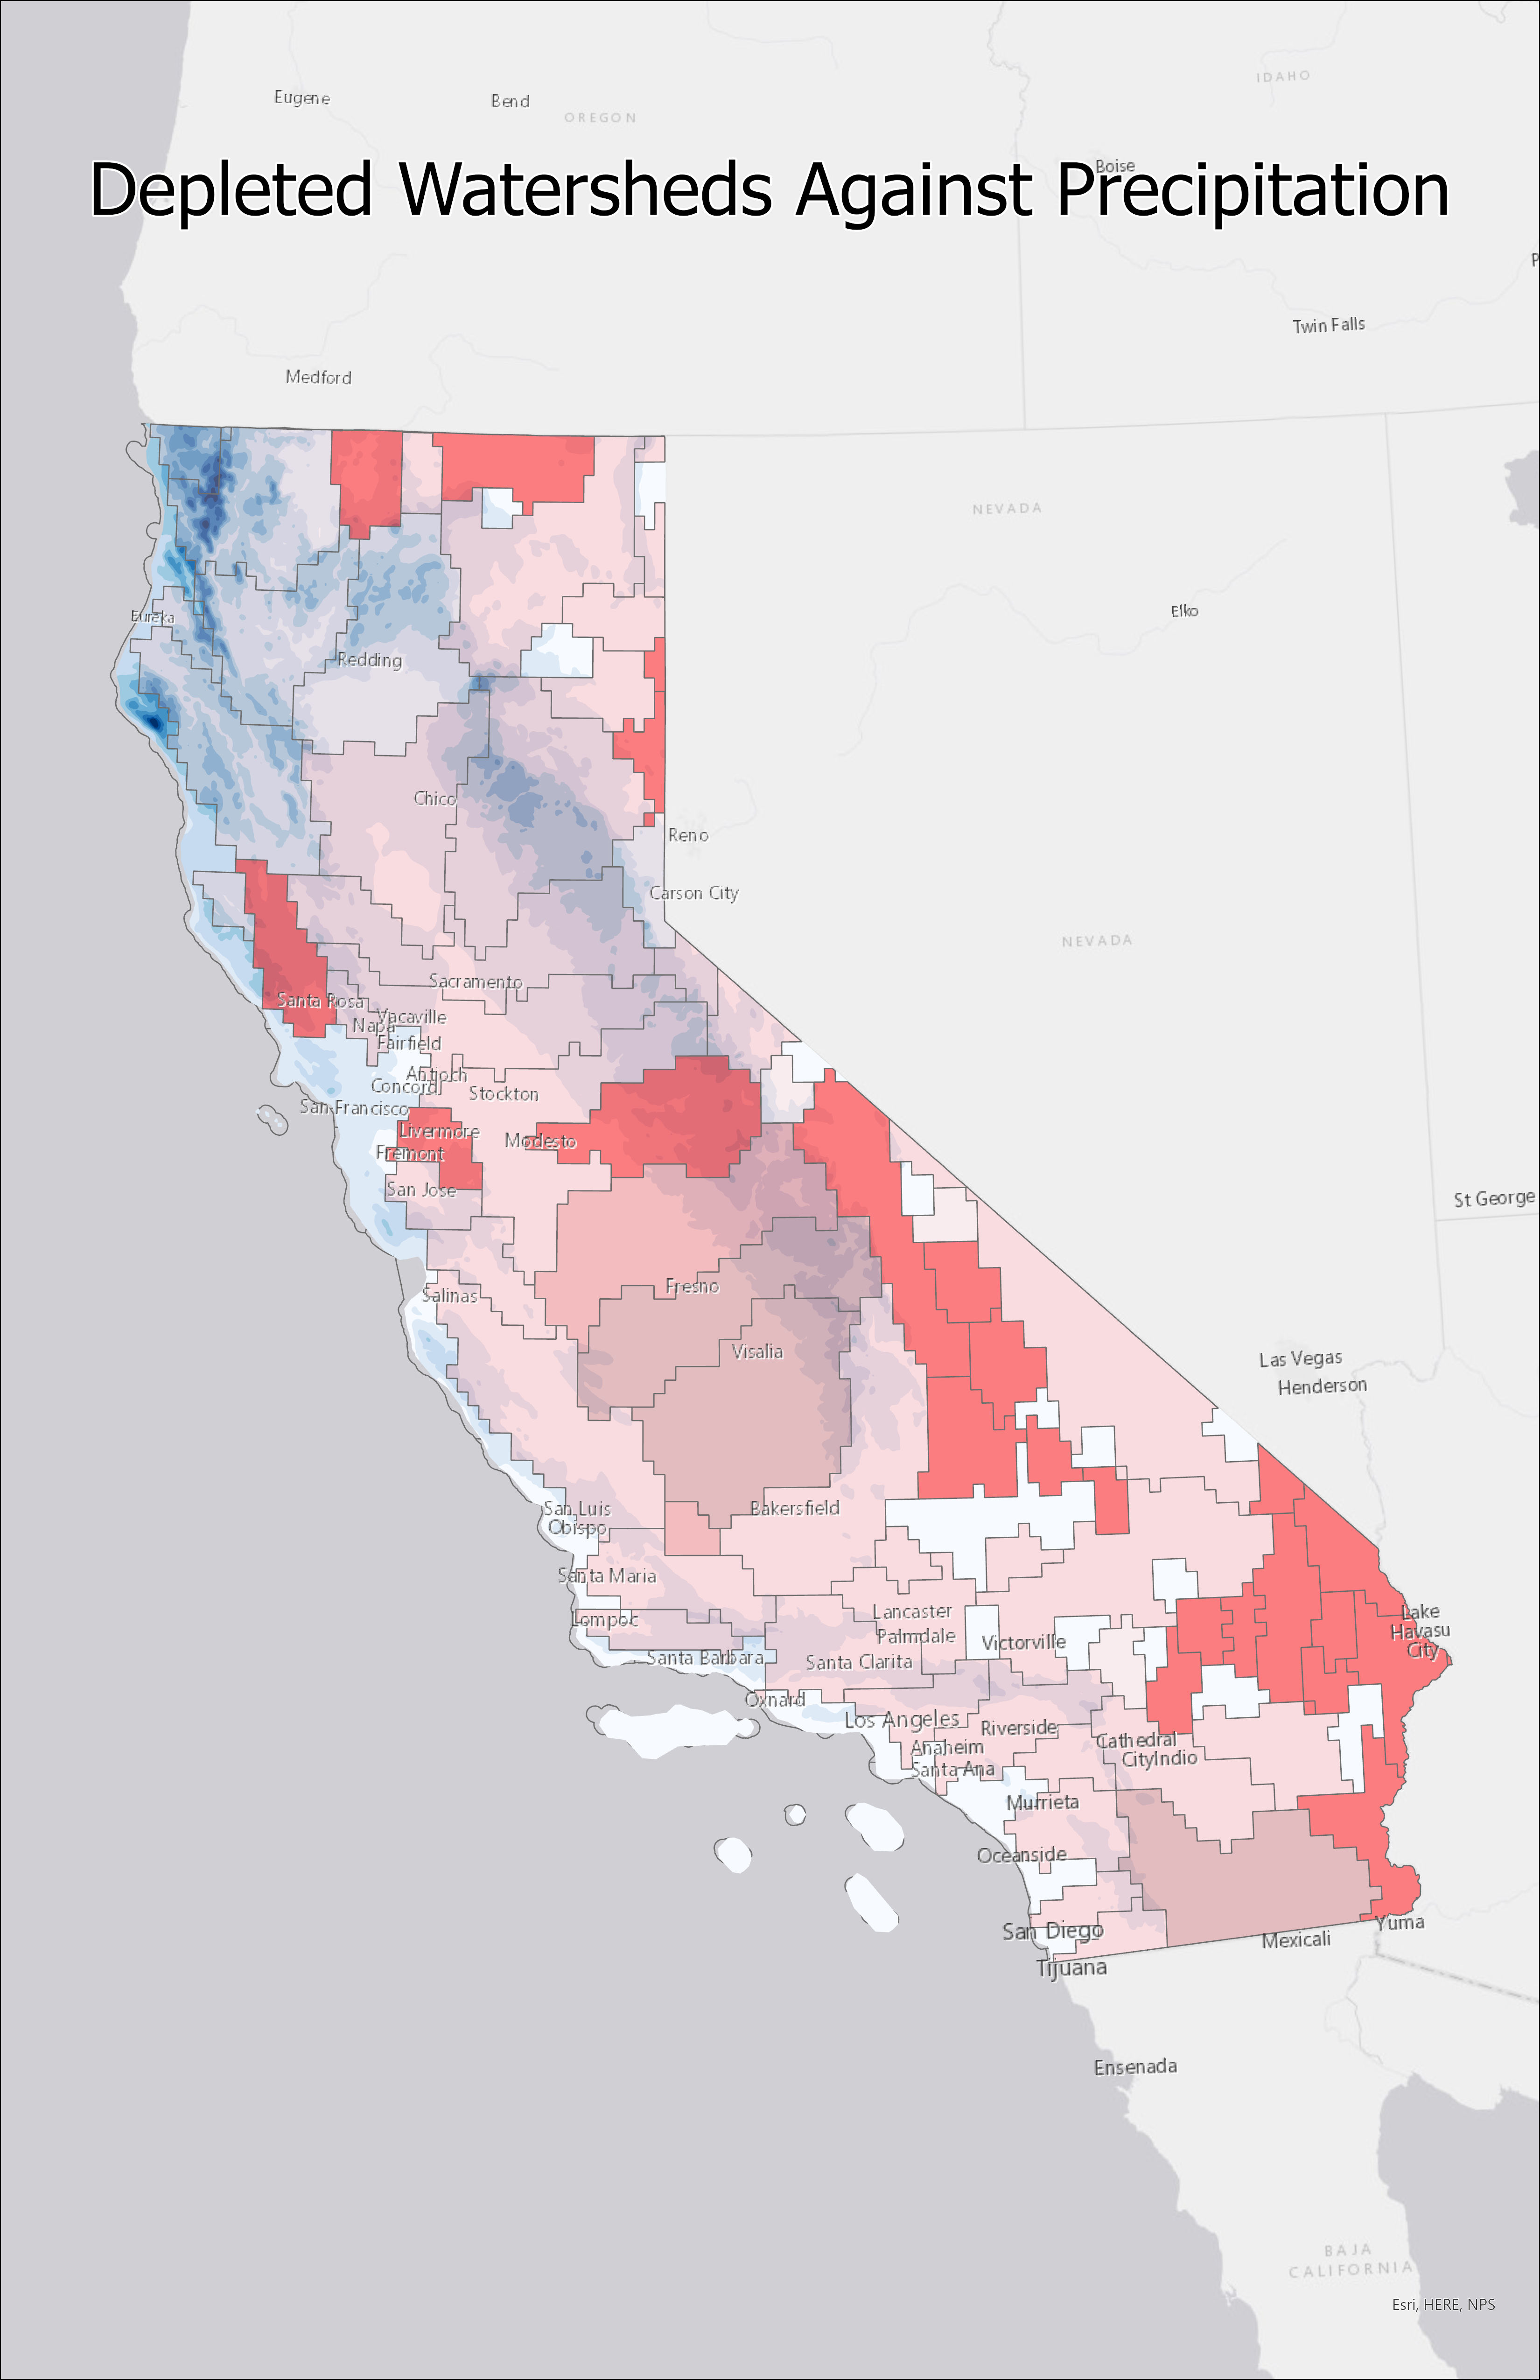
closely related. I also chose to study how watersheds in California have their renewable water removed at different percentages, where precipitation is
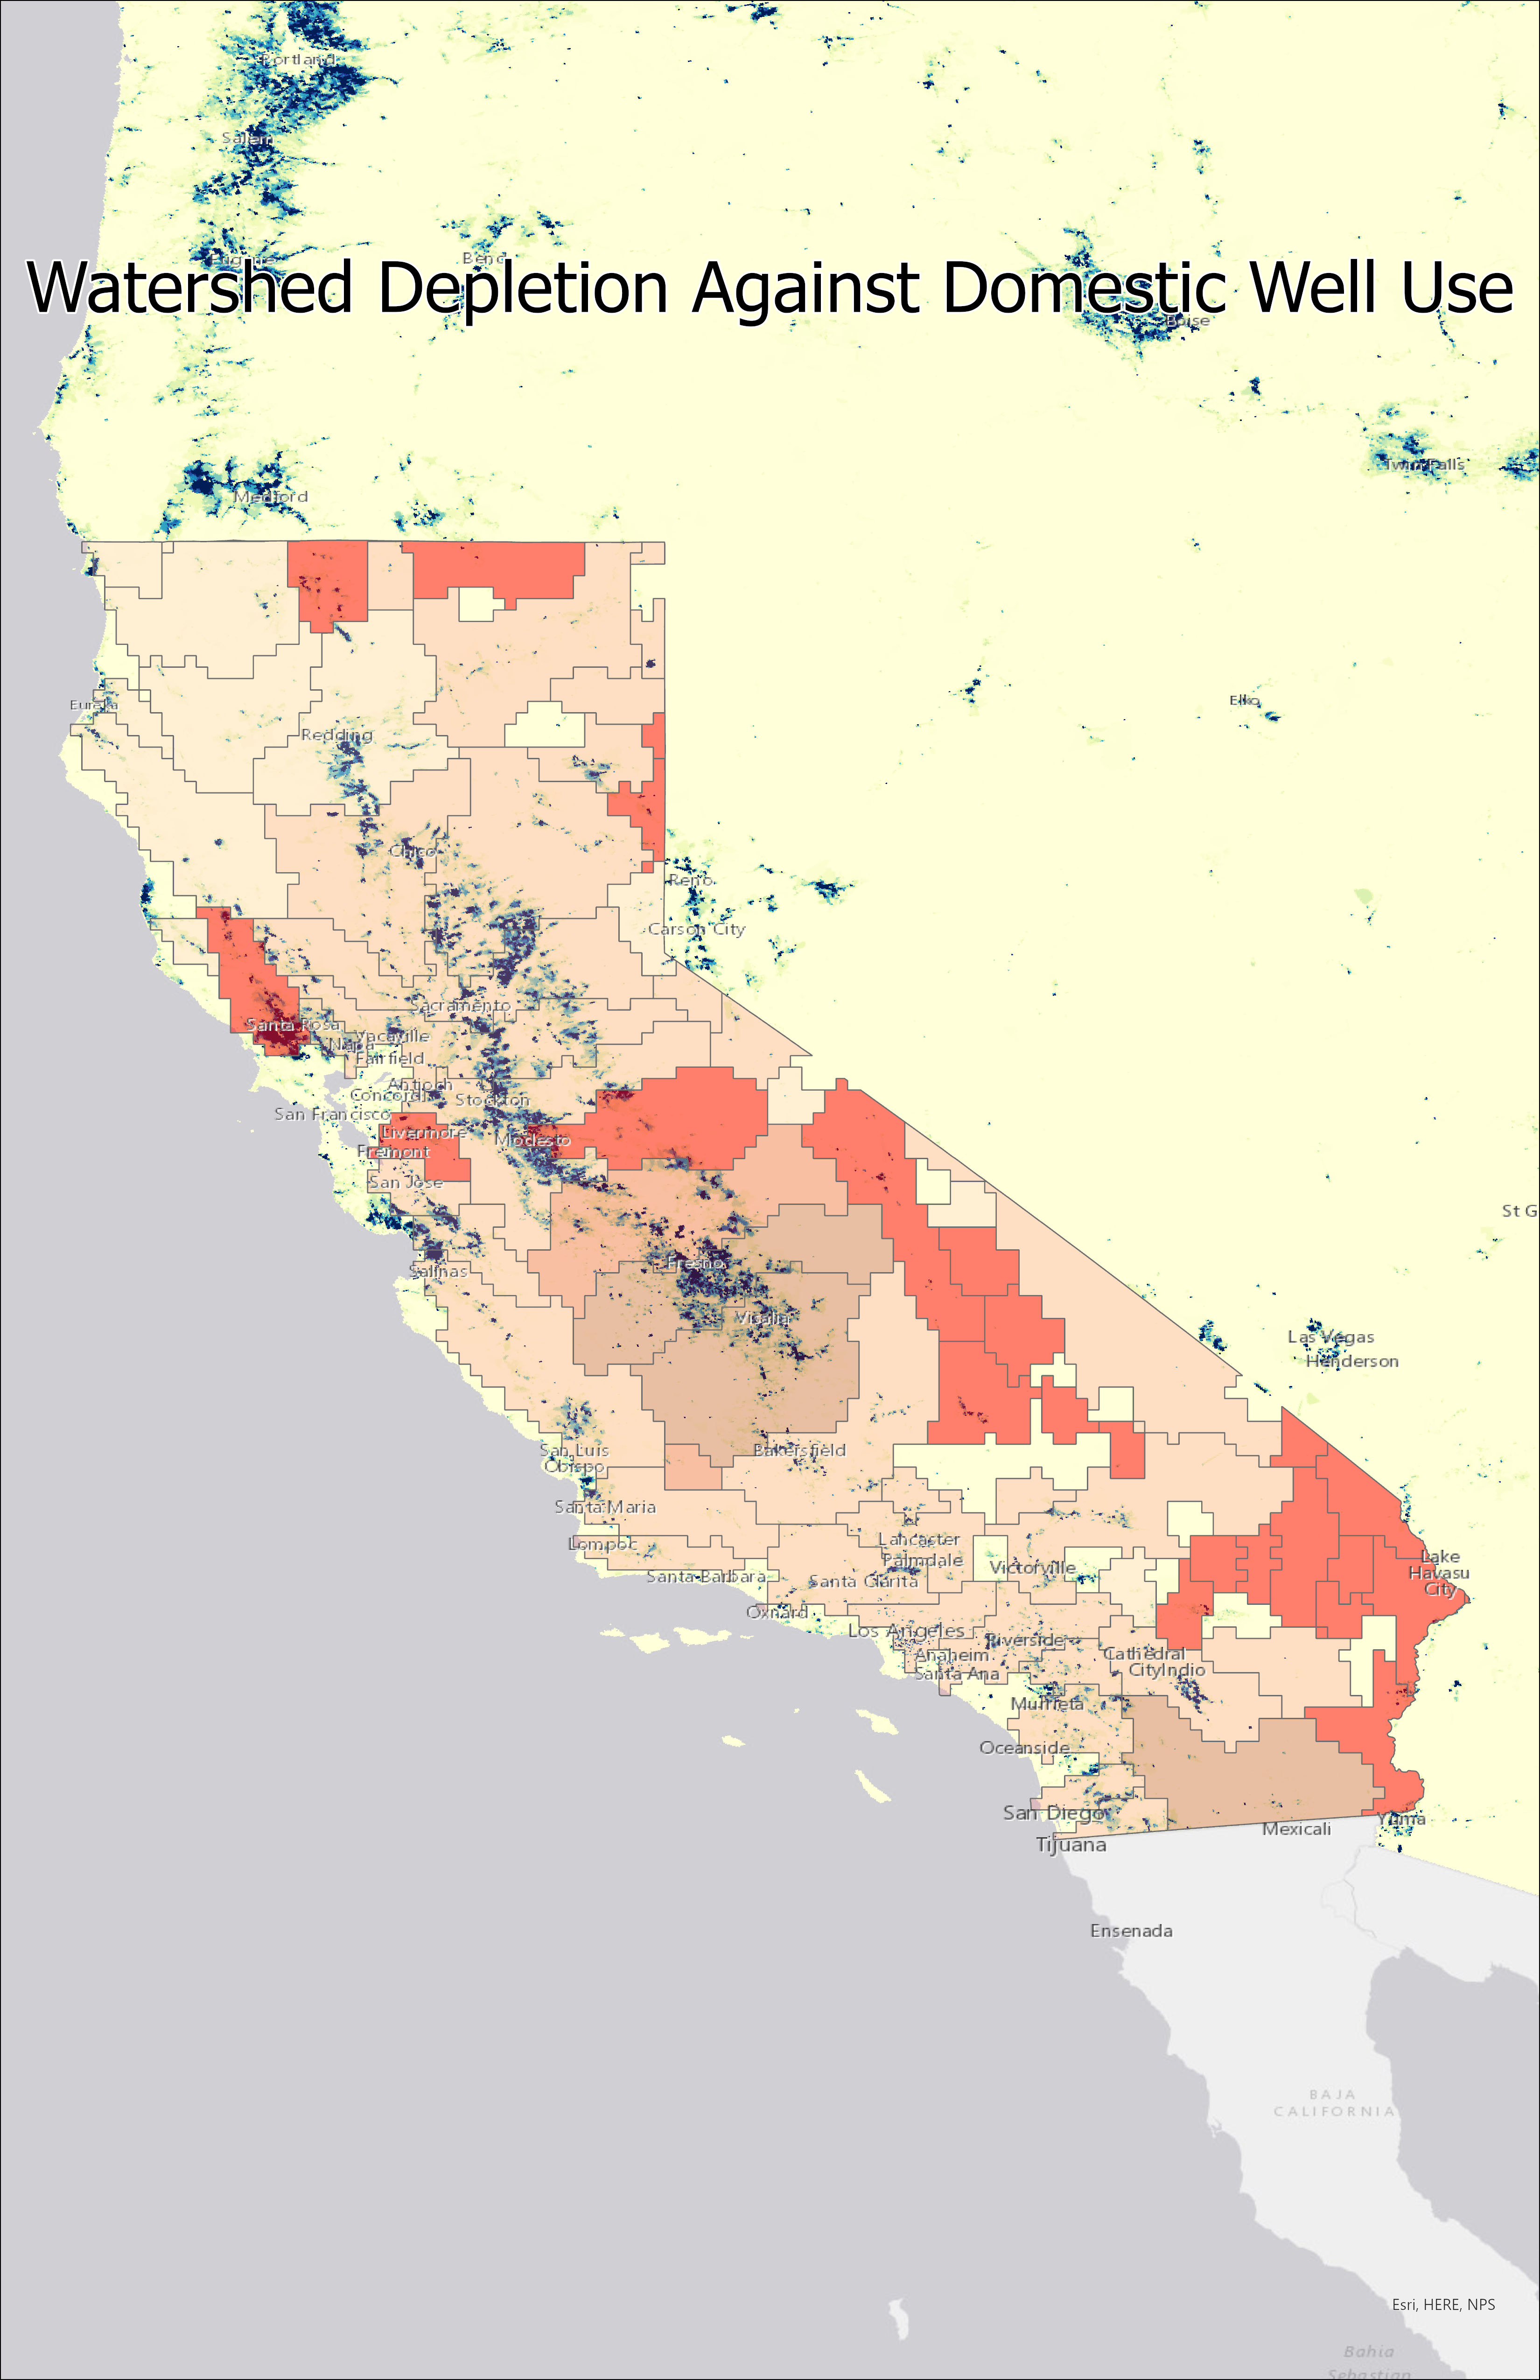
greatest and lowest, and where domestic well use is the highest. These three factors can be shown to have a relationship to one another. There are some places
within California that will just not get enough rain and are behind mountains which create deserts. These areas consistently have their watersheds overly
withdrawn. Places where there are major domestic well site usage can also see a greater percentage of watershed resources be depleted. | |
 | |
 | |
 | |
|
Analysis Once finished scanning websites for hydrology data that I could relate by applying basic geoprocessing to the data that I found
I began clipping my data to the stat of California. I chose water depletion and the other two data sets were to complement it. i imagined what would
impact watershed depletion the most. Just like a birth rate, how quickly anything is regained versus lost would effect overall growth or loss rate.
I clipped precipitation and symbolyzed it with 9 colors to give a wider range of where rain may fall, as many places are dry in California. I also
found a raster of domestic well use and laid an overlay of the state outline so that just outside of the state could still be seen as well. After exporting a map
of all three layers individually I created two more maps to lay a more transparent layer of watershed depeletion against both precipitation and well use. | |
 | |
 | |
|
Conclusions Through exploring the process of how
GIS could be applied to topics of hydrology I have learned that there are many places to pull data from and can combine them to gain insight
into relationships that hydrologic features and qualities have. Here I can see that a combination of watersheds being overused by large populations
while not being replenished can lead to problematic results for California's watersheds. Of course there are many other factors that could be considered
but having a visual representation of problem areas can tell those looking to help where to start. I believe there is a trend with the less precipitation
that can be found the more well use there will be, and the higher percentage of watershed depletion there will be, although not in every location. | |
|
References Brauman, KA, BD Richter, S Postel, M Malby, M Flörke. (2016) “Water Depletion: An improved metric for incorporating seasonal and dry-year water scarcity into water risk assessments.” Elementa: Science of the Anthropocene. Doi: http://doi.org/10.12952/journal.elementa.000083 Johnson, T.D., Belitz, K., Lombard, M.A., 2019, Domestic well locations and populations served in the contiguous U.S. for 2000 and 2010: Science of the Total Environment, v. 687, p. 1261-1273. https://doi.org/10.1016/j.scitotenv.2019.06.036. USGS Current Conditions for California 2010 , https://waterdata.usgs.gov/ca/nwis/current? group_key=basin_cd&PARAmeter_cd=STATION_NM,DATETIME,00045 | |