California Rising Temperature | |
|
Author
Ted Dang American River College Geography 350: Data Acquisition in GIS; Fall 2020 | |
|
Abstract Daily temperature data collected at land based weather stations over 30 years are used to answer the question whether California is experiencing rising temperature. Point temperature data are processed to produce temperature surfaces so summary temperature statistics can be collected. The results show many parts of California are experiencing rising temperature, some as high as 4.3° Fahrenheit. However, there are also a few parts of the state experiencing no change, or even a modest decrease, in temperature. | |
|
Introduction California's forests are drier and recent wildfires have been larger and more frequent. Climate scientists often attribute the change to rising temperature. To examine the new phenomenom objectively, 30 years of daily temperature data collected at land based weather stations are analyzed to assess this claim. | |
|
Background With the recent increase in severity and frequency of wildfires, it is natural to expect an explanation. Climate change is often being singled out as the main culprit. Being very subtle and comes ever so slowly, climate change is hard for human to detect and explain. Broadly speaking, rising temperature brings about long periods of drought which cause trees to die and become fuel to feed wildfires. More specifically, climate experts attribute California’s unprecedented wildfires to rising average summer temperature of 2.5 degrees Fahrenheit (William et al., 2019). I find this claim to be very interesting as the current temperature data collection method does not lend itself well to an easy derivation of averages. In this paper, I will perform a quantitative analysis of temperature data to test this claim. Relying on daily observation data collected by the extensive network of automated weather stations across the western United States, I extract and process daily maximum and minimum temperature for a 30-year period from 1990 to 2019. The cleaned data will be interpolated to produce a spatially and temporally complete gridded dataset of surface temperature variables. As gridded datasets, averages and other summary statistics, for California as an area can then be derived. A note on using interpolation to create temperature surface, California geography is made of complex terrains and coastlines which are features known to challenge any methodologies for generating high resolution gridded temperature dataset. In a study to assess high-resolution gridded temperature datasets over California, Walton and Hall (2018) examines six station-based, one interpolated reanalysis, and one dynamically downscaled reanalysis datasets. Assessment is carried out in two ways: at the weather station against the historical data collected and away from the station using physical principles. The results show climatology values line up well with historical weather station data. However, away from the stations, spread in climatology values can exceed 6 degrees Celcius. The authors suspect this bias is likely to be an effect of proximity to the coast and complex terrain. How each dataset homogenizes or handles missing data may also add to the bias which can be seen via unphysical trends. Overall, the authors find that selection of high-resolution gridded datasets can be a major source of uncertainty. They suggest that researchers to consider the dataset that is best suited for their application as not all are the same. | |
|
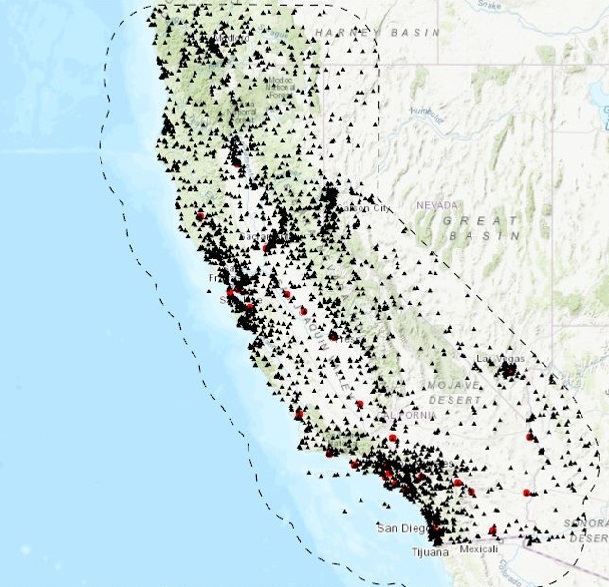
Methods As only change in maximum temperature is of interest to this study, this application needs a high resolution maximum temperature gridded dataset of its own. This work involves accessing the dry bulb temperature available via NOAA’s Global Historical climatology Network (GHCN) dataset (Menne et al., 2012). Data from this source are well documented and contain historical data from stations established as long as 175 years ago. Spatial data are well organized and maintained separately by weather station. | |
| Each weather station is identified by a unique ID along
with accurate coordinates and elevation. Each dot on this map represents one station.
There are 3,466 land-based weather station found in California and 75 miles into three adjacent states.
As the official archive dataset, metadata for this dataset is very thorough, detailed, and well documented. My concerns are in the data quality. According to Durre et al.(2010), this daily GHCN dataset has been processed through a rigorous, carefully evaluated automated 19-step quality assurance detection procedure. However, I still find outlier values, i.e. values outside of known records for California (above 130°F or below -45°F). I am also concerned with the missing observations. To process this dataset for analysis, I removed all observations with values outside of California’s known temperature records. To backfill these removed and other missing values, I use a 5-day centered moving average. It is computed by averaging a total of 5 consecutive maximum temperature values of the series (the current period value in addition to the two immediately preceding values and two values immediately following the current value). |
|
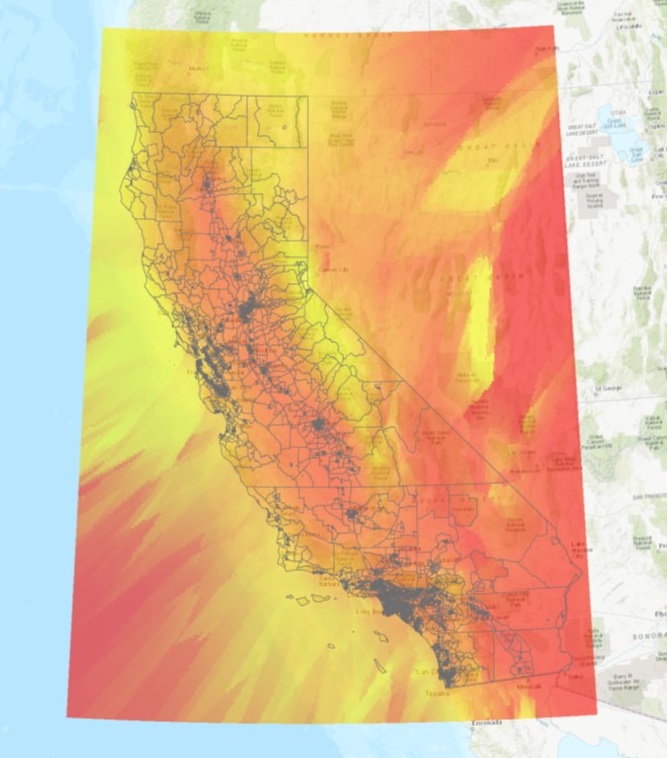 |
The next step is to interpolate point temperature data
to produce temperature surfaces. Picture on the left is a raster surface of maximum temperature
for December 31, 2019.
Many approaches can be used to produce high-resolution temperature datasets. Within each approach, different algorithms would result in different fitting or smoothing of temperature curves. Inclusion of myriad of other non-weather factors such as elevation, on-shore marine layer, proximity to other stations, etc. also produce different results. Due to the limited scope of this study, non-weather factors are not included in the interpolation criteria. Spherical semi-variogram model of the ordinary kriging method is used to generate an estimated temperature surface from maximum daily temperature captured by 12 nearby weather stations. Use of this geostatistical tool effectively takes into consideration the spatial behavior represented by the temperature values from nearby weather stations before selecting the best estimation method to generate temperature surface. |
|
With one temperature surface being generated for each day, analyzing 30 years of surfaces is
a daunting task. To make it more manageable, I limit the annual dataset to four months of data
collected between June 1st and September 30th of each year. Since the main interest is in the maximum
temperature, June through September are the summer months which experience the warmest
temperature of the year. The objective is to compute the mean value of maximum temperature
for each year so a temporal comparison can be made from one year to another.
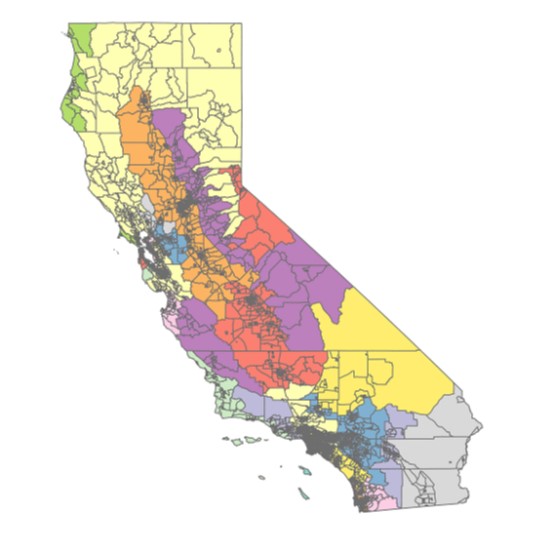
California geography is diverse resulting in extreme temperatures on both ends. Taking the average of annual temperature, spatially speaking, is to ignore all regional differences. To capture regional variations, I employ the use of multivariate clustering geoprocessing tool. This procedure analyzes temperature surface data for regional differences and finds 20 natural contiguous clusters based solely on maximum temperature values. The picture on the right is a representation of the 20 clusters. |
|
|
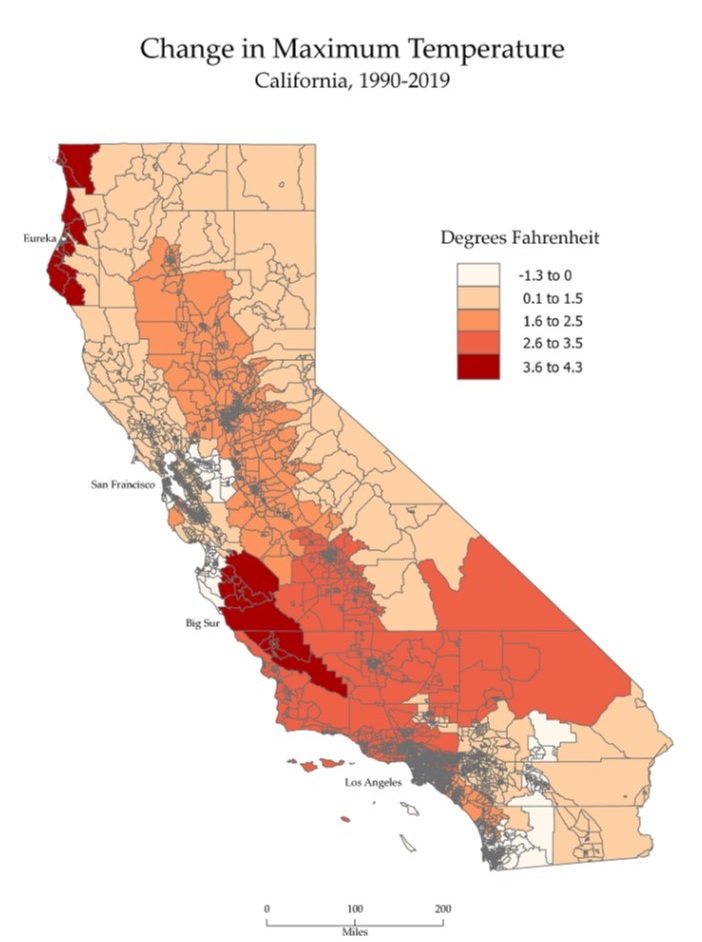
Results The choropleth thematic map below displays the change in annual maximum temperatures for California between 1990 and 2019. | |
 |
|
|
Analysis As can be seen in the thematic map, California as a state may have reached the 2.5 degrees Fahrenheit temperature rise. However, northern California is experiencing a slower rise than southern part of the state. Two areas (near Eureka and Big Sur) are of particular concern. The map indicates rise in maximum temperature in those two areas exceeding four degrees Fahrenheit. A re-examination of the source data and additional analysis should be conducted to confirm this finding. | |
|
Conclusions Analysis results from this simple high-resolution gridded maximum temperature dataset are in check with claims made by climate scientists. This is promising and paves the way for investment of additional effort. With the inclusion of other non-temperature variables such as elevation, wind speed, promimity to coastal water, etc., the next iteration of this dataset would be of more value to research community. | |
|
References
Durre I., M. J. B.E. Gleason, T. G. Houston, and R. S. Vose, 2010:
Comprehensive automated quality assurance of daily surface observations.
Journal of Applied Meteorology and Climatology, 49, 1615-1633.
Menne, M.J., I. Durre, R.S. Vose, B.E. Gleason, and T.G. Houston, 2012: An overview of the Global Historical Climatology Network-Daily Database. Journal of Atmospheric and Oceanic Technology, 29, 897-910. Walton, D., and Hall, A., 2018: "An assessment of high-resolution gridded temperature datasets over California." Journal of Climate, 31.10 3789-3810. Williams, A. P., Abatzoglou, J. T., Gershunov, A., Guzman-Morales, J., Bishop, D. A., Balch, J. K., & Lettenmaier, D. P., 2019. Observed impacts of anthropogenic climate change on wildfire in California. Earth's Future, 7(8), 892-910. | |