Title
Canopy Height and Canopy Density Analysis for the Last Chance Area in the Tahoe National Forest
Author Information
Lennin Escobar
American River College, Data Acquisition in GIS; Fall 2020
(831) 332-7542, w1776890@apps.losrios.edu
Abstract
This is the summary of the entire paper. All the following sections should be represented by a single sentence or two, with the exception of background and references. Write this last.
Introduction
In this short article, I will present results of canopy height and canopy density models using 2018 Northern California Wildfire Lidar QL2 data that were released and published by the USGS in 2019. The analysis was performed over the Last Chance study site located in the Tahoe National Forest. The use of the results obtained from
this project can be utilized for other types of analyses such as forest inventory, canopy structure mapping, and endangered species habitat prediction. These LiDAR datasets are processed Classified LAS 1.4 files, formatted to 43332 individual 1000 m x 1000 m tiles, 3D breaklines, and hydro-flattened digital elevation models (DEMs)
(InPort).
LiDAR datasets were used as input for two specific canopy height and canopy density workflows. All data processing and analysis were done using ArcGIS Pro 2.6.
Background
Scientists and Foresters use Light Detection and Ranging (LiDAR) data to study the forest structure, forest canopy, and terrain. LiDAR is an active remote sensing technique
that collects data by using a laser scanning instrument over a landscape in back-and-forth flight paths, producing this way, forest canopy measurements with complete coverage
over hundreds of thousands of acres (Sean et al. 2018). Because LiDAR technology uniquely combines high resolution with large spatial extents, it has proven
to be useful for measuring and modeling forests at many scales (Hyyppð et al. 2008; Kane et al. 2010a; Kane et al. 2010b).
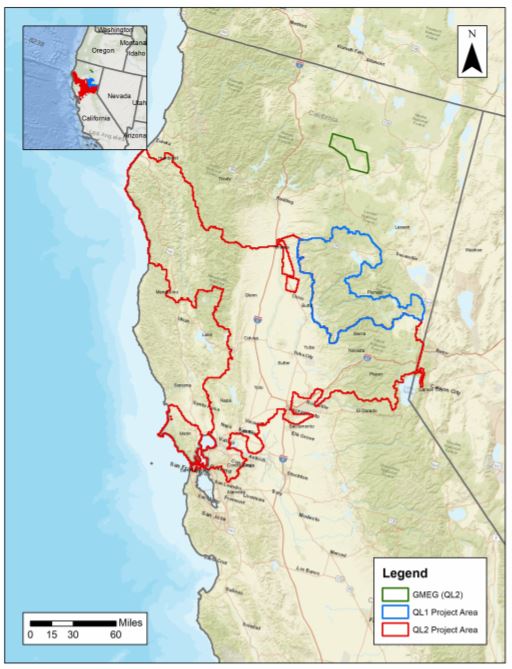
2018 Northern California Wildfire Lidar QL2 project covers approximately 16,731 square miles which include the Northern Coast Ranges of Humboldt and Mendocino Counties, the south
and central regions of the Sacramento Valley, northern regions of the Bay Area, and the Sierra Nevadas in the vicinity of Lake Tahoe
(USGS), (Figure1).
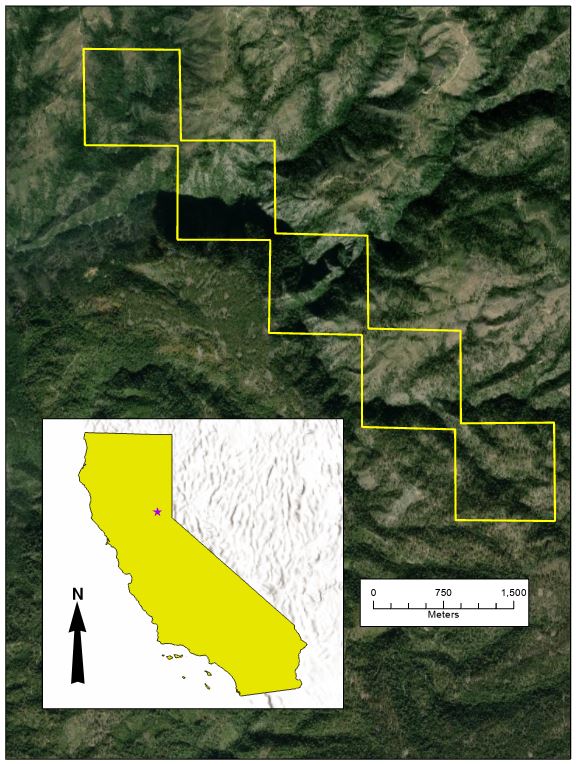
For this project, I selected the Last Chance study site, (39¯07'N, 120¯35'W), which is located in the Tahoe National Forest and has an area of approximately 5 km2 (Figure2).
The elevation and sloe normally range from 228 m to 2189 m and from 0¯ to near 90¯ respectively. Almost 90% of the study area is covered by vegetation, with an average canopy cover
of 67%. More specifically, the study area is covered by mixed conifer forests such as white fir (Abies concolor), ponderosa pine (Pinus ponderosa), incense-cedar (Calocedrus decurrens),
sugar pine (Pinus lambertiana), and Douglas-fir (Pseudotsuga menziesii) (Su et al., 2016).
,
Figure1 - 2018 Northern California Wildfire Lidar QL2 project
Figure2 - The Last Chance Study Site
Methods
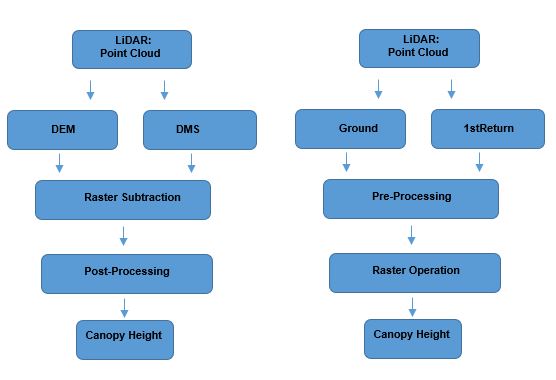
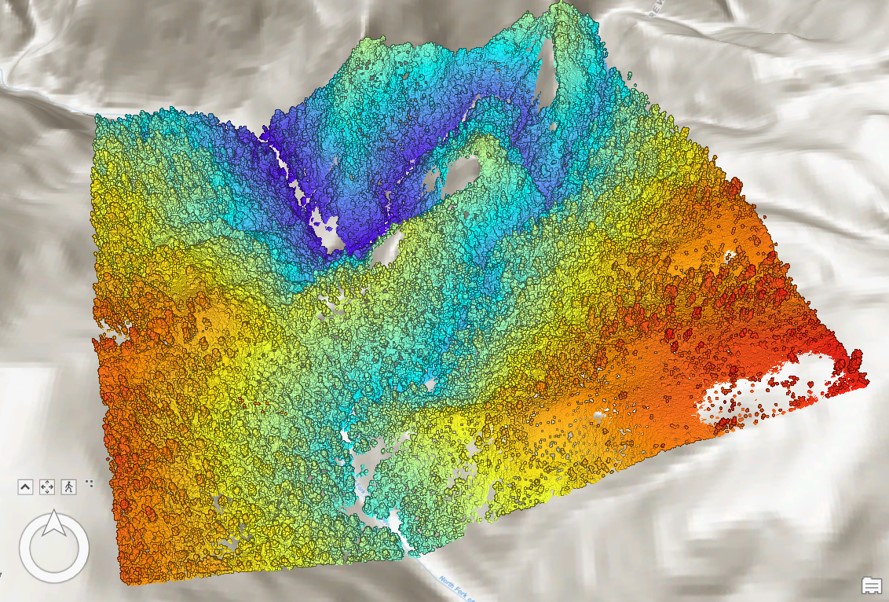
I set up two workflows (Figure3) to specifically calculate the canopy height and canopy density models which use as input data 5 LiDAR tiles with an area of 1000m by 1000m each
obtained from the 2018 Northern California Wildfire Lidar QL2 project (Figure4).
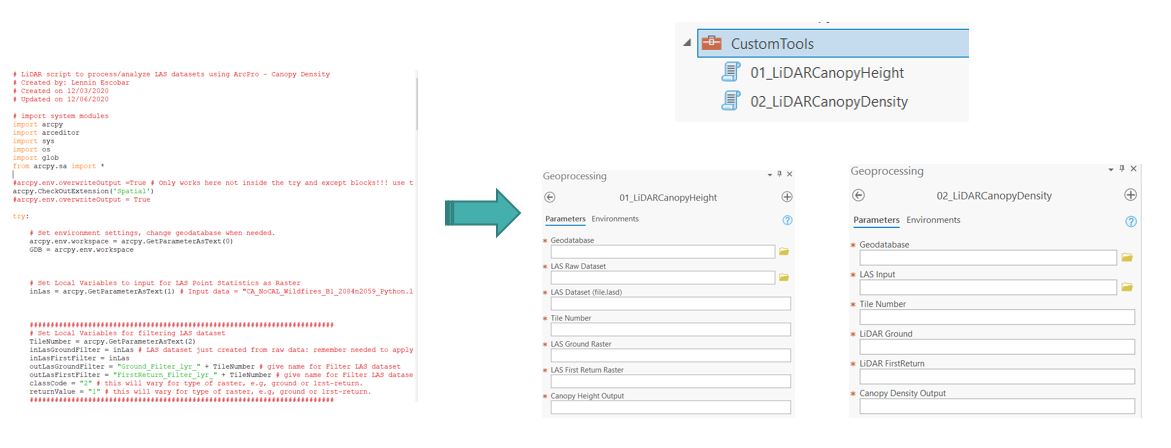
I also used Python programming language to create a couple of stand-alone scripts that included a series of geoprocessing operations that generated all the intermediate and
final outputs needed to create the models. Then, I turned the python scripts into custom tools using the functionality provided by the toolbox in ArcGIS Pro (Figure4).
,
Figure3 - Canopy Height and Canopy Density Models
,
Figure4 - 3D view of Raw LiDAR - 1000m by 1000m tile
Figure5 - Python Script and Custom Tools
Results
Canopy Heigt Model (CHM) (Figure6) and the Canopy Density Model (CDM) (Figure7) results are shown below. These consist of 5 LiDAR tiles with a total area of 5 km2.
Each tile has an area of 1000m by 1000m and they were processed and analized individually using the custom tools created in ArcGIS Pro.
,
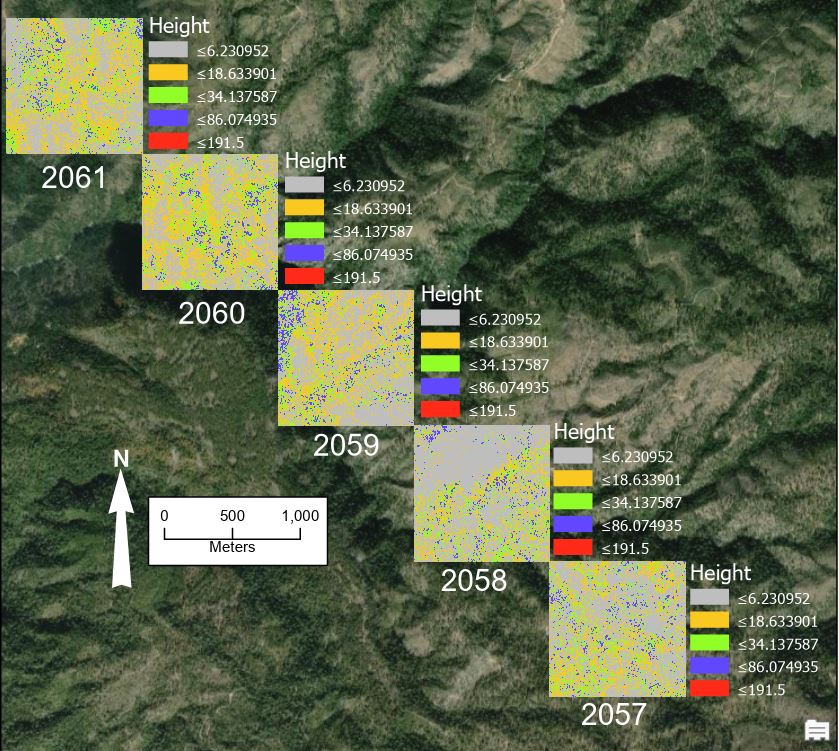
Figure6 - Canopy Height Model
,
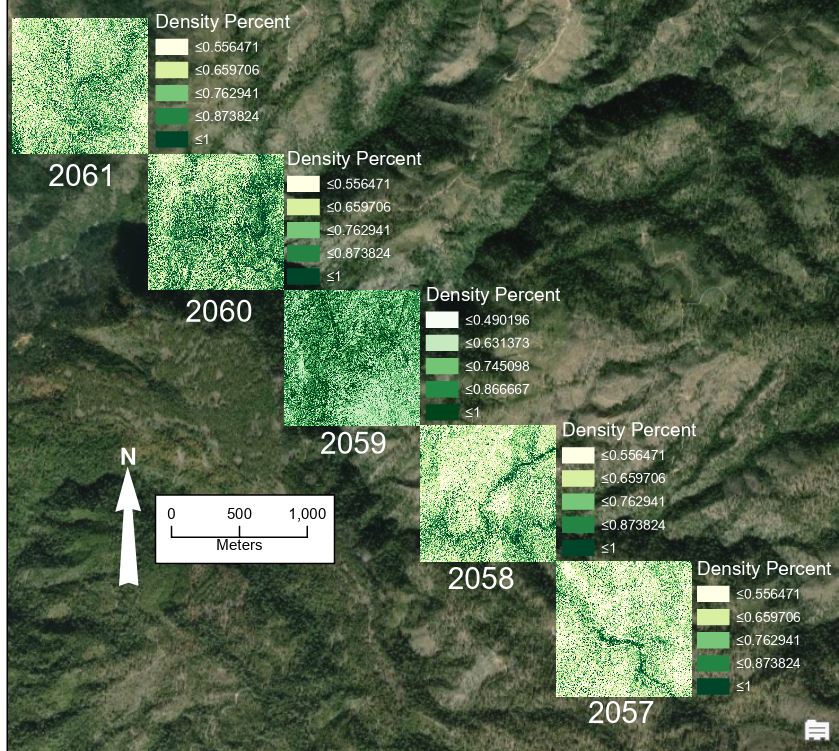
Figure7 - Canopy Density Model
Analysis
The canopy height model results for the tiles 2057, 2058, 2059, 2060, and 2061 show canopy heights that range from 6m to 86m approximately. The canopy height model
also presents some outliers that range from 86m to 191m that might be associated with man-made structures in the area, however, further analysis is encouraged to confirm whether
this is statement is true or not.
On the other hand, the canopy density model results for tiles 2057, 2058, 2059, 2060, and 2061 show high-density canopy coverage for the dark green areas and low-density
canopy coverage for areas with lighter colors. The pixel classification was performed using Natural Breaks with 5 classes for both models.
Conclusion
The study presents a standardized LiDAR workflow (Customs Tools) which is developed to process and analyze the data quickly and consistently using ArcGIS Pro 2.6.
The canopy height and canopy density models allow data analysts and forester to obtain new insights regarding vegetation coverage, endangered species habitats, and landscape.
Also, the models and other derived LiDAR products can be used to help assess forest health, calculate forest biomass, and classify terrain. Finally, depending on the scope of
the project, further analysis could be performed as well by creating 3D visualizations using the 3D capabilities and functions provided by ArcGIS Pro.
References
Hyyppð, J., H. Hyyppð, D. Leckie, F. Gougeon, X. Yu, and M. Maltamo. 2008. Review of methods of small-footprint airborne laser scanning for extracting forest inventory data in
boreal forests. Int. J. Remote Sens. 29(5):13391366. doi: 10.1080/01431160701736489.
Kane, V.R., J.D. Bakker, R.J. McGaughey,J.A. Lutz, R.F. Gersonde, and J.F. Franklin. 2010a. Examining conifer canopy structural complexity across forest ages and elevations
with LiDAR data. Can. J. Forest Res. 40(4):774787. doi: 10.1139/X10-064.
Kane, V.R., R.J. McGaughey, J.D. Bakker, R.F. Gersonde, J.A. Lutz, and J.F. Franklin. 2010b. Comparisons between field- and LiDAR-based measures of stand structural
complexity. Can. J. Forest Res. 40(4):761773. doi: 10.1139/X10-024.
Sean M. A. Jeronimo, Van R. Kane, Derek J. Churchill, Robert J. McGaughey, and Jerry F. Franklin, Applying LiDAR Individual Tree Detection to Management of Structurally
Diverse Forest Landscapes, Society of American Forester, 2018, pp 336-346.
Appendices
Interested to learn more about this project or any supplemental information, contact me at w1776890@apps.losrios.edu, I'd be happy to help.