| Title Data Acquisition of Imagery of The Camp Fire Around Lake Oroville | |
|
Author Tyler Harris American River College, Geog 350: Data Acquisition in GIS, Fall 2020 | |
|
Abstract In late 2018, The Camp Fire quickly became the deadliest wildfire California has ever seen. The purpose for my project was to discern the widespread availability of spatial data available to the general public. | |
|
Introduction The Camp Fire was and is the deadliest wildfire that California has experienced. Nearly 19,000 structures and 85 deaths resulted from the blaze. As I began investigating the availability of usable spatial data, I became aware that much of said data was not easily obtained. Once I dug a little deeper, I did find what I was looking for, for the most part. | |
|
Background | |
| On November 8th 2018, at approximately 6:30am, under a red flag warning for extreme fire weather issued from The National Weather Service, a densely wooded area near Jarbo Gap begins what would later become what is known as The Camp Fire. This incident is one of personal importance to me as I have family members who were directly affected by the fire. It became clear that the focus of this project would be less about the analysis of data and more about the acquisition and curation of usable data. |
|
|
Methods | |
| Outside of taking time for general research, the methods for my acquisition were pretty straightforward. Creating an account with USGS to gain access to downloadable data from EarthViewer. I also utilized articles from The Chico Enterprise Record, statistics from CalFire, and formatting information from the Geog 350 Project Papers webpage. Downloaded files were georeferenced and symbolized in ArcGIS Pro for viewing. Files will be exported as JPEGs and added into HTML for publishing on the Project page. |
|
|
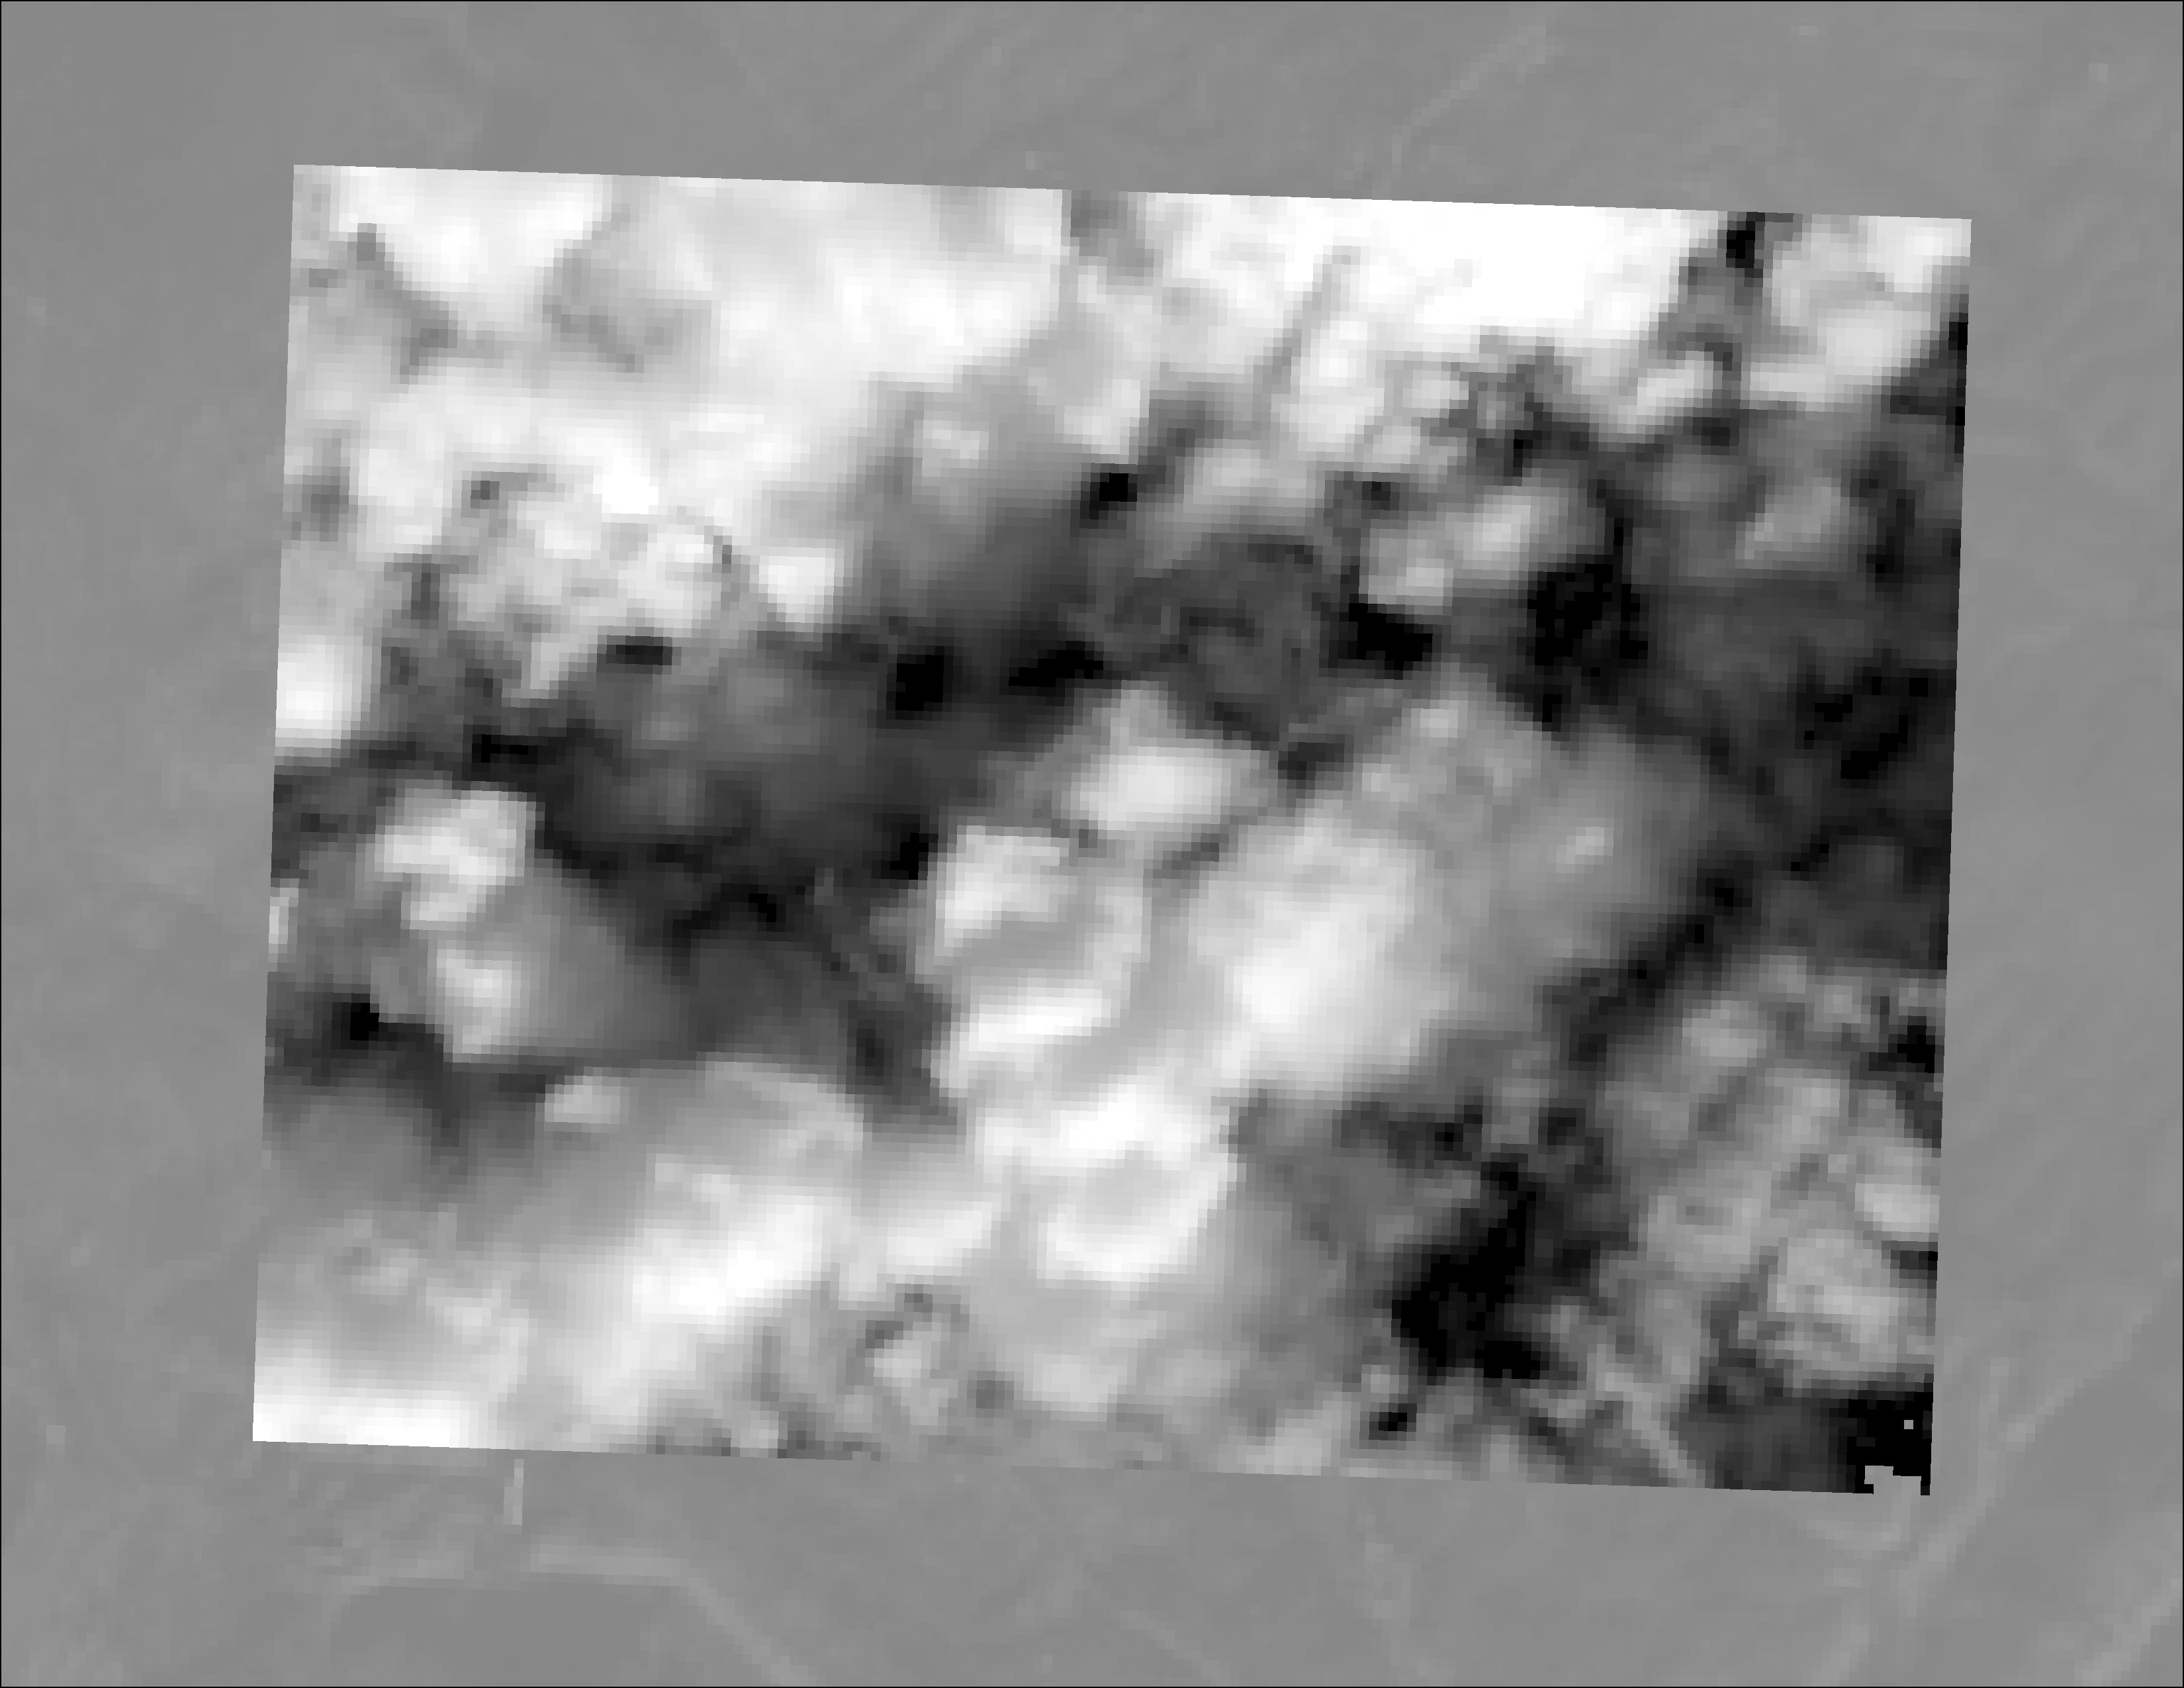
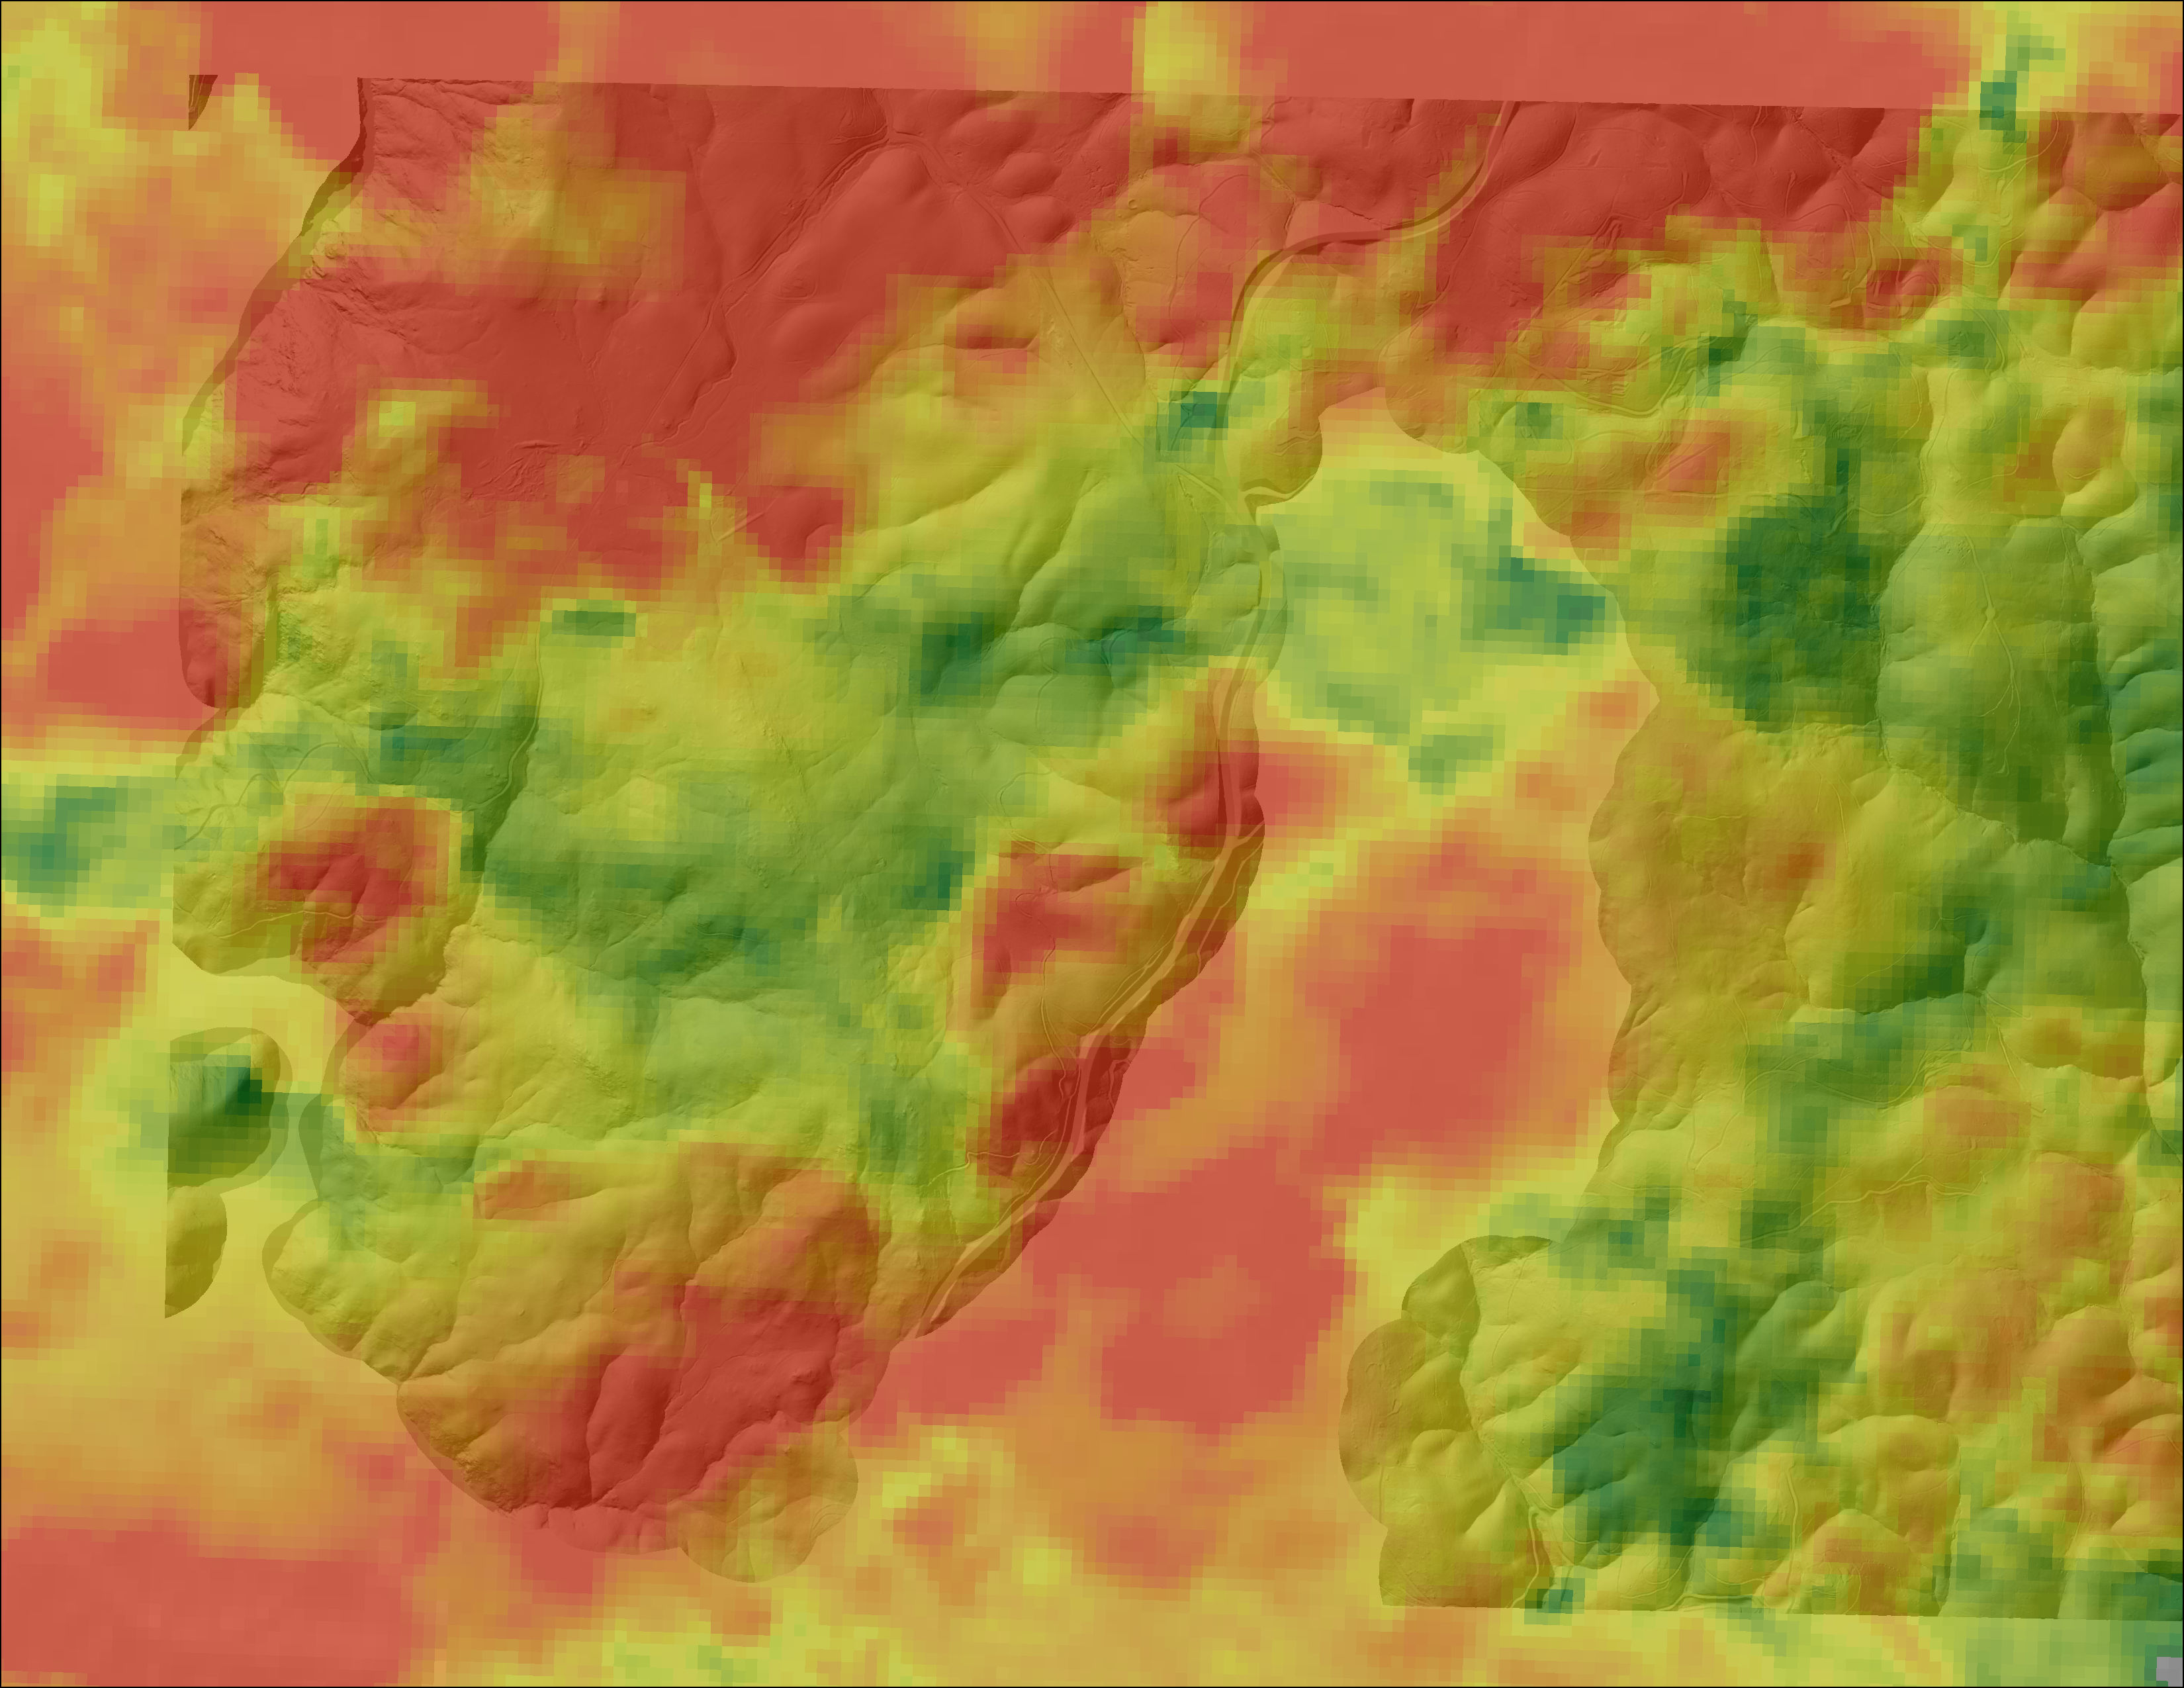
Results Results were of varying satisfaction to me. The images (TIF) displayed varying degrees of cloud cover which significantly obscured the topography of the area. But, what I then understood was that is what my data is showing me. | |
|
Analysis Fairly easy and, again, straightforward analysis. Cloud cover is obstructive in the first image procured and less so in the second. From the pattern of cloud cover it looks as though wind and fire containment are the major factors for change. | |
|
Conclusions This project started out very differently than it ended. My first impression was that I got frustrated with the imagery I was getting. But after time and research I began to understand that this was not a project about analysis as much as it was about doing what you can with the data you are presented. I think the overall format of the class really helped to drive home the point that in this field you are also required to be critical of your process and forge ahead regardless. | |
|
References Imagery from USGS EarthViewer, Timeline information from The Chico Enterprise Record, Statistical information from CalFire, Formatting and presentation information resourced through American River College. | |