| Title Testing Spatial Patterns of Racial & Economic Segregation in Sacramento through Spatial Autocorrelation (Statistics) | |
|
Author Veronica Herrera American River College, Geography 350: Data Acquisition in GIS; Fall 2020 | |
|
Abstract Discriminatory housing practices and policies have shaped the geographies in Sacramento neighborhoods. These geographies are consistent with spatial patterns of racial and economic segregation that the City of Sacramento is now attempting to address in the addition of an Environmental Justice Element to their General Plan Update or, SB 1000, "The Planning for Healthy Communities Act". Given that this geography spans across time and space in Sacramento, this project aims to test whether this intergenerational geography is an occurrence of chance by analyzing decades of Sacramento County census data, and performing a test of randomness and clustering visualization, by using the California Fair Housing Task Force's Opportunity Area Data, and Esri's Global and Local Spatial Autocorrelation. | |
|
Introduction In support the City of Sacramento's plan to develop an Environmental Justice Element for the 2040 General Plan Update, the author provided GIS mapping services to JCH Research, a consulting firm that was tasked to provide a focused study on the impacts of nationwide discriminatory housing and land use practices inform the development of the City's Environmental Justice Element, and tools that can aid in the practice of environmental justice and social equity in Sacramento. One of these essential tools utilized the use of Geographic Information Systems (GIS) to visualize patterns of racial segregation and inequity through more than 5 decades, which now California legislation now seeks to address. Municipalities like the City of Sacramento and counties now have to incorporate an Environmental Justice Element in compliance with Senate Bill1000 "The Planning for Healthy Communities Act", to their General Plans. The General Plan is a blueprint on how the city or county plans to address the future development of the city or county by adopting a set of policies, standards, objectives to help achieve future development goals. More importantly, general plans are critical tools in the decision making process surrounding the prioritization in local land use planning and funds allocation. Now, as a result of former Governor Brown's 2019 SB 1000 (State of California Department of Justice, 2020). The addition of an environmental justice element to General Plans highlights the need for more micro-level approach in addressing longstanding planning issues. 
What is Environmental Justice? Environmental Justice as defined by California Law, is "the fair treatment of people of all races, cultures, and incomes with respect to the development, adoption, implementation, and enforcement of environmental laws, regulations, and policies," (Cal. Gov. Code, § 65040.12, subd. (e).) . SB 1000 does not provide a template on how to address environmental justice, but what it does is provide important clues that an environmental injustice is tied to space and location, or geography. This specific geography is described as "Disadvantaged Communities or DACs", a term that reflects areas or census tracts in California that are disproportionately burdened by pollution and other 25 social and economic indicators such as low educational attainment, poverty, low birth weight, and blank to name a few. These DACs are also in the top 25th percentile of the CalEnviroScreen 3.0, an interactive map/screening tool developed by the Office of Environmental Health Hazard Assessment to display those census tracts that are disproportionately burdened, and to aid in the prioritization of cap-and-trade funds through SB 535, the California Global Warming Solutions Act of 2006: Greenhouse Gas Reduction Fund. In Sacramento DACs consist of northern and southern census tracts within city boundaries as shown in figure 1. 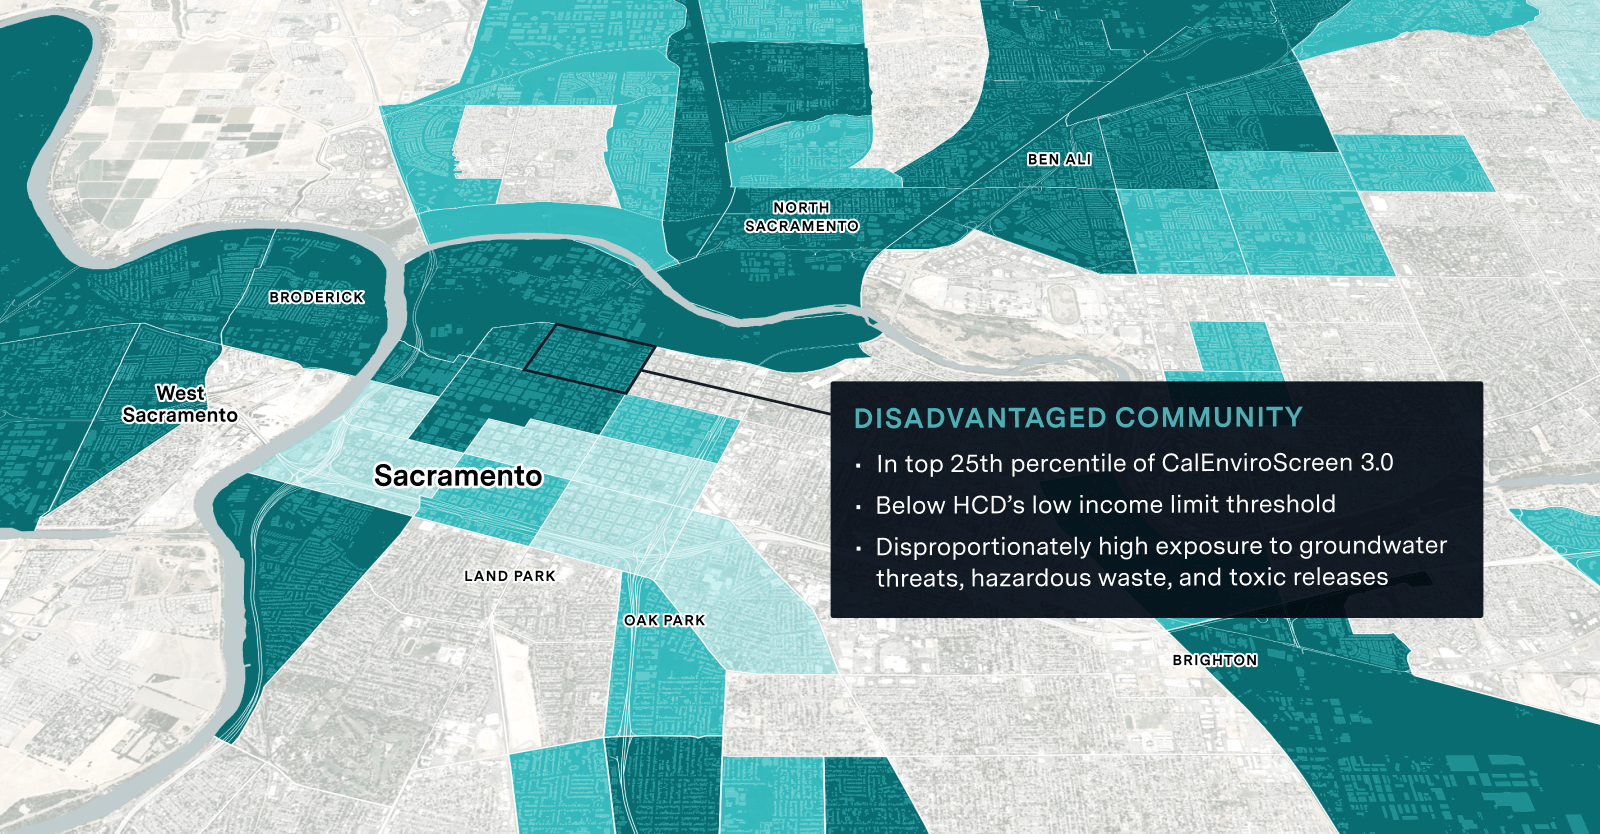
Through my work for JCH Research a series of maps were developed to visualize the geographies that reflect the needs to support environmental justice and spatial equity in local policy and planning practices. An array of maps that reflect the health and needs for a healthy neighborhood including employment, health, wealth, housing, and the hard and social infrastructures that helps tie it together. All of them showed a remarkably similar geography where neighborhoods located in the north and south census tracts in the City of Sacramento, similar to the SB 535's DACs. However, the entire county of Sacramento was included in the study area as the study of segregation necessitates an extended geography that reflects the varying degrees of investment that occur outside city limits and influence the development of a segregated geography. | |
|
Background This project supports existing literature by Dr. Jesus Hernandez, PhD, an academic from the University of California, Davis who studies, "how institutional structures and market interventions articulate the nexus between race and economy and highlights the importance of equitable urban planning, housing finance, and public policy in building effective community-based economic development strategies"(Hernandez, 2020). Dr. Hernandez's work includes focused case studies on the history of Sacramento's discriminatory housing practices, planning and policies and how they've shaped the geography we see today. More importantly, his case studies highlight environmental injustice as a historical process from early on after the annexation of land in Sacramento in 1911 in which real estate professionals/institutions use various tools to restrict certain racial classes from residing in developing suburban housing development. One of them includes the use of racial covenants, racial property deeds that restricted occupancy to "whites only" to neighborhoods now known as Curtis Park, Lank Park, McKinley Park, and Tahoe Park (Hernandez, 2014) . Additional insights are provided in his work but ultimately point to the result of these decisions to a concentration of race, poverty, and other social ills in the north and southern neighborhoods of the city. To evaluate this concentration of racial and economic segregation an analysis at the neighborhood scale via census tracts, was determined the best unit of analysis. Viewing data at the macro or meso level such as state, region, county, or even zip codes, does not provide an appropriate scale for referencing data due to scale of impacts as a result of these policies and plans. Similar lines of thinking were presented in "Space, race, and poverty: Spatial inequalities in walkable neighborhood amenities," by Duncan, et al., who explored the use of spatial analysis methods to evaluate potential spatial inequalities in walkable neighborhoods of Boston, MA. The research utilized census tract/data and a spatial demographic perspective to evaluate the relationship between socio-economic characteristics and walkable neighborhood amenities. Similarly, this project uses census tracts as the unit of analysis for running statistical analysis to test the intergenerational geography as a result of the policies planning described in Dr. Hernandez's studies, and to aid in the City of Sacramento's development of their Environmental Justice Element. | |
|
Methods To test the described geography, we performed a test of randomness by utilizing GIS spatial analysis tools through Esri's Spatial Autocorrelation, Global and Local Moran on California Fair Housing Task (CFHT) Force's Opportunity Mapping Data. The CFHT is a group of researchers and independent organizations convened in 2017 by the Department of Housing and Community Development, and California Tax Credit Allocation Committee, with the intention of carrying out HCD's goals which include to avert further segregation, the concentration of poverty, and to "Encourage additional access to opportunity through land use policy and affordable housing program design and implementation". CHFT's Opportunity Area Mapping Tool was an appropriate choice due to its intent to map the existing spatial distribution of private and public resources, areas of "opportunity" for childhood development and economic mobility, and to prioritize areas for private investment in the affordable housing for low—income families in California. The tool calculates an index for all tracts in California using an array of 21 economic, education, and environment indicators, which were categorically ranked into opportunity categories, from "Highest Resource" to "High Segregation & Poverty" census tracts. These opportunity ranking categories for Sacramento County census tracts were the basis for testing the randomness or spatial pattern of the observed outcomes and their location through Esri's Spatial Autocorrelation Global Moran I and Local Morans I spatial statistics. | |
|
Results Spatial autocorrelation is an important tool that helps measure the spatial dependence between values of random variable over space/geographic location (Esri, 2018). This statistical tool was selected due to its intent in observing variables that are independent of one another but when a pattern exists, it is expressed as clustered, dispersed, or a random geographic pattern. The Global Moran I ultimately functions as an inferential statistic in which results are expressed in terms of the null hypothesis. In this context the null hypothesis is that "the pattern of racially and economically segregated Census tracts in Sacramento County are random." The local statistic version, Local Moran I, helps provide a visual representation of it by identifying significant spatial clusters of high or low values. As a point of reference the Opportunity Area Mapping data for Sacramento County was initially presented through a choropleth map which displayed the ranking categories, from Highest Resourced to High Segregation & Poverty census tracts. The results point to a similar geography where north and south census tracts are ranked as High Segregation & Poverty. This was the base of spatial analysis test and as the inputs. 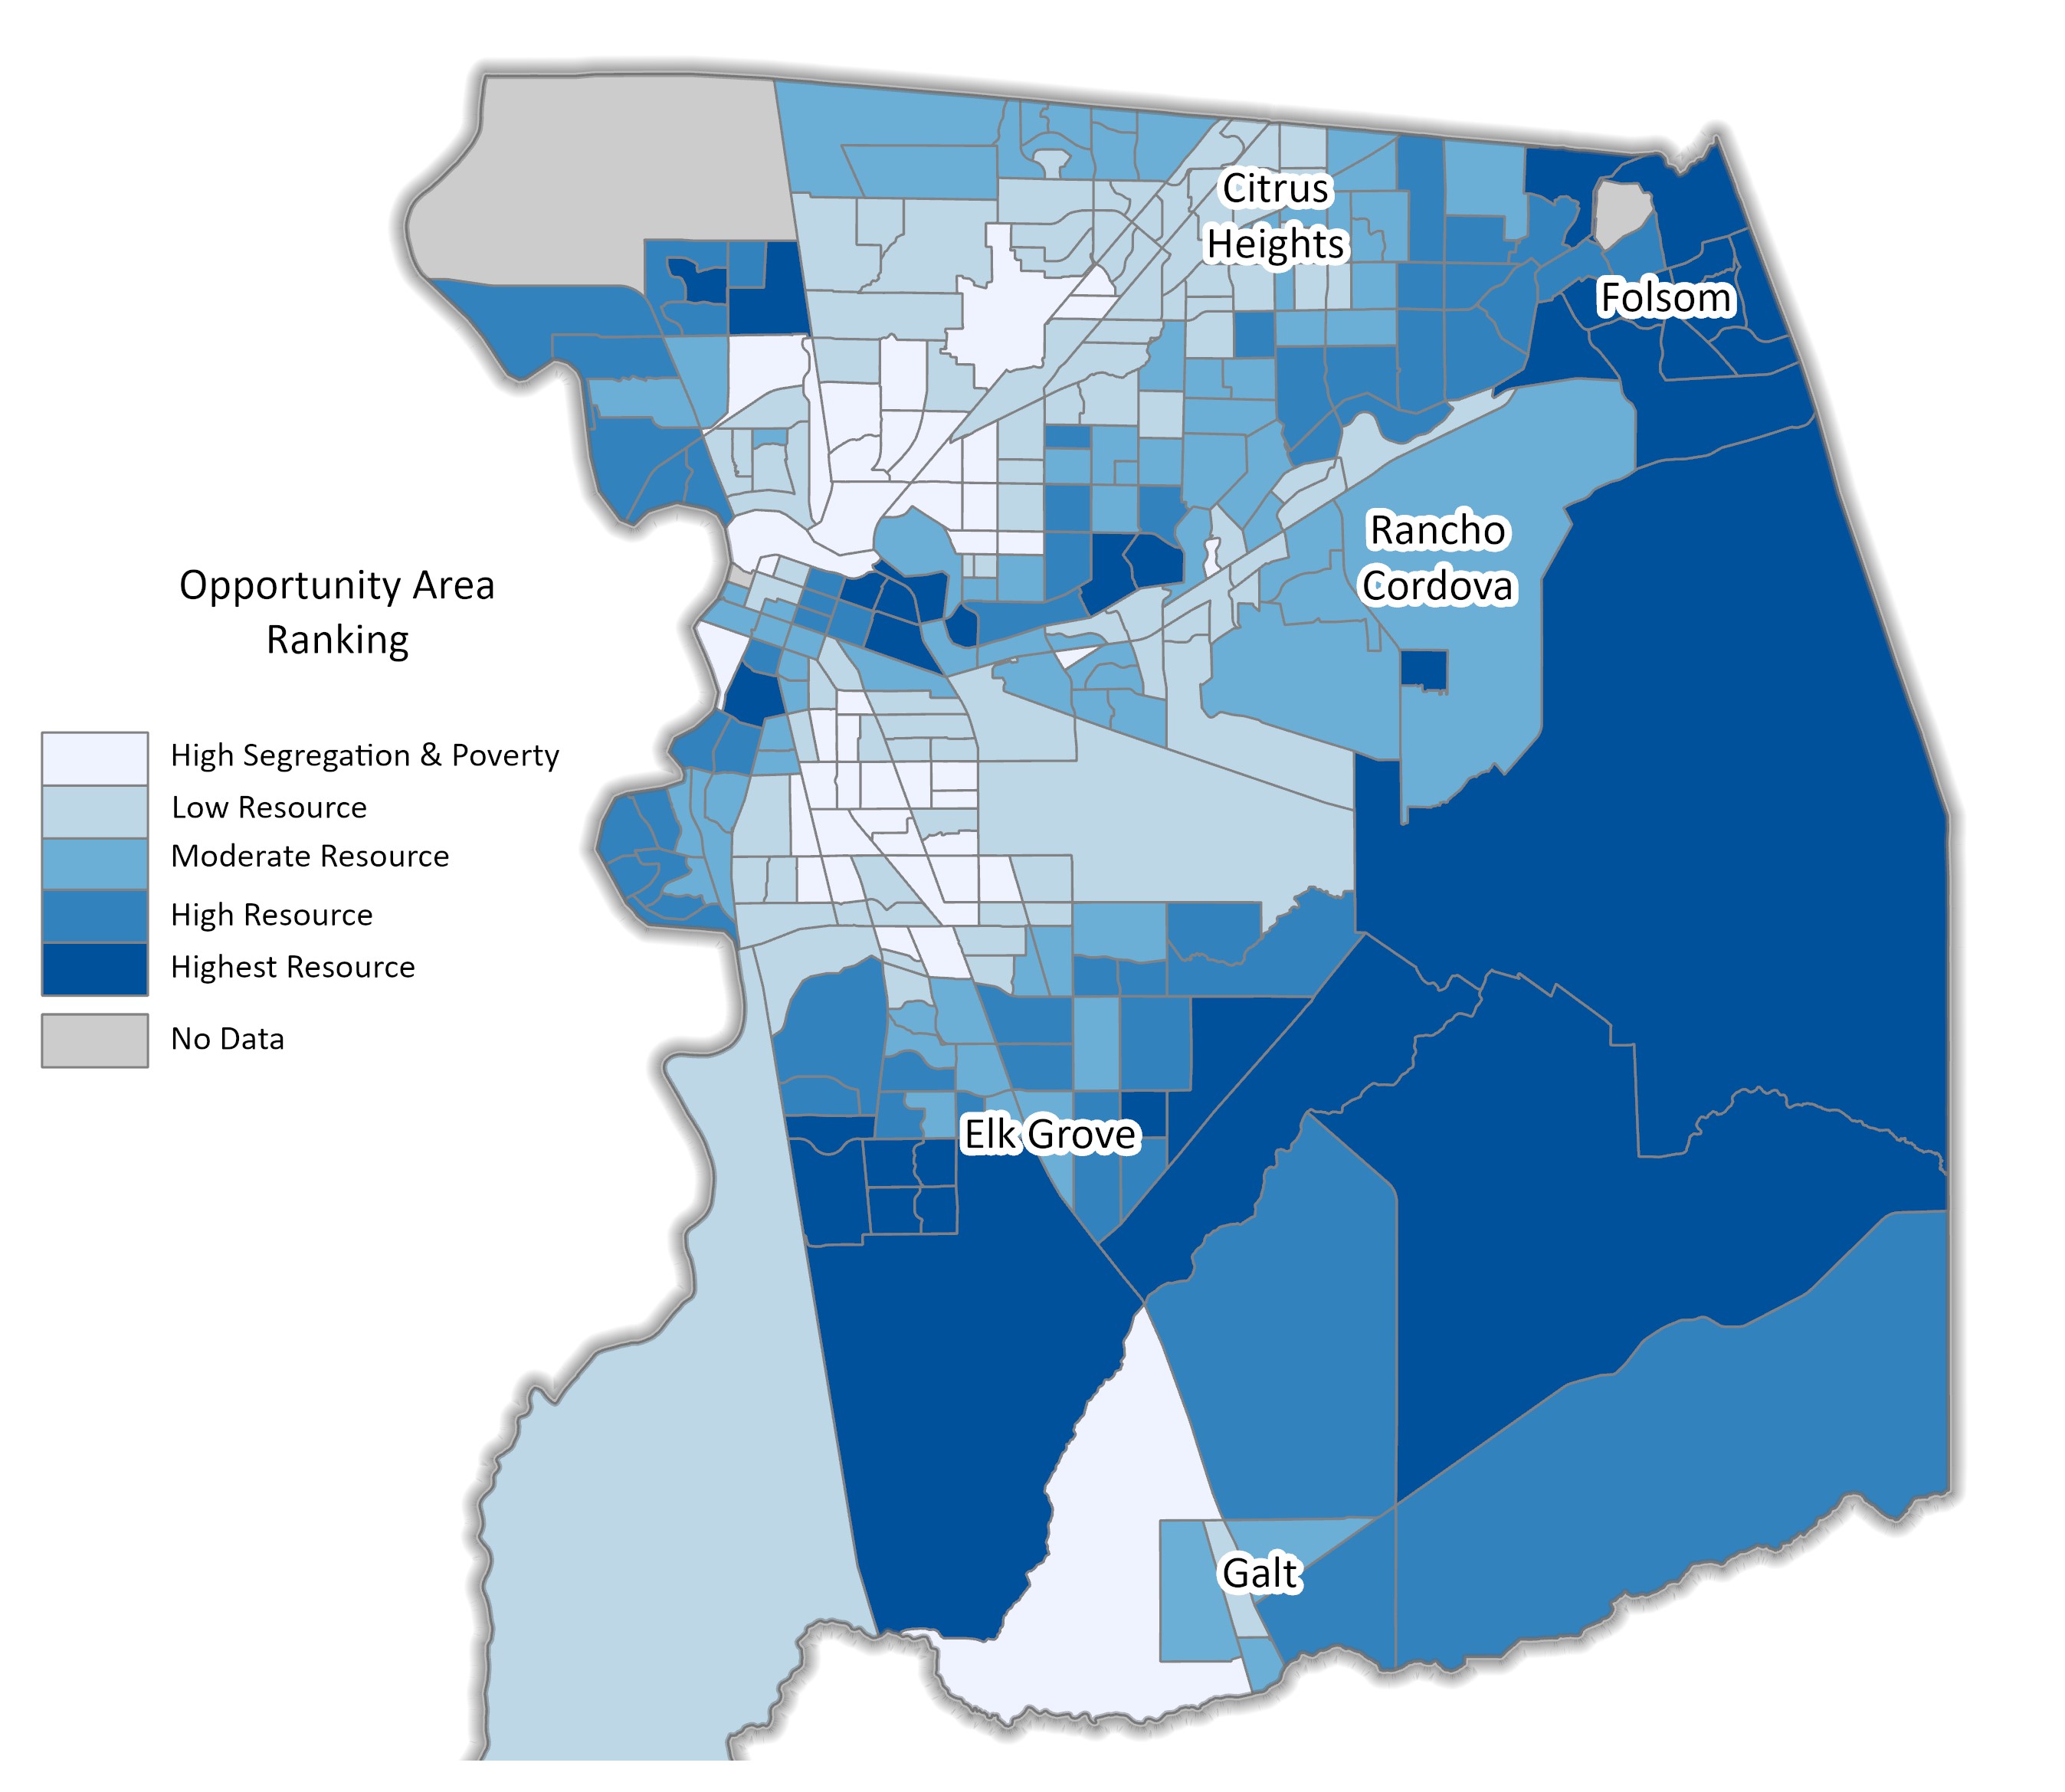
Incremental Spatial Autocorrelation utilized the CHFT's Opportunity Area Mapping layer for Sacramento County and 2010 TIGER/Line census tract shape file. Moran I's spatial autocorrelation was performed to determine an appropriate distance band (6 miles) which was then used to construct a spatial weights matrix to quantify the spatial relationships among the census tract polygons needed to generate the Global Moran—s Index. This distance band was selected to ensure that each feature polygon had at least 2 neighbors. Results included a Moran index value of .44282, a z—score of 25.774 and p value of 0.000. A positive index score indicates a spatially clustering geography where low values cluster near other low values, and high values cluster around other high values. The Z—score and p—value indicate results that the clustering of segregated census tracts is statistically significant at the 99% confidence interval and provide sufficient evident to reject the null hypothesis. Lastly, the second test, Local Moran I was run to identify statistically significant clusters of residency and resource levels. 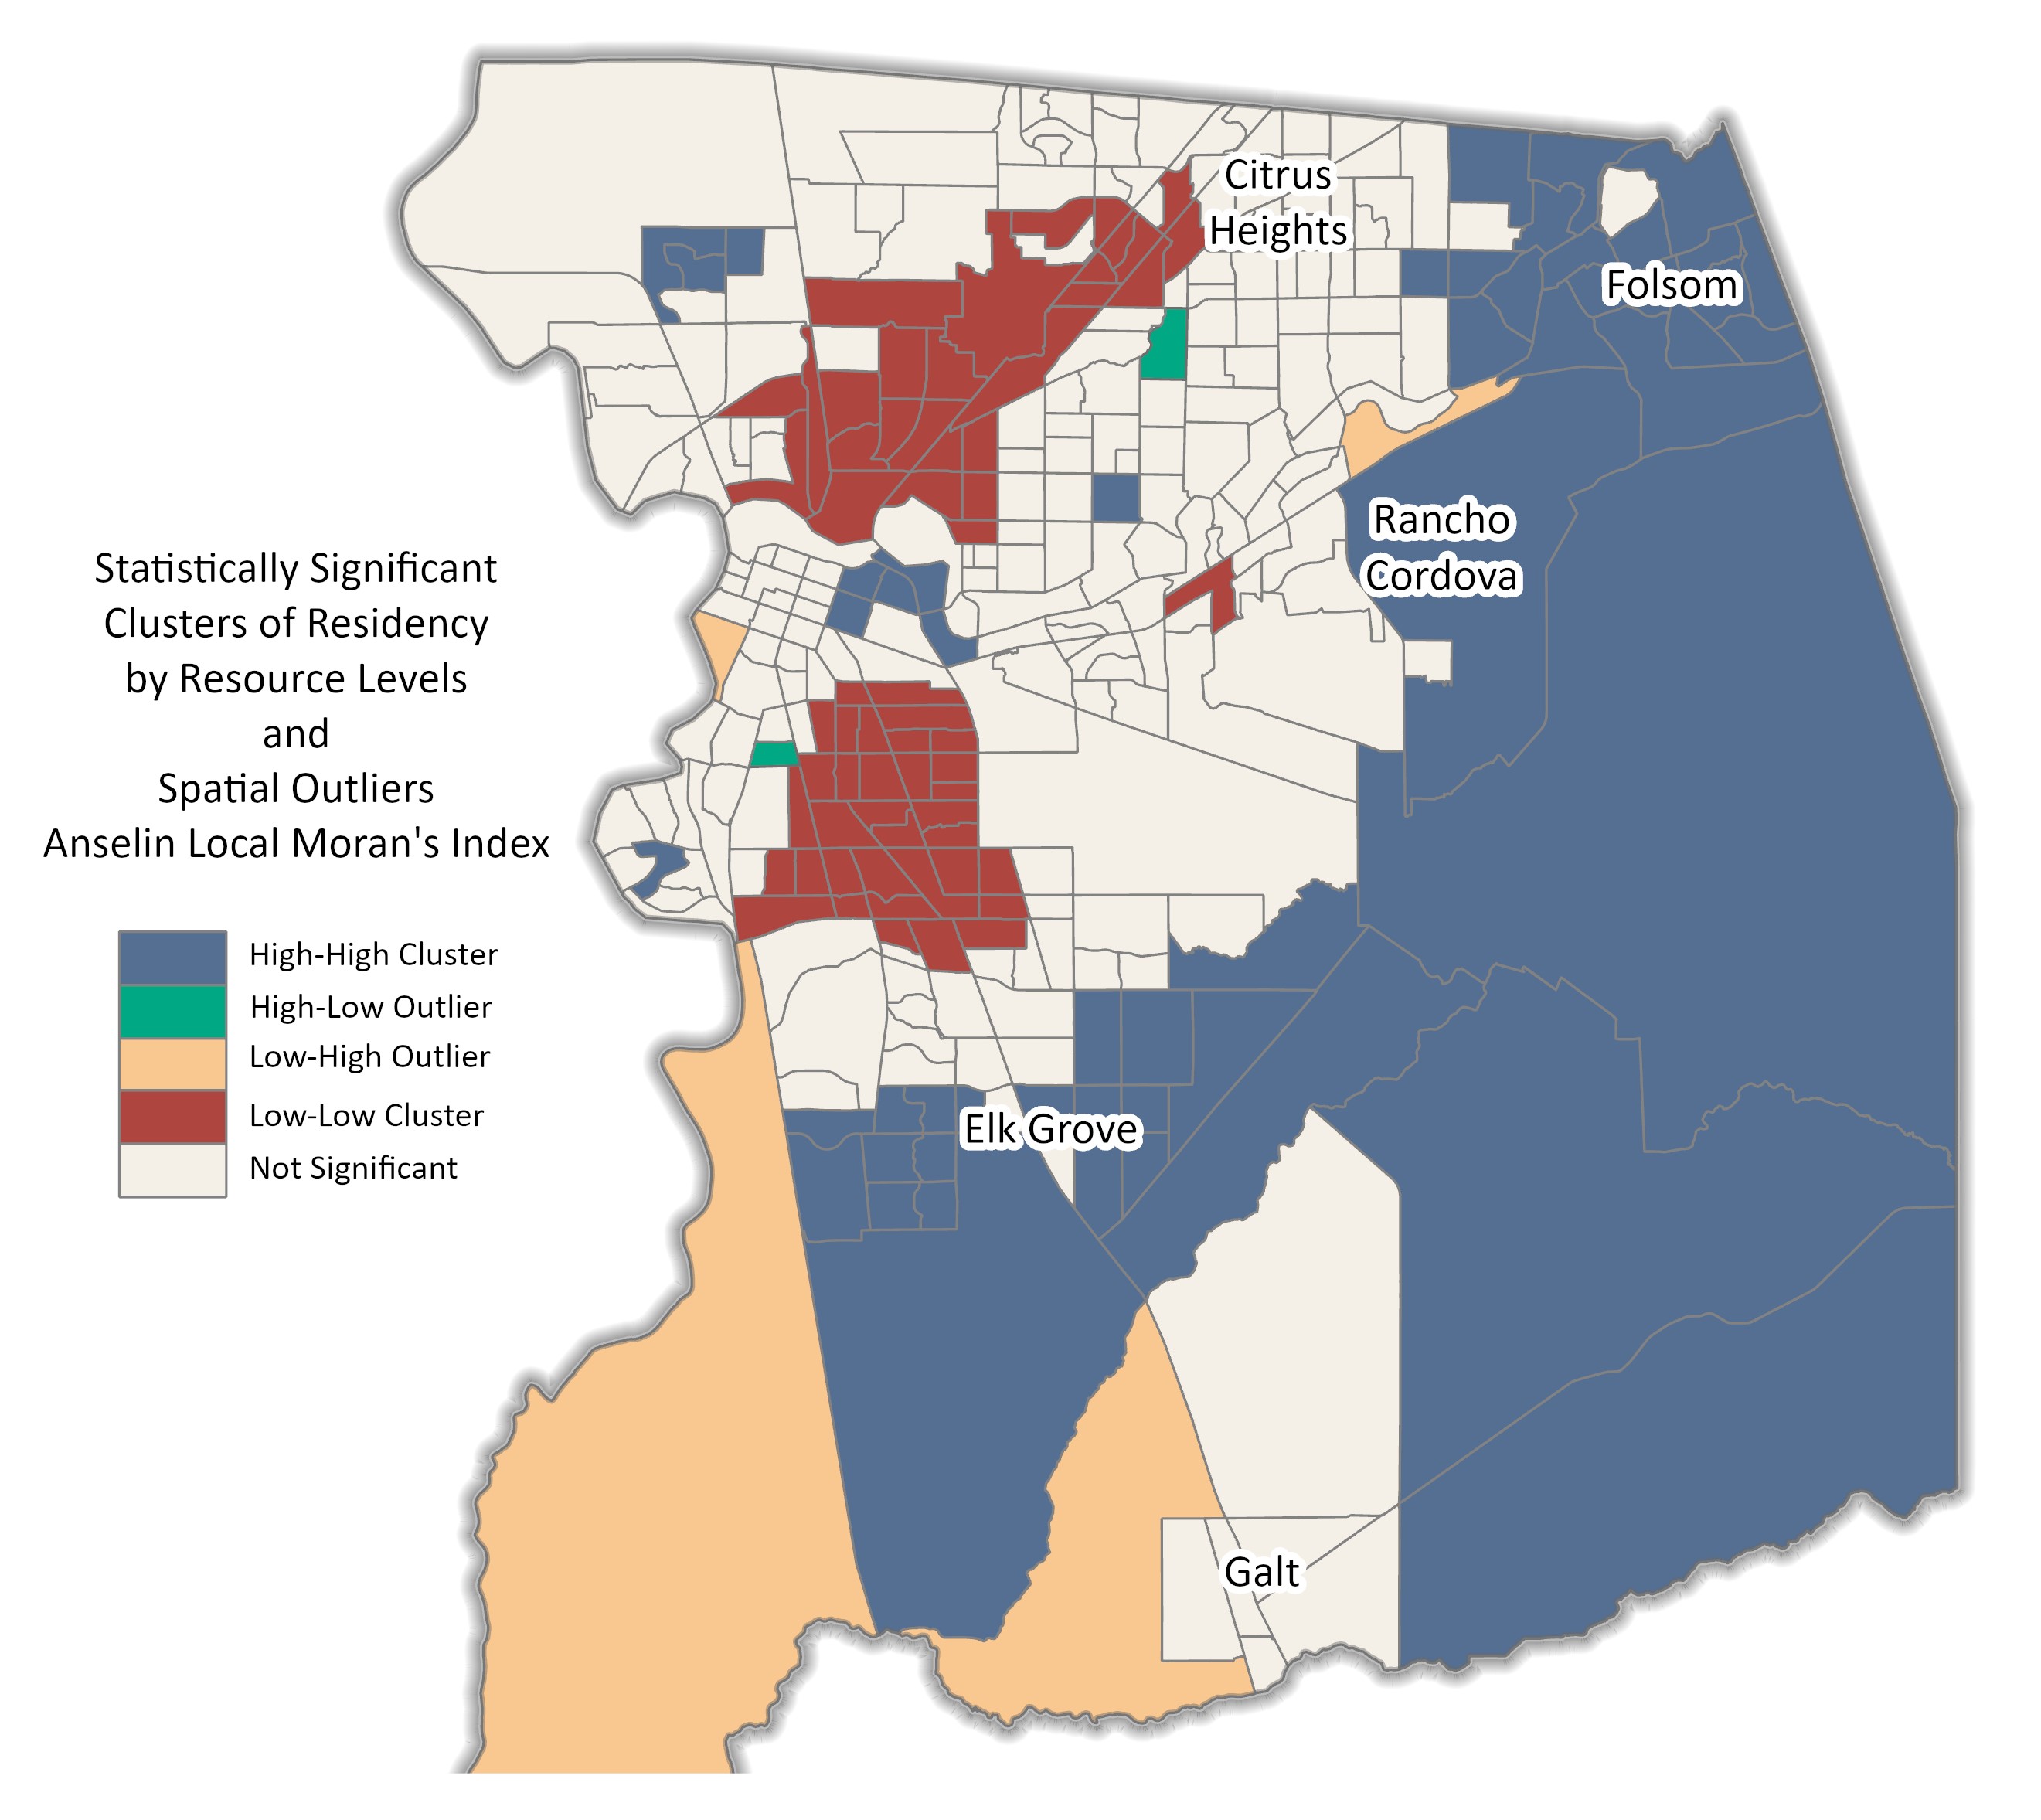
Local Moran I results present spatial clusters where of high and low values, and spatial outliers. The findings show that census tracts of segregation and poverty areas as a north and south geography. The Cluster and Outlier Analysis (Anselin Local Moran's Index) distinguishes between a statistically significant cluster of high values (HH), a cluster of low values (LL), an outlier in which a high value is surrounded primarily by low values (HL), and an outlier in which a low value is surrounded primarily by high values (LH), all run through a statistical significance set at the 95 percent confidence level. The Global and Local test results, together, provide sufficient evidence to reject the null hypothesis that the pattern of racially and economically segregated census tracts in Sacramento are random. | |
|
Analysis This type of analysis can provide insight on the degree and length of impact that policies and planning can have on Sacramento neighborhoods, emphasizing the need for more neighborhood focused planning. Due to persistence of socio-economic conditions in census tracts with that are categorized as High Segregation & Poverty, past and future, it is imperative that additional actions to address environmental justice are localized. While there is sufficient data to support existence of intergenerational geography under study, it is important to acknowledge the limitations to any statistical testing Similar to Duncan, et al. there are limitations to the autocorrelation method. One of them is the loss of variability during the normalization process, or aggregation of variable values. This is especially prudent in working with data that is captured in enumeration units which can include large size census tracts and can produce less variance (Duncan, Dustin T., et al, 2012). In the case of Sacramento County data this includes the large census tracts located east of the city's boundaries, which are primarily made up of large rural or underdeveloped census tracts. This is an important limitation to address when working to present neighborhood scaled data and defining a common "neighborhood" definition. | |
|
Conclusions There is an abundance of literature and data to present the geography that city needs to address through their 2040 General Plan Update, but additional improvements to the use of spatial data should be considered. For instance, the presence of larger census tracts could be normalized by using another associated attribute field(Daily, 2006), such as the population/population count under study or census tract area. | |
|
References 1. California Fair Housing Task Force, 2019. Opportunity Area Mapping Methodology, 2018. 2. City of Sacramento Image. - City of Sacramento 2040 General Plan Update Site - City of Sacramento, 2020 3. Duncan, Dustin T., et al. "Space, Race, and Poverty: Spatial Inequalities in Walkable Neighborhood Amenities?"Demographic Research, vol. 26, 2012, pp. 409— 448. JSTOR, www.jstor.org/stable/26349906. Accessed 12 Nov. 2020.
4. Esri, 2018. How Spatial Autocorrelation (Global Moran's I) works
5.Hernandez, Jesus. (2014). Race, Market Constraints, and the Housing Crisis: A Problem of Embeddedness. Kalfou: Journal of Comparative and Relational Ethnic Studies. 1. 29-58. 10.15367/kf.v1i2.31..
6. State of California Department of Justice, 2020 - SB 1000 - Environmental Justice in Local Land Use Planning. 7. Research Gate Profile, 2020. Dr. Jesus Hernandez, PhD. 8. Figure 1. - Disadvantaged Community in Sacramento Map - Urban Footprint - Map SB1000 Environmental Justice Compliance with UrbanFootprint, 2020 |