| Title Cache Creek Wilderness Landslide Risk Assement for Whitewater Boating | |
|
Author Russell Lessman American River College, Geography 350: Data Acquisition in GIS; Fall 2020 | |
|
Abstract Cache Creek Wilderness provides many outdoor recreation opportunities from hunting and fishing to whitewater rafting but is suspectable to natural disasters. | |
|
Introduction Cache Creek runs through the Cache Creek Wilderness and has had commercial whitewater rafting on it for several decades. The rafting company I work for is looking to expand operations to this river but are concerned about landslide risk. This project hopes to provide a repeatable landslide susceptibility analysis process to help determine overall risk when looking to expand to new rivers. | |
|
Background | |
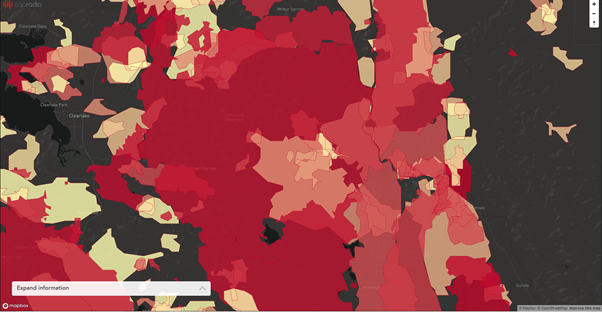
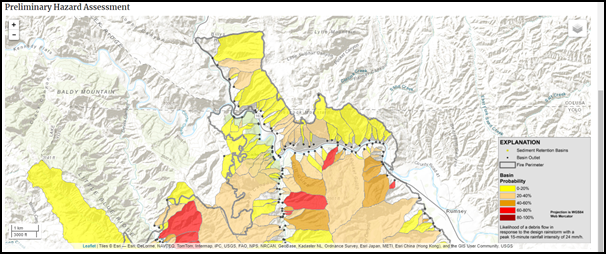
| Cache Creek Wilderness has a history of fires with this map from Capitol Public Radio showing fires going back to 1950.It is established that fires make landscapes sensitive to landslides but the exact mechanisms are complex. Generally heavy rain is needed to trigger them. (Petley). This USGS Debris Flow Preliminary Hazard Assessment shows potential of debris flows from rain in the LNU Lightning Complex Hennessey Fire area that burned through much of the white water rafting run. |
|
|
Methods | |
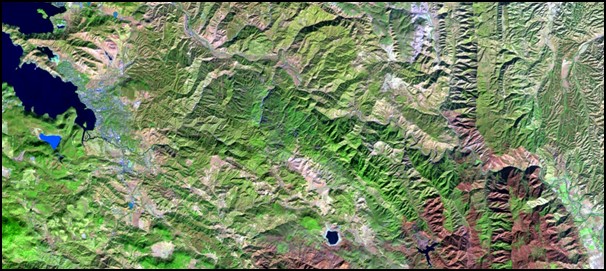
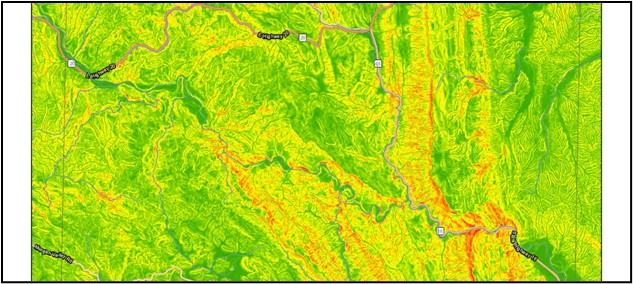
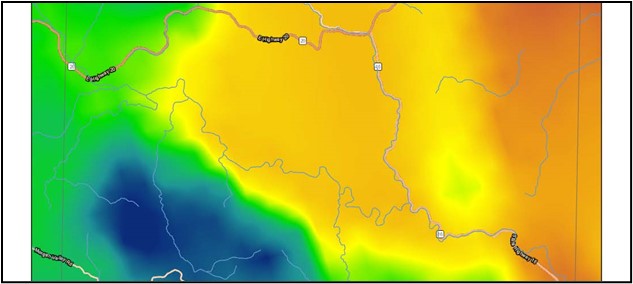
| Using 'Model landslide susceptibility using ArcGIS Living Atlas data' as a guide I used Multispectral Landsat Imagery, elevation data, and mean precipitation data from ESRI to create a basic but repeatable analysis using a raster function template. Using this data allows for flexibility as my employers do not have the budget for proper GIS machines or storage. Landsat was filtered to the month of January 2019 and the processing template was removed. Elevation was converted to slope, with red areas being closest to 90 degrees. Rainfall symbology and statistics were changed. All three were then remapped and weighted with the analysis output getting clipped to the area of interest. |
|
|
Results | |
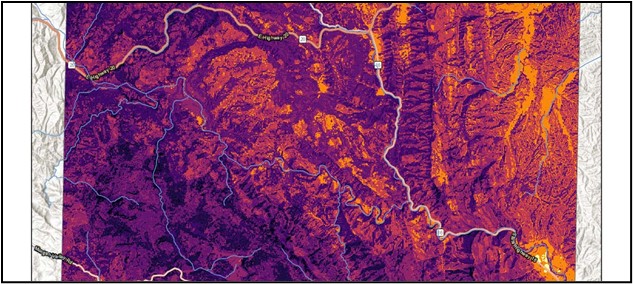
| Darker the purple higher the slide risk, roads, rivers, and creeks overlayed for reference. |
 >
> |
|
Analysis While there are some areas of concern along the two highways and the creek itself the worst area of slides is the southwest corner that has the highest mean rainfall inside the area of interest. Heavy rains are unlikely in the summer time when the commercial season is happening but debris flows and slides from the winter can deposit dangerous materials in unwanted places that could be risks during the rafting season. | |
|
Conclusions Is it too risky? That is for the bosses to decide. Further analysis of other whitewater rafting rivers would be helpful in determining whether this constitutes an acceptable amount of risk. But there are some unavoidable inherent risk in whitewater rafting business, since most whitewater rivers or creeks run through steep canyons. There are also other risk factors that need to be considered this project only focused on one specific risk factor. Overall, I think this analysis method provides a nice platform for further research while being light on hardware requirements. | |
|
References 1. Photo: 'A History of California Wildfires.' Capital Public Radio. Retrieved from http://projects.capradio.org/california-fire-history/#10.73/38.8998/-122.379 2. Petley, Dave 'Landslides after wildfires.' American Geophysical Union. 11 August 2020,https://blogs.agu.org/landslideblog/2020/08/11/california-wildfire-research-1/. Accessed 11 Nov. 2020. 3. Photo: 'LNU Lighting Complex Hennessey Fire Preliminary Hazard Assessment' US Geologic Survey. Retrieved from https://landslides.usgs.gov/hazards/postfire_debrisflow/detail.php?objectid=308 4. Gilbert, Mark. Buckley, Aileen 'Model landslide susceptibility using ArcGis Living Atlas data' ESRI. https://learn.arcgis.com/en/projects/model-landslide-susceptibility-using-living-atlas-data/ 5. Data Sources: Landsat: Esri, USGS, AWS , NASA. 6. Data Sources: Elevation: Airbus, USGS, NGA, NASA, CGIAR, NLS, OS, NMA, Geodatastyrelsen, GSA, GSI and the GIS User Community. 7. Data Sources: Mean Rainfall: USGS | |