| Title An Examination of Potential Wildlife Overpass Locations in the Northern Sierra |
|
Author Britnee Pannell American River College, Geography 350: Data Acquisition in GIS; Fall 2020 |
|
Abstract Animal- vehicle collisions (AVC) are costly and put human and animal life at risk. Wildlife overpasses have been shown to successfully reduce the amount of AVCs that occur. Despite its size and proportion of quality deer habitat, California has not yet wildly implemented the use of wildlife crossing structures. Using a variety of GIS data, this study shows that road traffic intensity, stream road crossings and nearness to evergreen forests can be used as a valid model of probability of deer collision locations in the Northern Sierra region of California. Human inhabitation of a region may also serve as an indicator of deer collision potential although further research is required to determine how this can factor into collision probability. |
|
Introduction With automobiles a part of life for many people, freeways and interstates become vital arteries to connect cities and vacation sites. As a result animal habitat has become more and more fragmented with each new roadway built. Animals are forced to cross these road boundaries to reach sources of food, companionship and shelter; putting themselves and humans traveling though the area at risk of injury or death when collisions inevitably occur. Installing wildlife safety corridors or overpasses is a way to mitigate and prevent these tragedies. Banff National Park in Canada has had great success in installing, maintaining and collecting data on wildlife overpasses for the last 20 years. Using this and numerous other examples, this study seeks to determine if there are prime locations for installing wildlife overpasses in the Northern Sierra region of California. A variety of data will be analyzed using ArcGIS Pro and compared with actual collision data to determine optimal locations to construct a wildlife overpass. |
|
Background
Coinciding with the increase in personal automobiles available, biologists and naturalists have been aware of the negative impact roads have had on animal life since at least the 1920's (Kroll, 2015). Despite this, road ecology is a relatively new field of study. The only organization of its kind dedicated to studying road ecology is the UC Davis Road Ecology Center; opened in 2003 (Road Ecology Center, 2020). A benefit to the focus on road ecology has been determining exactly how roads negatively impact animals. Roads have been shown to cause habitat fragmentation (Saunders et al, 1991). This can cause changes to the physical lay out of habitat, shrinking the areas species can live and changing how wind, water and food resources move through an area. Thus animals can be forced to cross roads to reach resources. Roads also cause genetic isolation for species which are unable to cross roads at a high enough frequency (Riley et al, 2006). This leads to inbreeding and less genetic diversity in animals. For endangered or at risk species, these two factors alone can lead to an "Extinction Vortex" event for local populations (Blomqvist et al, 2010); where population numbers shrink until the species is no longer viable in the wild. The most visible impact roads have had on animal populations is death as a result of vehicle collisions. It is estimated that over one million vertebrate animals are killed every day in the United States alone (Noss, 2001). California is the third largest state in the Union. It contains over 33 million acres of forest land and is 40 percent shrub lands. Coniferous forest and shrub lands are among the most preferred habitats for deer (Camel, 2007). It is no surprise then, that 88 percent of animal- vehicle collisions in California involve deer (Shilling et al, 2019). According to studies of CHP accident reports and roadkill sightings, animal strikes cost Californian drivers over 300 million dollars a year (Shilling et al, 2018). When considering strikes that are only reported to insurance companies, this value may actually be closer to 600 million dollars per year. In an effort to prevent and reduce animal-vehicle collisions, many other countries and even states within the US have installed wildlife overpasses with moderate to great success (Bellis, 2008, Clevenger et al, 2001, Cramer, 2008, Gagnon, 2017, Myslajek, 2020). California has not yet intentionally implemented any wildlife overpasses of its own, although there are plans to break ground on an overpass to reconnect Mountain Lion populations in LA county (Meshal, 2020). California represents an opportunity to implement the construction of wildlife overpasses in order to reduce the financial and ecological loss represented by animal-vehicle collisions. The issue at hand then becomes, how to determine where to build wildlife overpass structures to provide the most benefit to humans and animals. A variety of concerns need to be factored into determining where the location of a wildlife overpass should be installed. Since most damage causing accidents involve deer, limiting the species biology and habits to ungulates should provide the most reduction in accidents. Collisions involving deer have the highest likelihood of occurrence at locations where streams cross roadways and where coniferous forests boarder or overhang roads (Camel, 2007). In addition animals use wildlife overpass crossings more when human use of crossings is low (Clevenger, 2000, Myslajek, 2020), an indication that overpasses should be build away from population centers and in locations where human use is unlikely. The probability of strikes increases as the traffic intensity on a road increases (Fahrig et al, 1995). Since 2009 the Road Ecology Center has been collecting CHP and volunteer data on where and when animal-vehicle collisions occur, and what species of animals are impacted. This data will serve as a much needed proof of concept to test models of collision probability. |
|
Methods
All data layers were processed with ArcGIS Pro version 2.6.3, and where specified ArcMap 10.7 (for legacy access DB data). Needed data layers were collected from appropriate government web repositories (see "GIS Data Sources" section of "References"). Metadata was checked for terms and conditions and relevance of data (as close to present as possible). A "Study Boundary" polygon feature class was defined around the Northern Sierra region of interest. All data layers were clipped to this boundary before any additional ArcGIS Pro tools were run. To make a road exclusion buffer around areas of human use, the NGS Land-cover Classifications layer was processed. The layer was transformed into a vector layer allowing multipart polygons and merged by National Land Cover Database (NLCD) classification. Classifications of "Developed, Open Space," "Developed, Low Intensity," "Developed, Medium Intensity," "Developed, High Intensity," "Hay/Pasture," and "Cultivated Crops" were reclassified as "Human Use Zones" and exported into their own feature class. Because roads fall under the classification of developed land, a second polygon feature class layer was made and areas surrounding the "Human Use Zones" were digitized by hand to avoid excluding roads in subsequent analysis. A buffer of one mile was made around this layer using the Buffer tool. The "Major Roads" layer was then run through the "Split Line at Vertices" tool to produce the "Major Roads Split" layer. The buffer layer was used in conjunction with the Erase tool to omit portions of the "Major Roads Split" layer that fell within its boundaries. This new road layer was named "Wild Roads." To obtain a layer of streams in the study area, the CA_Streams_3 layer was modified. The "Select by Attribute" tool was used to select only streams with a value in the "name" field in order to exclude all drainages. The selection was exported and renamed to "Major Streams." To obtain a layer of conifer/evergreen forest in the study area the NGS Land-cover Classifications layer was again utilized. The regions classified as "Evergreen Forest" were selected and exported into a new polygon feature layer. This layer was symbolized with a dark green color with 50% transparency. In order to visualize average daily traffic in the study area the "Major Roads" layer was used in conjunction with Average Annual Daily Traffic (AADT) point data. A point layer was made to contain split points for the road line layer. These split points were hand digitized in between the AADT points, roughly centered. The "Split Line at Points" tool was run to break the major road layers into sections. Then AADT points were spatially joined to the split road layer using the "Closest" match option. A new "AADT" field was added to this new layer, and "Calculate Field" was used to average the values of the AADT point layer table's fields "AADT_ahead" and "AADT_behind" to get one AADT value regardless of travel direction. This layer was symbolized on the new "AADT" field using the quantile method and a yellow to purple color scheme. The final analysis was run using data from the "Wild Roads," "Major Streams," "Evergreen Forest" and "Highway Bridges" point layer. Using the "Select by Location" tool, all sections of "Wild Road" that were intersected by the "Major Streams" layer, were within 175 meters of the "Evergreen Forest" layer and were not within 25 meters of a "Highway Bridges" point were selected. These features were then exported to a new layer of "Potential Overpass Locations." To better orient users to map data, two layers of background data were prepared. The six highest population centers of Plumas county were exported to their own point feature layer. The boundary of the Plumas National forest was obtained from Microsoft Access legacy data from the USDA's data warehouse. This layer was dissolved into one boundary layer in ArcMap as ArcGIS Pro no longer has the capabilities to open and process Microsoft Access databases. Using layouts in ArcGIS Pro, data was organized into four maps. A screenshot was taken of the "Real-time Deer Incidents & Wildlife-Vehicle Conflict (WVC) Hotspots Map" from CROS's website corresponding to the study area. |
|
Results
Figure 1 shows the results of making the buffer layer. Most of the Study Area is not well developed, and most areas do not have large populations. The largest population center in the area is the city of Chico, visible in the dense red area in the lower left portion of the map. Figure 2 shows the results of visualizing the average daily traffic in the region. Priority of building wildlife overpasses should go to regions with a higher daily traffic. Highway 70 running through Portola, Graeagle and Quincy as well as Highway 395 running through the north east area of the map stand out as regions of higher traffic, thus higher collision risk. It must be noted however, that their traffic is exponentially less than what is seen in the lower left of the map (near Chico, Oroville and Paradise). Figure 3 shows the results of putting the three primary selection factors together in one map. Most of the study region is covered in evergreen forest and there are many highway bridges. In the region surrounding Highway 395 in the north eastern portion of the map that there is a distinct boundary of evergreen forest and flatter lands. Figure 4 shows the results of running the selection of road sections based on proximity to evergreen forest, stream crossings and road bridges. It has been superimposed on the highway average traffic layer from Figure 2. Many areas of potential wildlife overpass build zones occur between Quincy and Graeagle along Highway 70, as expected. However there is a lack of potential overpass locations along Highway 395 to the north east. Figure 5 shows the screen shot of a map of reported animal-vehicle collisions from 2015 to 2017 in the study area. There are a large amount of dark red zones indicating 2 or more collisions/mile/year along Higways 70 and 395, as predicted based on the traffic information in Figure 2. The area between Quincy and Graeagle corresponds nicely with the suggested overpass build locations from Figure 4. However, unexpected is the amount of collisions that occurred on Highway 395 that do not correspond to potential overpass build locations in Figure 4. |
|
Figures and Maps
|
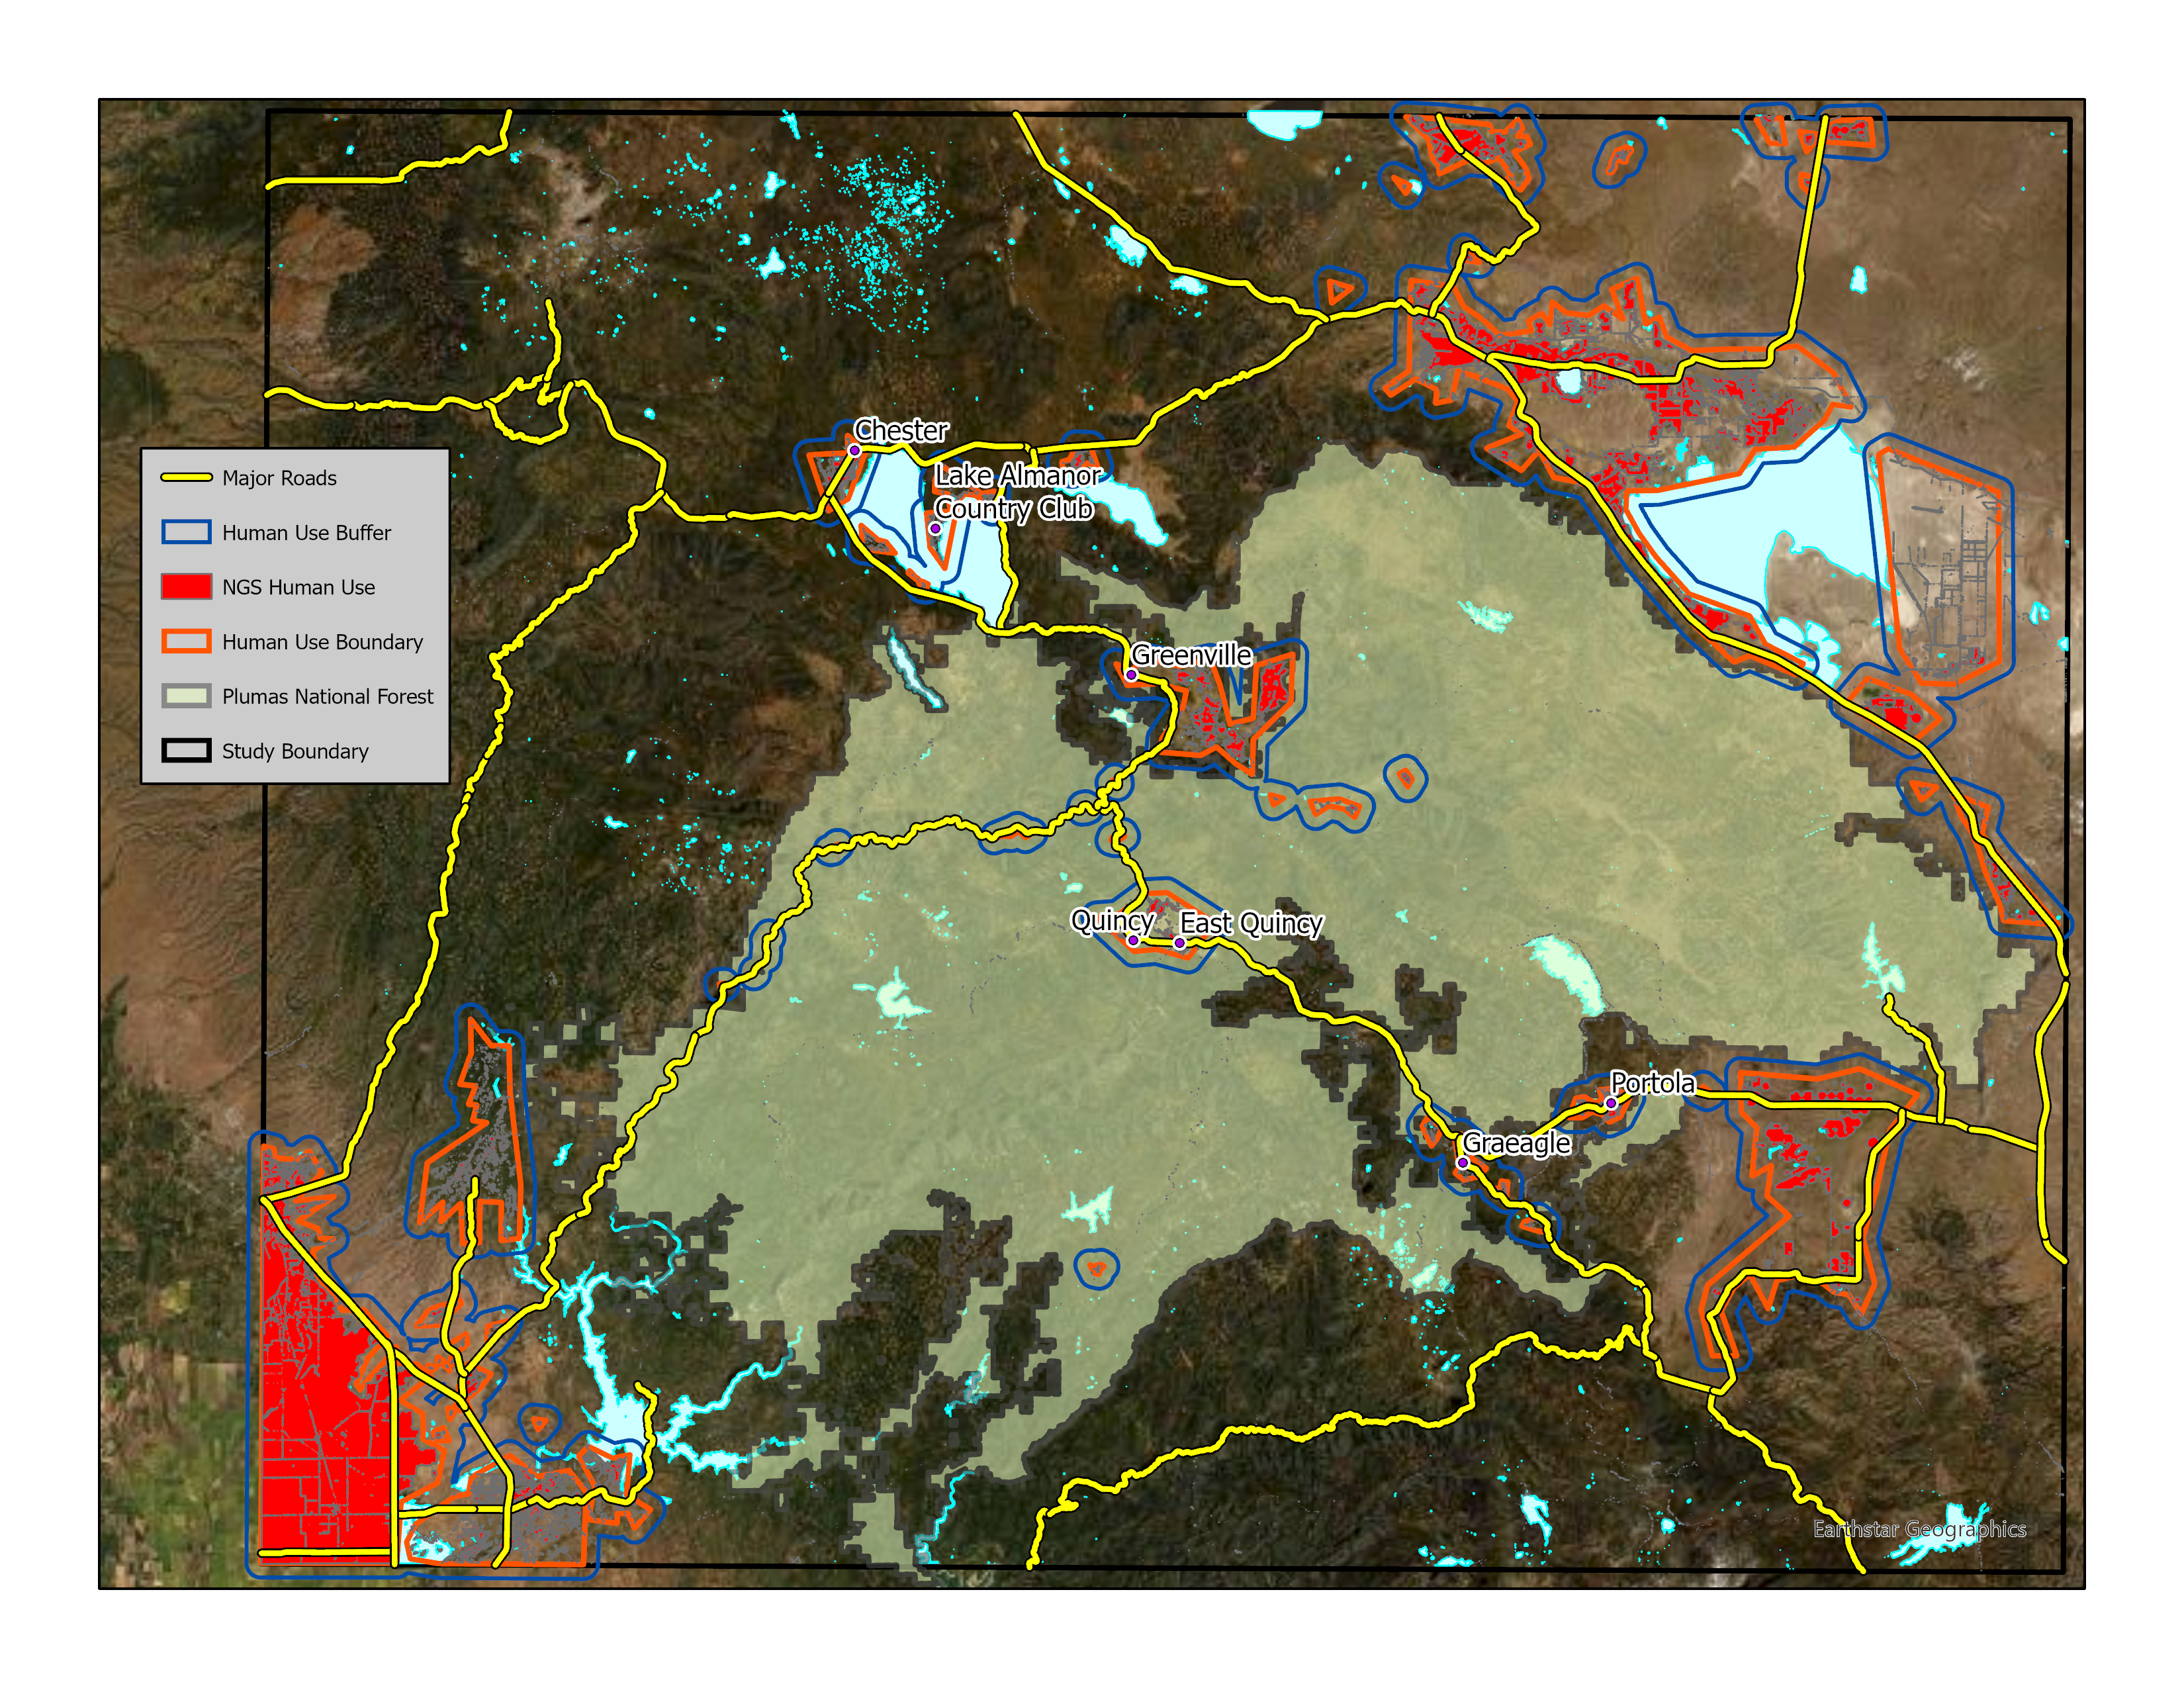 Figure 1. This figure shows a map of the results of making the buffer layer. |
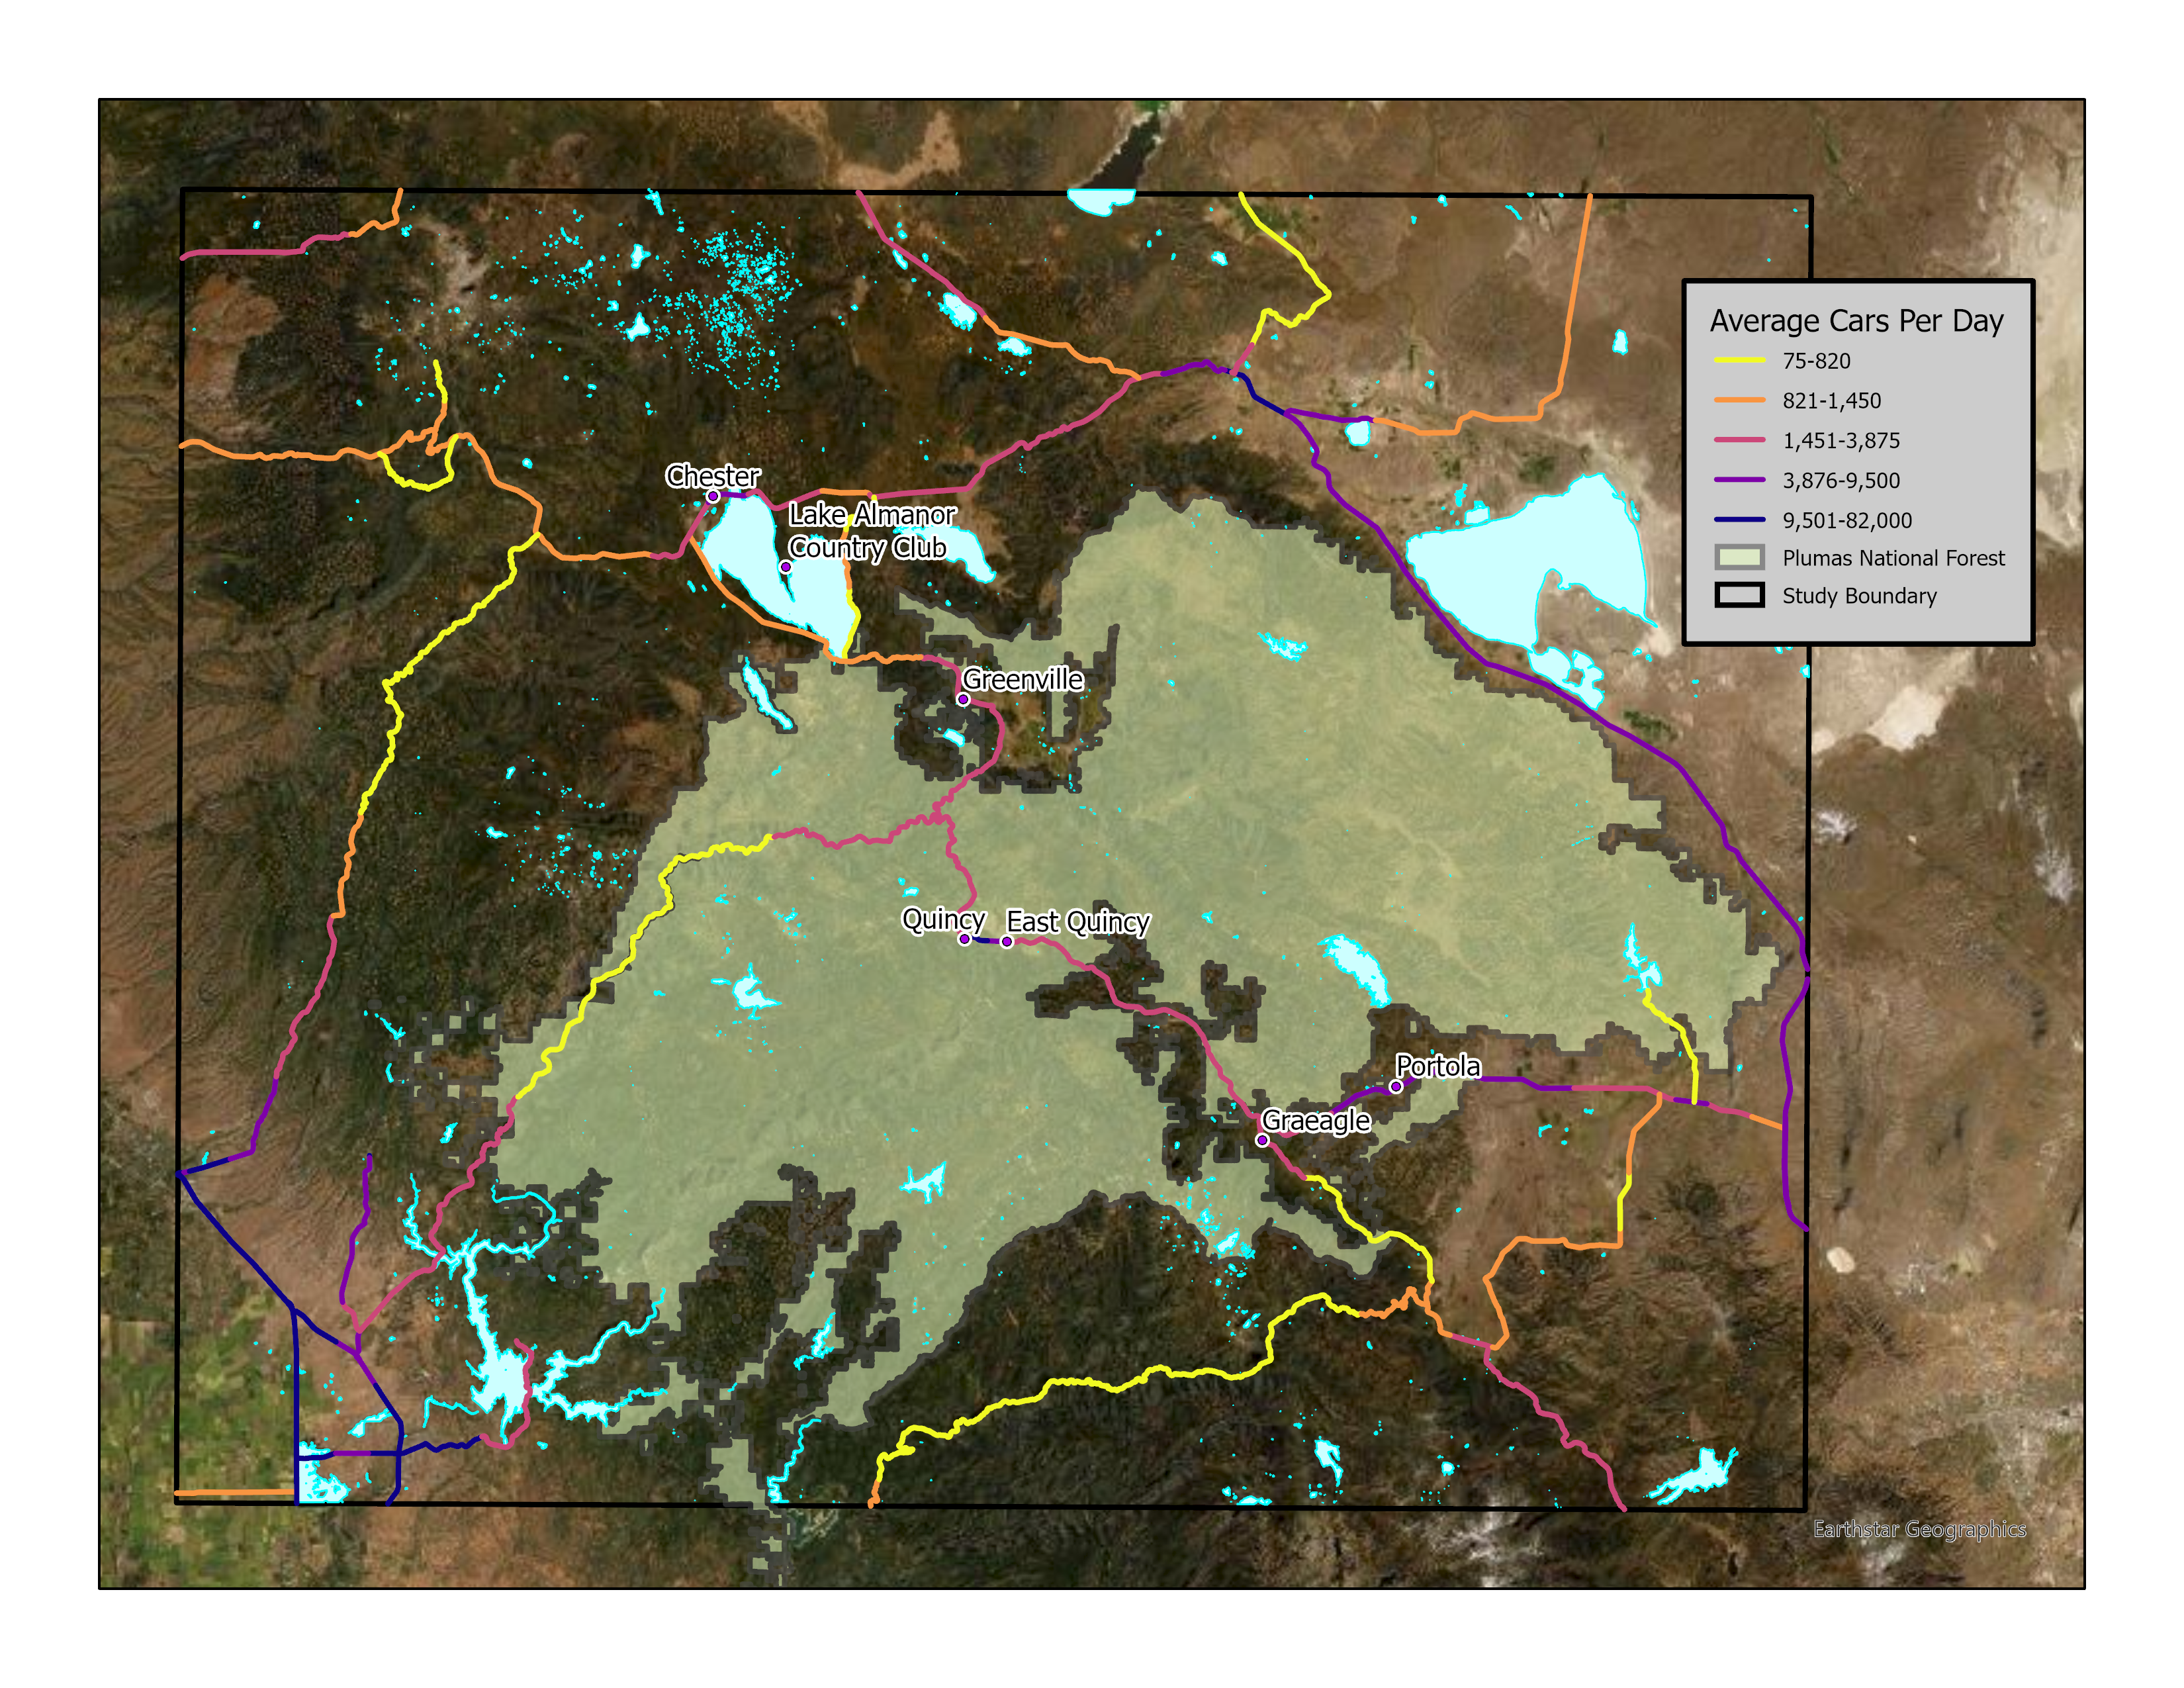 Figure 2.This figure shows a map of the results of visualizing the average daily traffic in the region. |
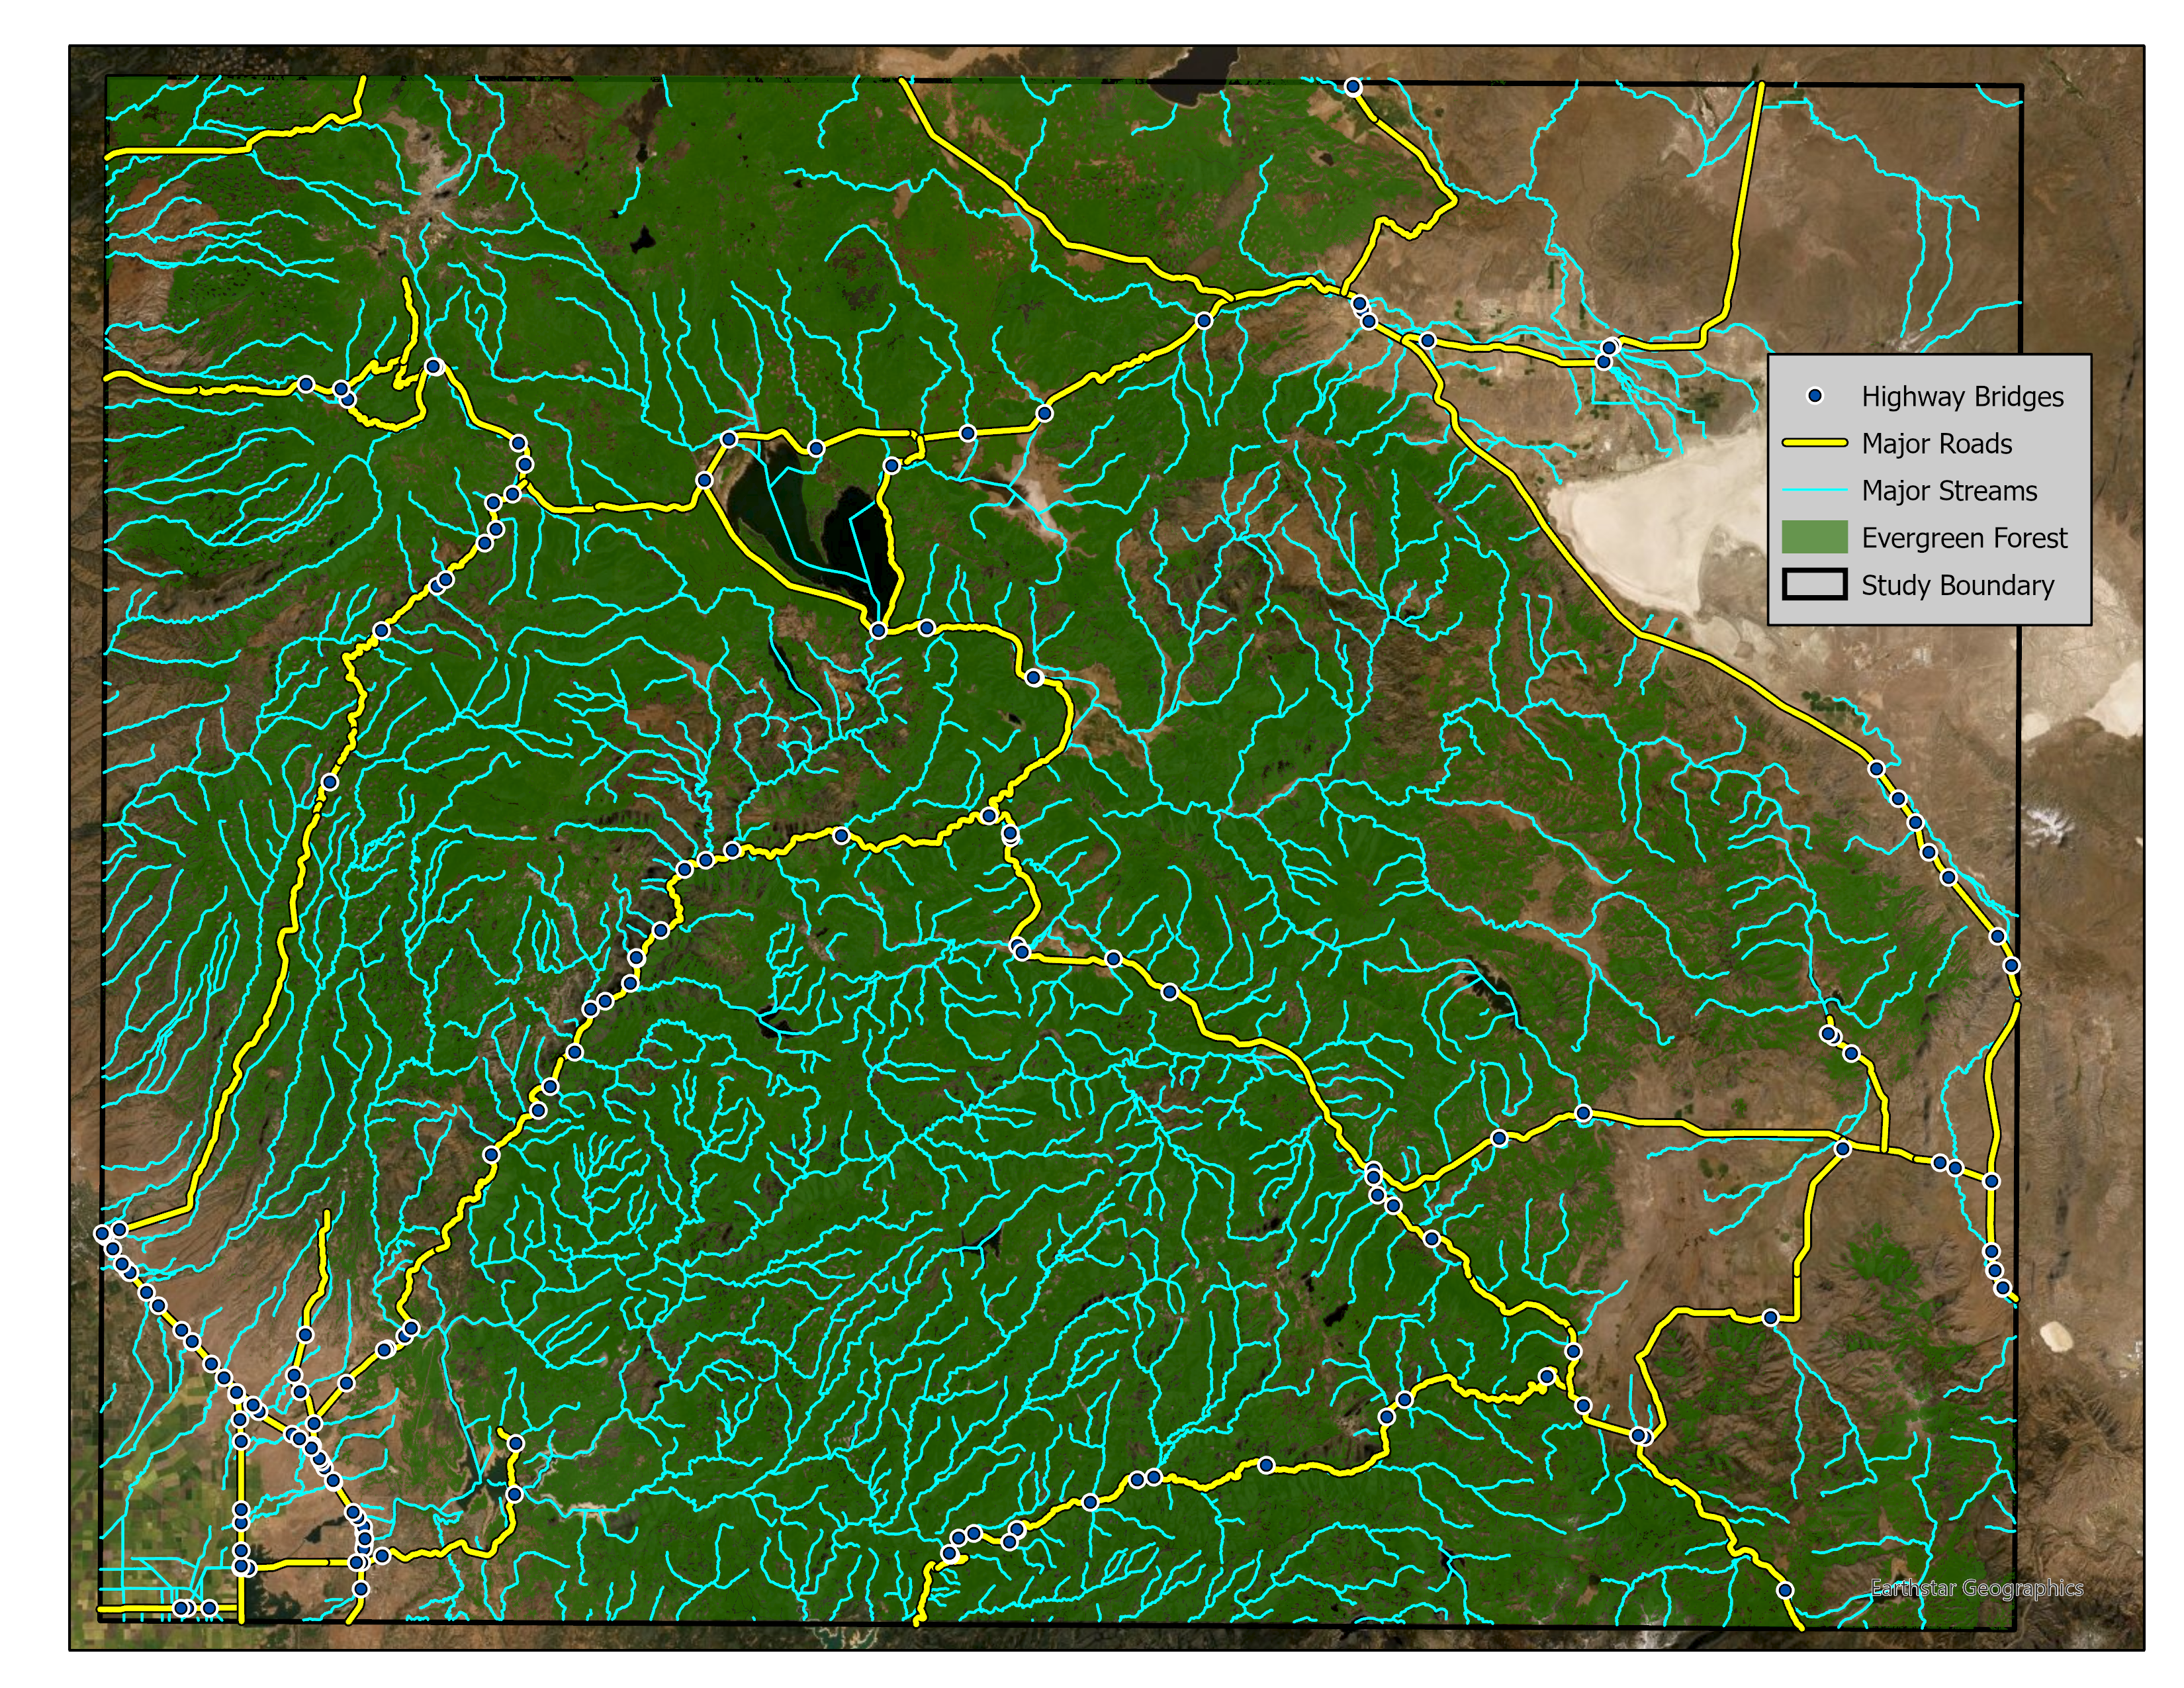 Figure 3.This figure shows the results of putting the three primary selection factors together in one map. |
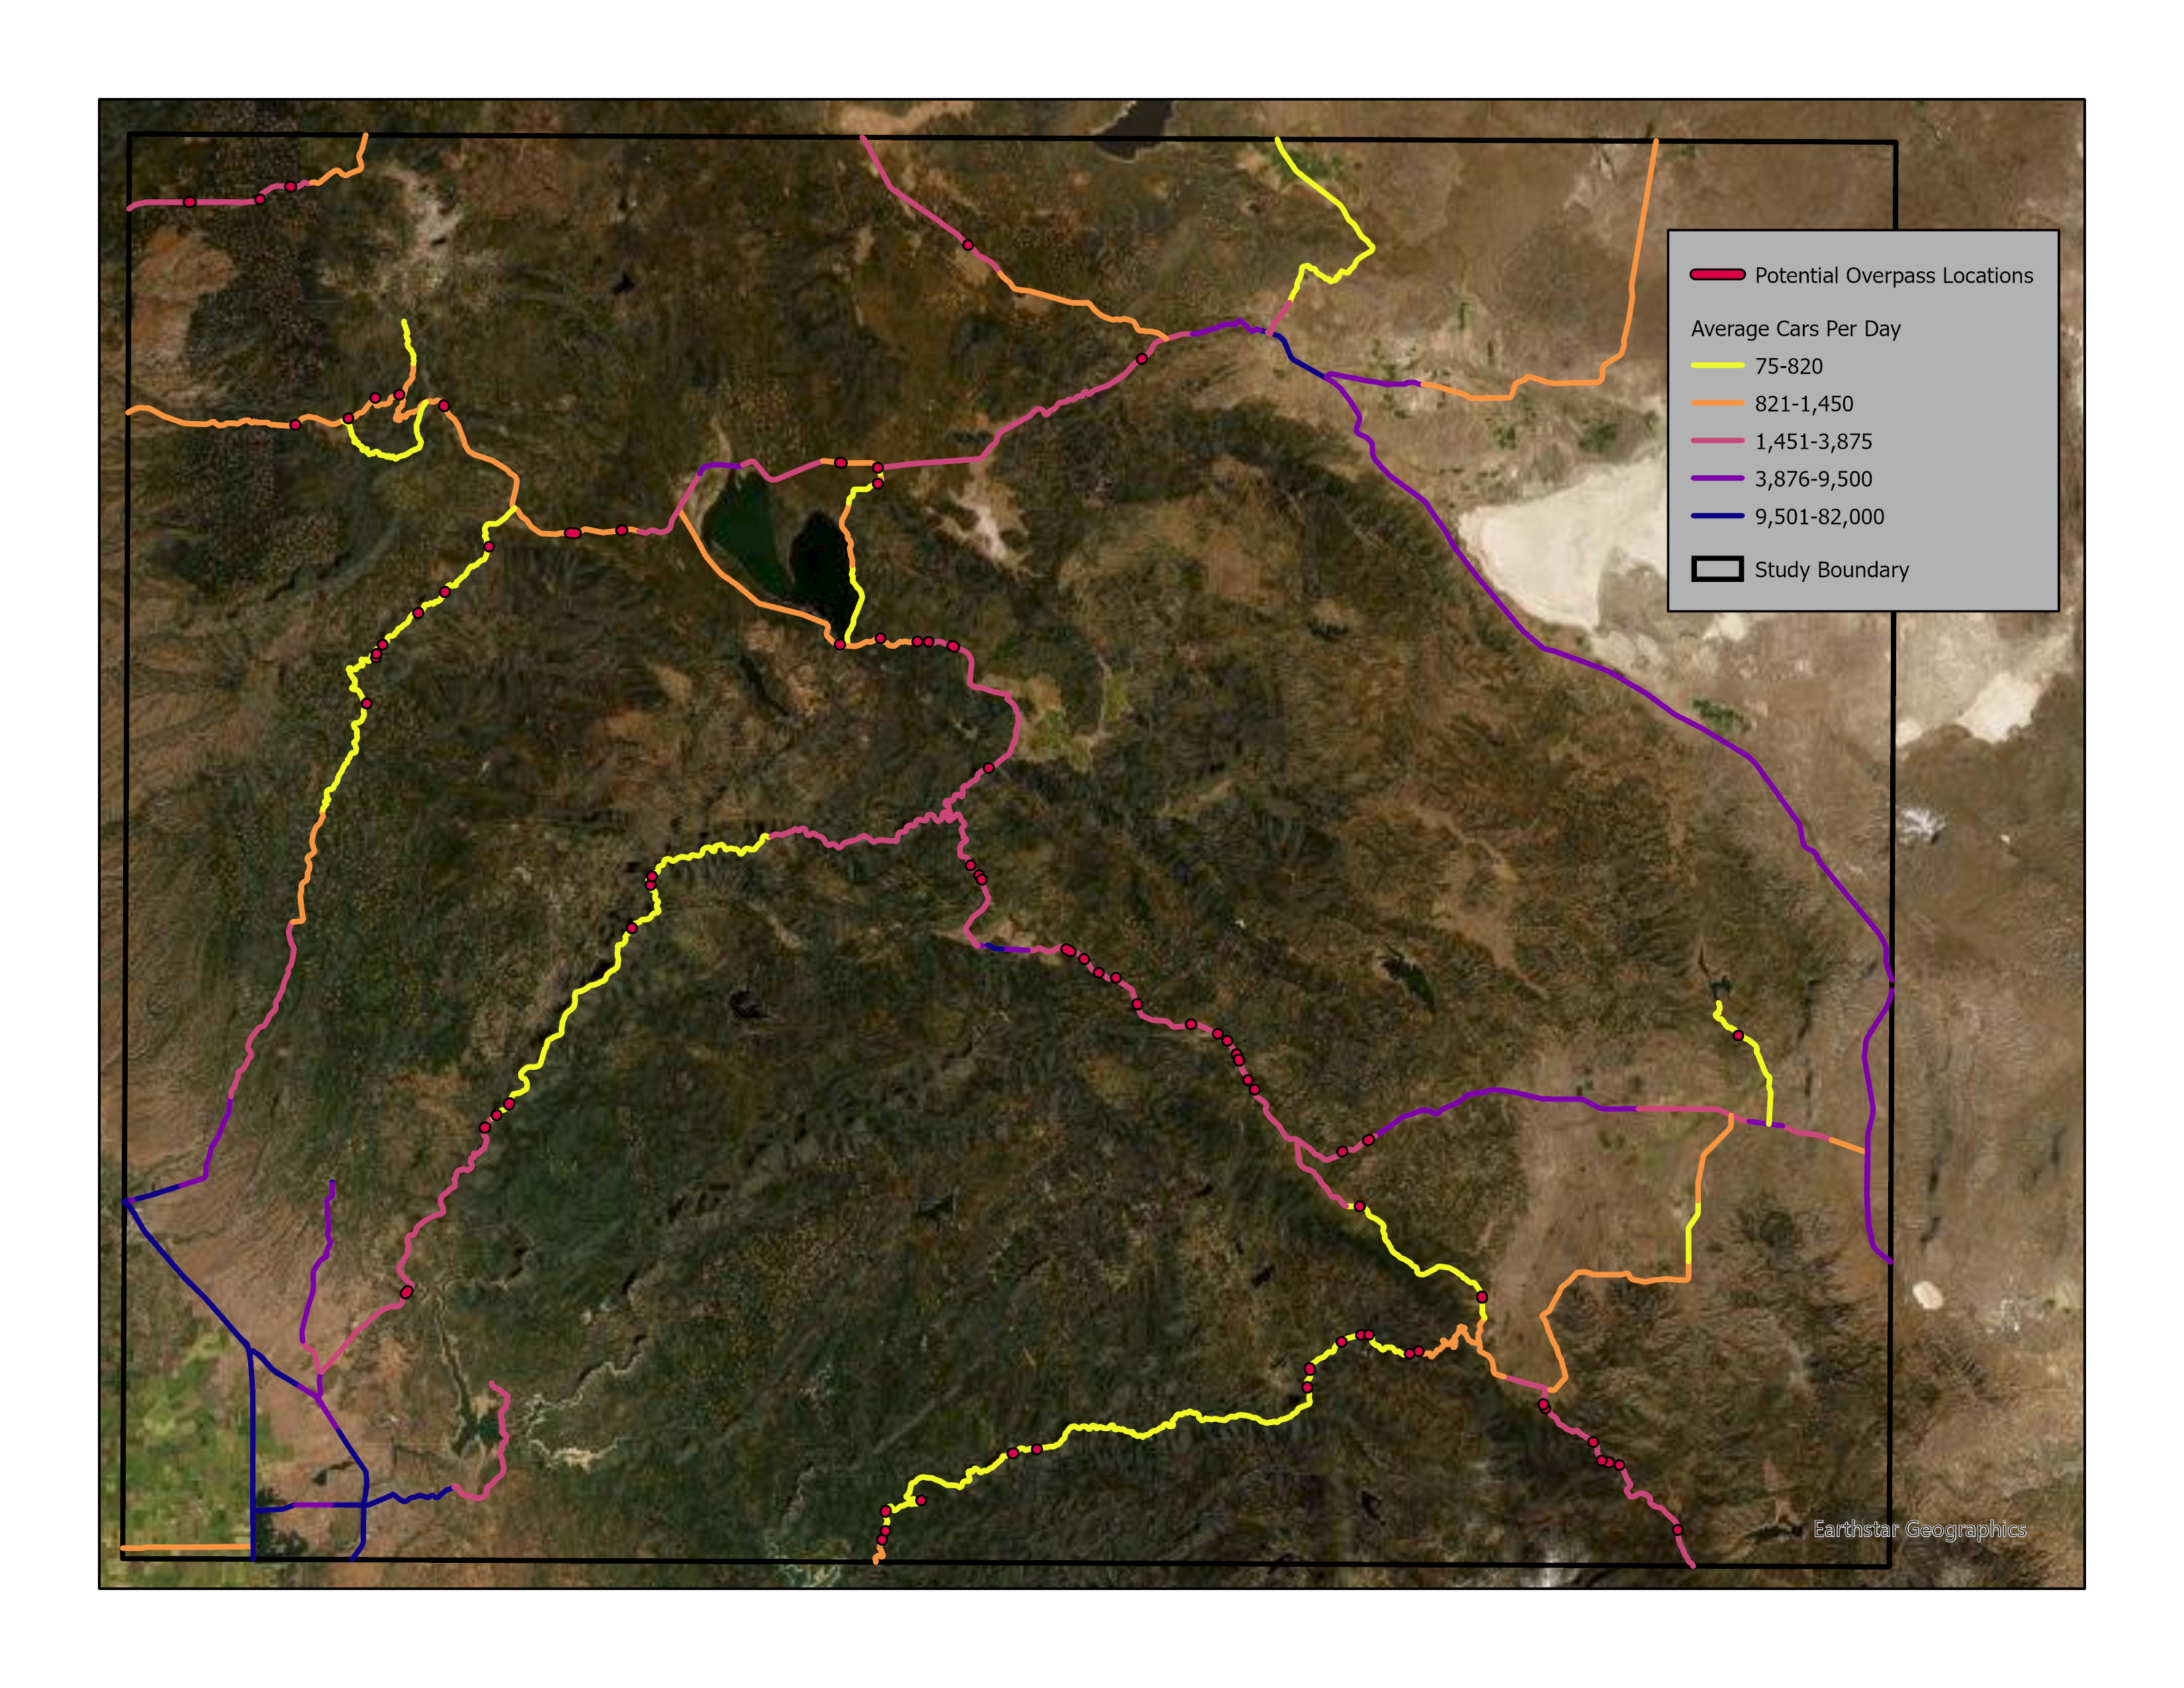 Figure 4.This figure shows the results of selecting Wildlife Overpass build locations based on human use zones, stream crossings, evergreen forest cover and Highway Bridges. |
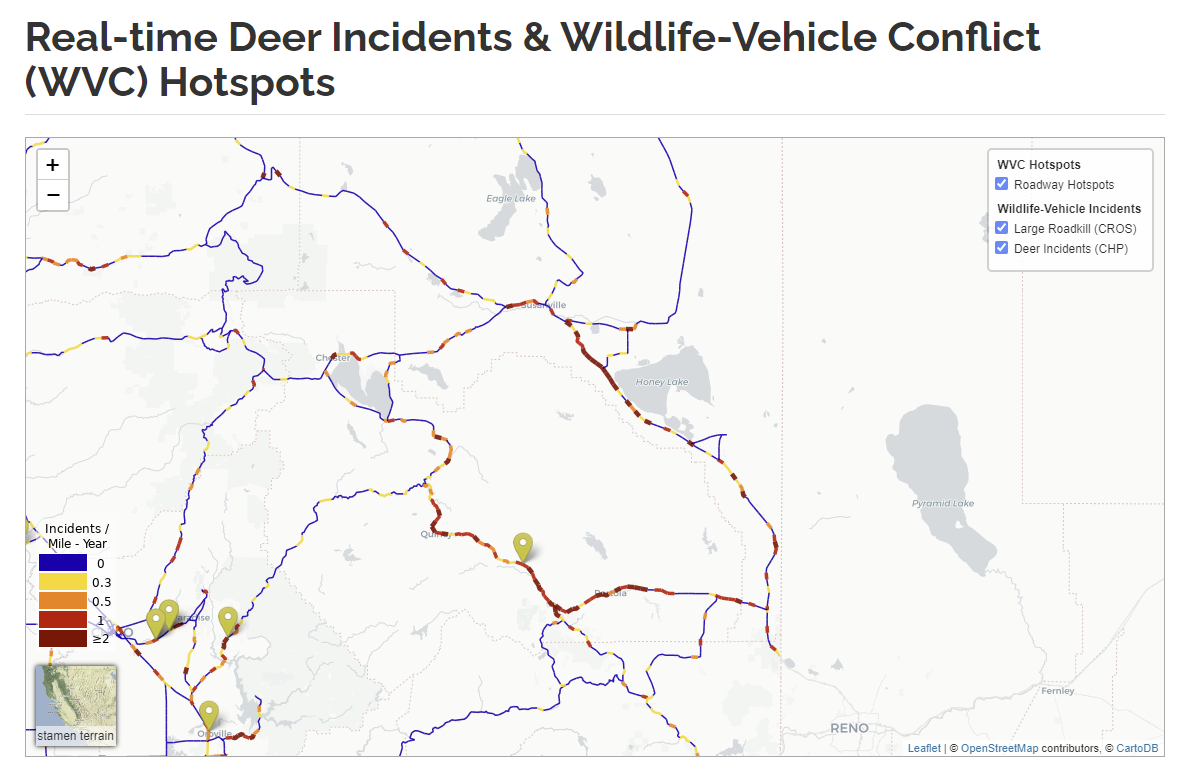 Figure 5.This figure is a screenshot of the "Real-time Deer Incidents & Wildlife-Vehicle Conflict (WVC) Hotspots Map" taken on 12/13/2020 from https://roadecology.ucdavis.edu/hotspots/map. |
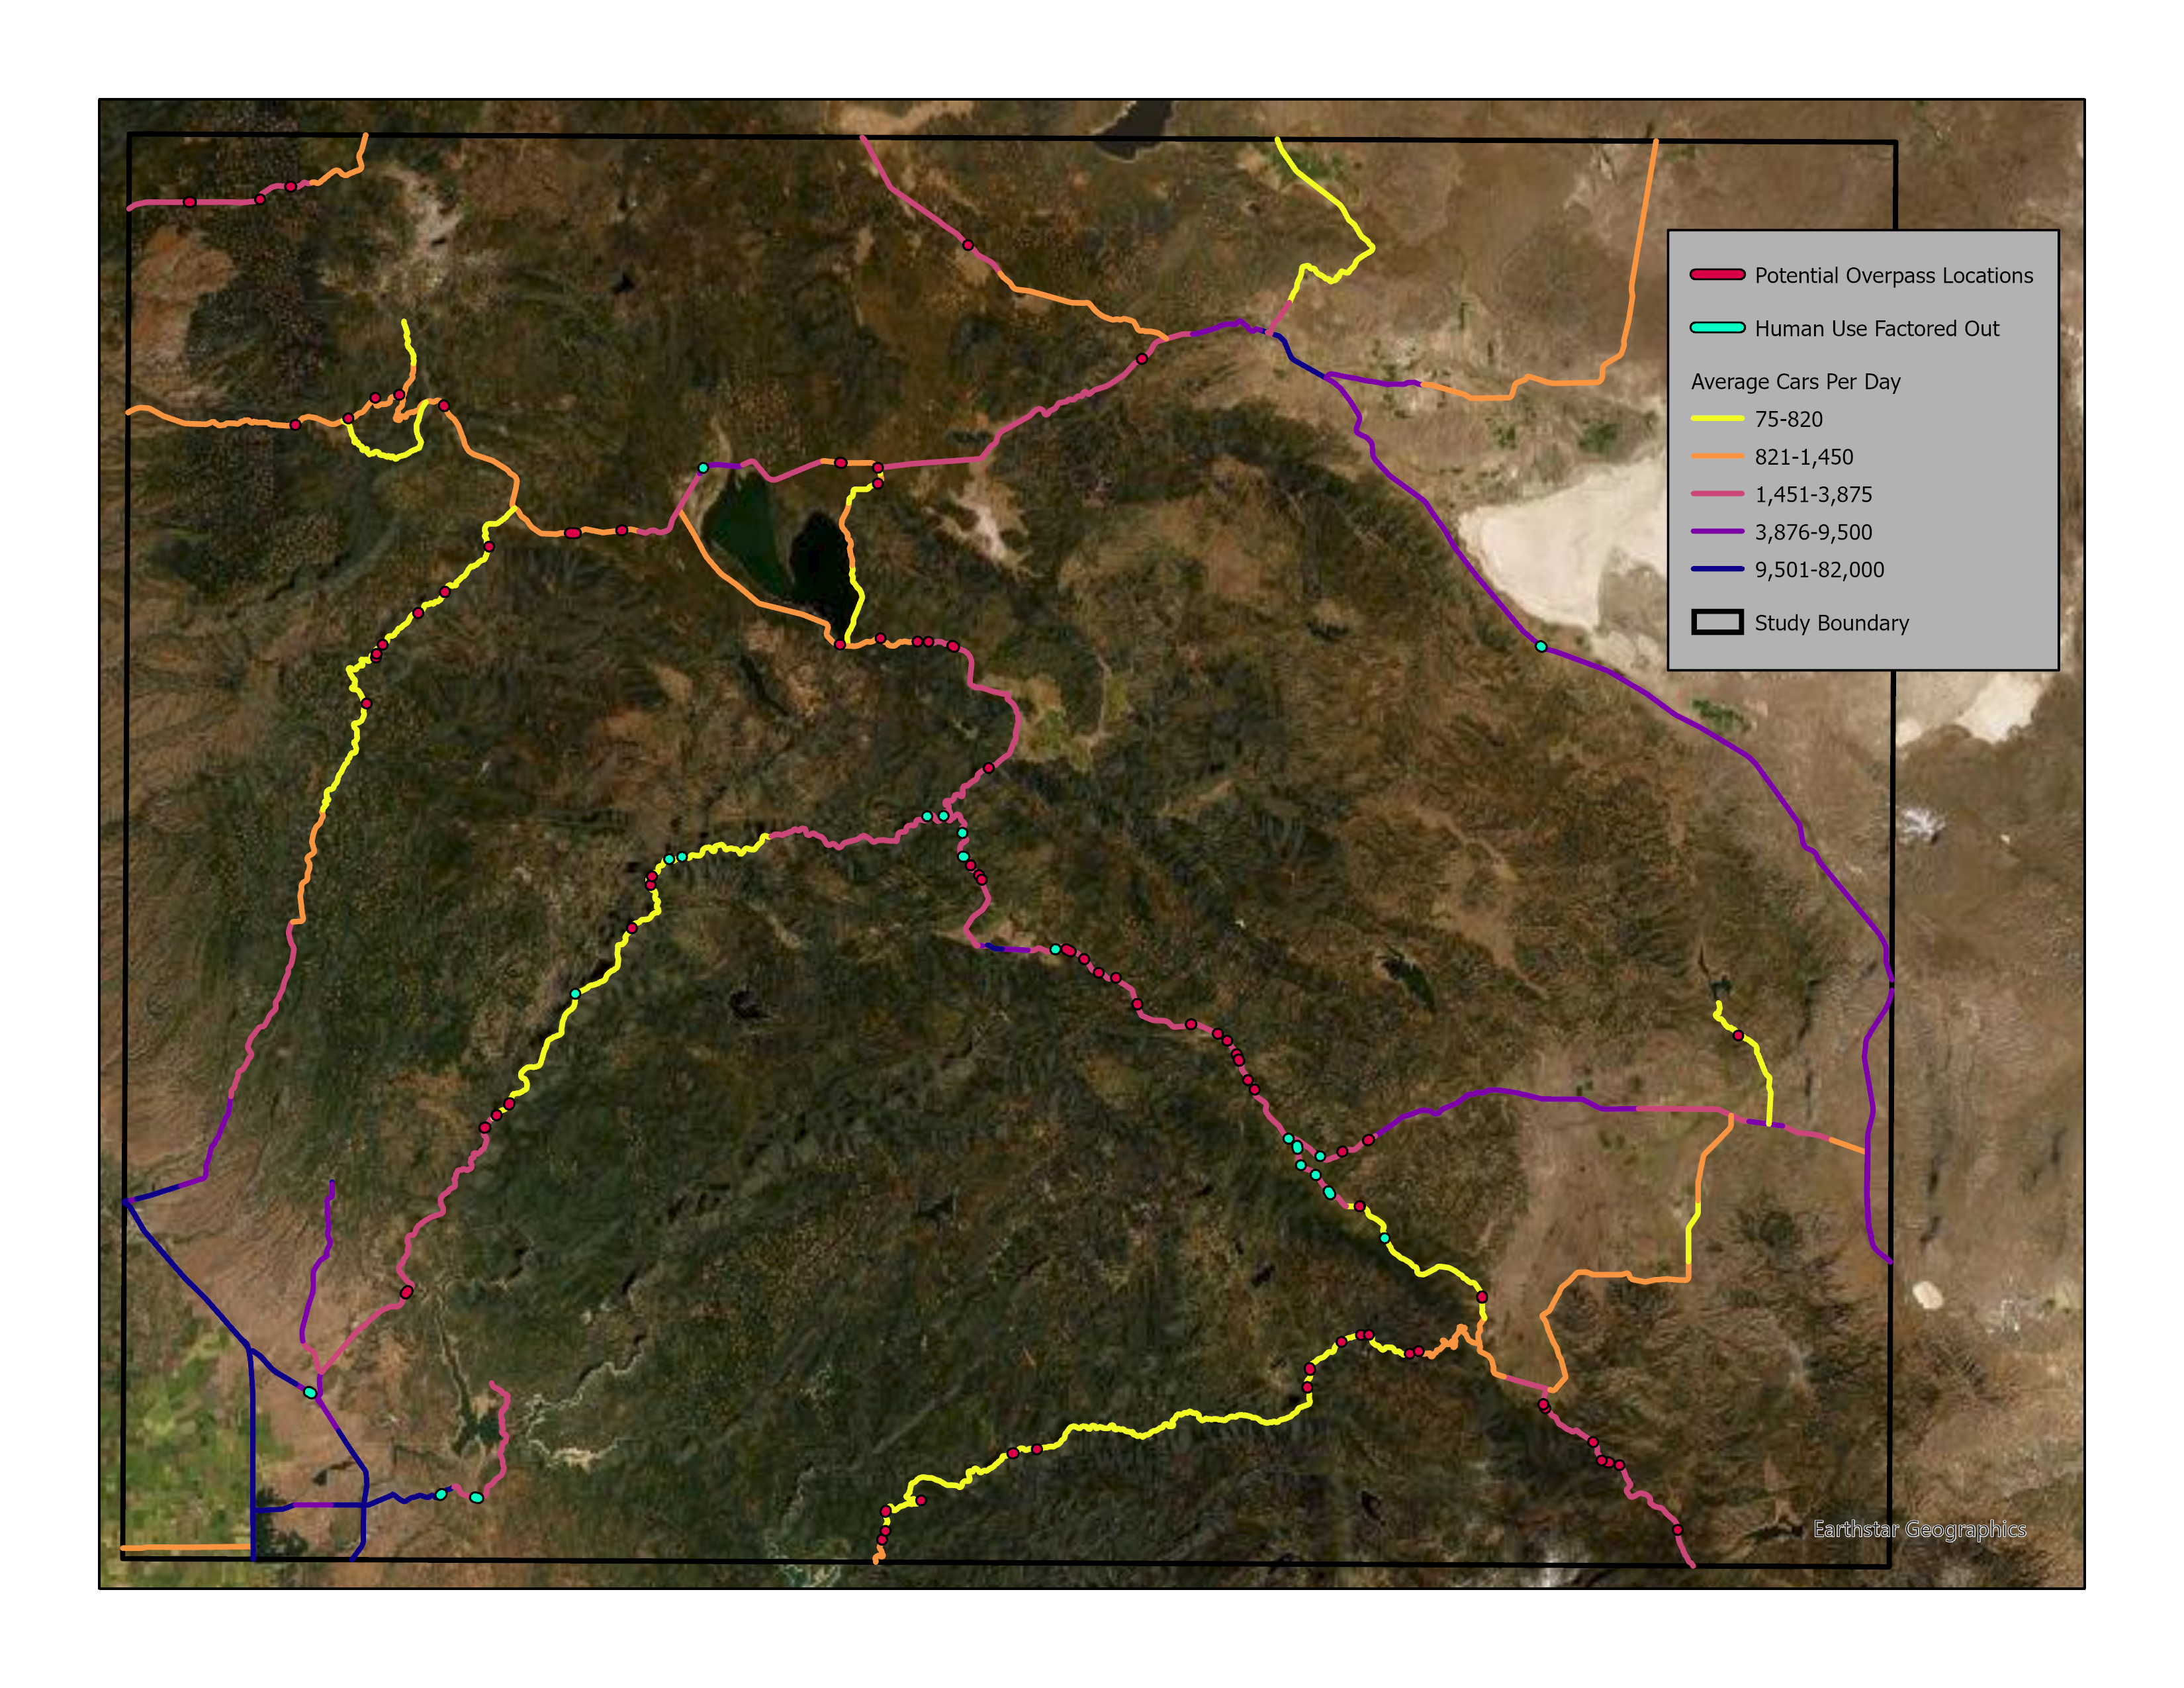 Figure 6.This figure shows the results from Figure 4, however the human use buffer was not used in selecting Wildlife Overpass build locations. The cyan regions in the map represent the new build locations that appear when human use zones are factored out of the selection process. |
|
Analysis
A surprising amount of potential wildlife overpass build locations corresponded to regions of observed high vehicle collision mortality. This was especially visible on Hwy 70 between the towns of Quincy and Graeagle. However, there were no recommended overpass locations on Hwy 395. This is unexpected as the real time collision data shows that this region has the highest mortality in the area, thus the model did not fit. There is some evidence that deer strike potential actually increases in areas that have some human development, but are not fully considered "urbanized" (Camel, 2007). Perhaps this is because of the tendency for drivers to exceed speed limits outside of these more rural population centers (thus decreasing the reaction time to avoid a collision) or because deer congregate to lawns and backyard gardens typical of lightly inhabited areas. By excluding all areas utilized by humans in this region, this trend was not accounted for. When the "Human Use Buffer" was excluded from the analysis (see Figure 6), an increase of potential wildlife overpass locations was observed. This data-set corresponded especially well to the observed mortality centers around the cities of Graeagle and Susanville. However only one suggested build site appeared along Hwy 395, just south of Honey Lake. The suspected reason for this continued discrepancy is the distance the road way is from the evergreen forest layer. This model did not account for the fact that deer travel between forested regions and lowland fields to forage (Camel, 2007). The region north of Hwy 395 is full of fields and flat lands, transitioning back to forest just south of the highway. Perhaps the draw to cross the road in this area further accounts for the higher mortality observed, especially since the highest average traffic in the northern portion of the study area also occurs here. This may also explain the high in town mortality in the city of Quincy, as there is open areas, high traffic and some zones of forest cover. Another interesting trend was that observed collision mortality zones did not seem to decrease in regions that contained highway bridges. It has been shown that unless the areas on either side of road bridges have sufficient habitat connection, animals will not use them as an underpass (Ng et al, 2004). Larger species such as deer and coyotes will not use underpasses that are too small. Perhaps more adjustments to the model could occur if an on the ground survey were to be done at each highway bridge site, ranking the habitat connectivity and size of underpass regions. In addition this could result in discovering locations where a highly utilized animal underpass zone already exists. |
|
Conclusions Utilizing evergreen forest and stream crossing data is an effective way to predict the locations of potential deer strikes in the Northern Sierra region of California. However further research needs to be done on the counter intuitive effect low to moderate human development in rural locations has on deer strike probability. As it appears to increase the odds of deer strikes near human settlements, further research should be done to refine how to use this data to make more accurate predictions. In addition, using highway bridges to aid in the selection of wildlife overpass locations based on the assumption that wildlife could be using them as underpasses needs investigating. On the ground classification of the suitability of these areas as underpass locations should be done before assuming they allow for the suitable movement of animals. Thus they might not be good candidates for limiting the areas overpasses should be built. |
|
GIS Layer Sources Statewide NGS Land-cover Classification Data Sourced from: https://geodesy.noaa.gov/cgi-bin/sf_archive.prl "Major Roads" Layer Sourced from: https://catalog.data.gov/dataset/tiger-line-shapefile-2015-state-california-primary-and-secondary-roads-state-based-shapefile "Major Streams" Layer Derived from CA_Streams_3 sourced from: http://nhd.usgs.gov/gnis.html Traffic Count (AADT) data sourced from: https://gisdata-caltrans.opendata.arcgis.com/datasets/f71f49fb87b3426e9688fe66039170bc_0 Plumas National Forest Boundary sourced from: https://www.fs.usda.gov/detail/r5/landmanagement/gis/?cid=stelprdb5329490 "Highway Bridges" Layer Sourced from: https://gisdata-caltrans.opendata.arcgis.com/datasets/f0f31a540f17414ba384127182f4e088_0 Plumas County Population Centers sourced from: https://plumascounty.us/2192/GIS-Maps-and-Data "Real-time Deer Incidents & Wildlife-Vehicle Conflict (WVC) Hotspots Map" Screen-shot taken on 12/13/2020, from: https://roadecology.ucdavis.edu/hotspots/map |
|
References Bellis, Mark, 2008. Evaluating the Effectiveness of Wildlife Crossing Structures in Southern Vermont. Masters Theses 1911-February 2014. 202. Retrieved from https://scholarworks.umass.edu/theses/202 Blomqvist, D., Pauliny, A., Larsson, M. et al, 2010. Trapped in the extinction vortex? Strong genetic effects in a declining vertebrate population. BMC Evol Biol 10,33 (2010). https://doi.org/10.1186/1471-2148-10-33 Camel, Whisper Rae, 2007. Where Does A Deer Cross A Road? Road and Landcover Characteristics Affecting Deer Crossing and Mortality Across the US 93 Corridor on the Flathead Indian Reservation, Montana. Montana State University. Retrieved from https://scholarworks.montana.edu/xmlui/bitstream/handle/1/1030/CamelW0507.pdf?sequence=1&isAllowed=y Clevenger, Anthony P. and Waltho, Nigel. 2000. Factors Influencing the Effectiveness of Wildlife Underpasses in Banff National Park, Alberta, Canada. Conservation Biology Volume 14, No. 1 Cramer, P., 2013. Design recommendations from five years of wildlife crossing research across Utah. In Proceedings of the 2013 International Conference on Ecology and Transportation. Center for Transportation and the Environment, North Carolina State University, Raleigh. Fahrig, Lenore; Pedlar, John H.; Pope, Shealagh E.; Taylor, Philip D.; Wegner, John F., 1995. Effect of road traffic on amphibian density. Biological Conservation, Volume 73, Issue 3,Pages 177-182. Retrieved from http://www.sciencedirect.com/science/article/pii/000632079400102V Gagnon, J.W., Loberger, C.D., Ogren, K.S., Sprague, S.C., Boe, S.R., Schweinsburg, R.E., & Game, A. 2017. Evaluation of Desert Bighorn Sheep Overpass Effectiveness : U.S. Route 93 Long-Term Monitoring. Arizona Department of Transportation. Retrieved fromhttps://apps.azdot.gov/ADOTLibrary/publications/project_reports/pdf/spr710.pdf Kroll, Gary, 2015. An Environmental History of Roadkill: Road Ecology and the Making of the Permeable Highway. Environmental History 20: 4-28 Myslajek, R.W., Olkowska, E., Wronka-Tomulewicz, M. et al. 2020. Mammal use of wildlife crossing structures along a new motorway in an area recently recolonized by wolves. Eur J Wildl Res 66, 79 https://doi.org/10.1007/s10344-020-01412-y Meshal DeSantis, 2020. National Wildlife Federation Unveils New Look at Landmark California Wildlife Crossing. Retrieved from https://www.nwf.org/Latest-News/Press-Releases/2020/10-21-20-New-Look-at-Wildlife-Crossing Ng, S.J., Dole, J.W., Sauvajot, R.M., Riley, S.P., Valone, T.J. 2004. Use of highway undercrossings by wildlife in southern California. Biol. Conserv., 115 (3), pp. 499-507 Noss, R. 2001. Ecological Effects of Roads. Proceedings from the Managing Roads for Wildlife. Crow's Nest Pass, Alberta. Riley, S. P. D., J. P. Pollinger, R. M. Sauvajot, E. C. York, C. Bromley, T. K. Fuller and R. K. Wayne. 2006. A southern California freeway is a physical and social barrier to gene flow in carnivores. Molecular Ecology 15:1733-1741. Road Ecology Center https://roadecology.ucdavis.edu/about accessed 12/01/2020 Saunders, D.A., Hobbs, R.J., Margules, C.R., 1991. Biological consequences of ecosystem fragmentation: a review. Conservation Biology 5, 18-32 Shilling, Fraser; Denney, Cameron; Waetjen, David; Harrold, Kathryn; Farman, Parisa; Perez, Paola, 2018. Impact of Wildlife-Vehicle Conflict on California Drivers and Animals. UC Davis Road Ecology Center Retrieved from https://roadecology.ucdavis.edu/files/content/news/CA_WVC_Hotspots_2018.pdf Shilling, Fraser; Denney, Cameron; Waetjen, David, 2019. Automated Analysis of Wildlife-Vehicle Conflict Hotspots Using Carcass and Collision Data. UC Davis: Institute of Transportation Studies. Retrieved from https://escholarship.org/uc/item/8h24v43z |