| Title Big Horn Montana Dry and Wet Season Comparison | |
|
Author Jefferson C Rhinehart American River College, Geography 350: Data Acquisition in GIS; Fall 2020 | |
|
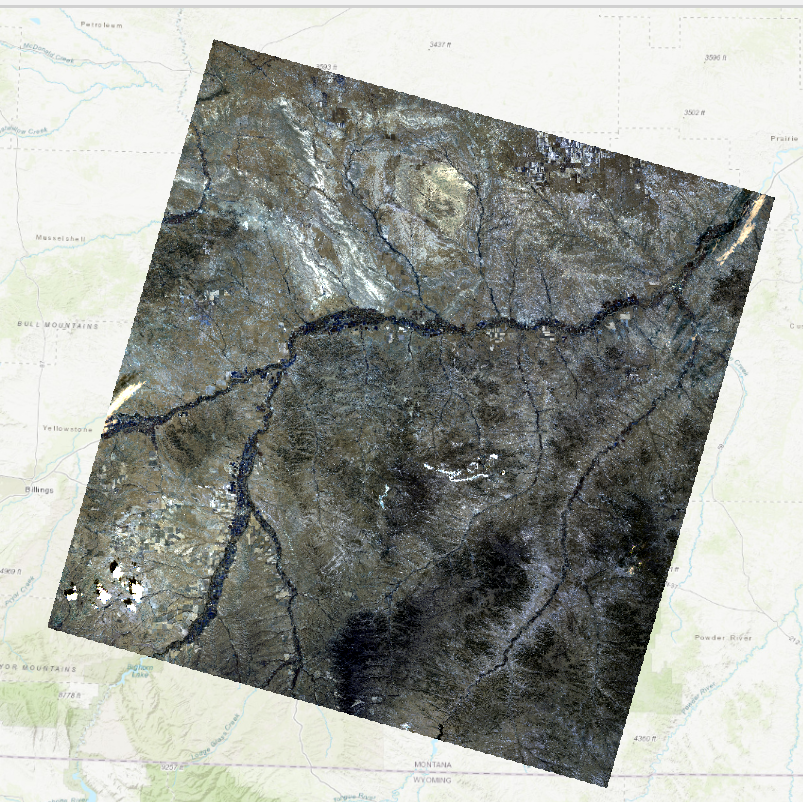
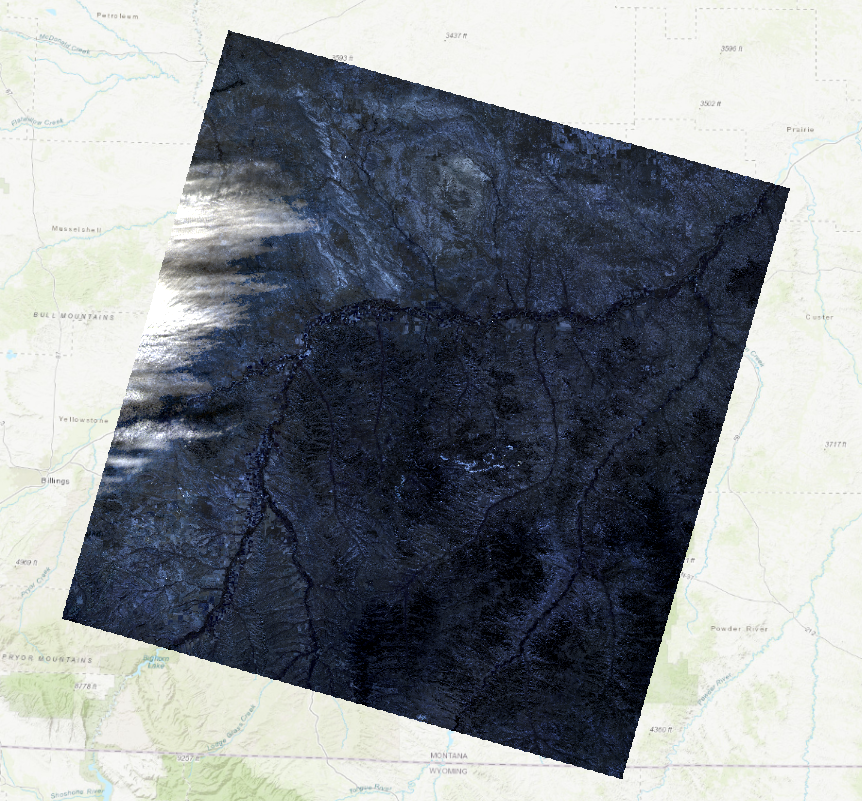
Abstract In this project I compare, with image classification, two Landsat 8 images of Big Horn, Montana land near a river. One image taken in October 2013 and the other July 2013. I wanted to see how much of a difference there was between the landcovers of the dry season and wet season. | |
|
Introduction Montana farm land and grass land surfaces changes dramatically between the wet and dry seasons. This change makes wildfires a much more often occurrence that can destroy hundreds of acres of farm or pasture land. If they spread far enough they could even damage Yellowstone National Park. The dry season also makes farmers have to spend more money on food for cattle. With Image classification I hope to see how much the land surfaces change in between the wet and dry seasons. Using Landsat 8 images of areas in Big Horn county, a large farming and pasture land county, will provide the best results for comparing the different seasons in Montana. | |
|
Background | |
| Montana is a state that is very often plagued with wildfires. Many of these fires have gone through or started in Big Horn county Montana. Having family in Big Horn I have heard many horror stories of farmland, national forests, and even reservations being turned to ash by raging wildfires. These wildfires are often caused by thunderstorms striking areas of dead grass or dry sage. This grass and sage is left over from the wet season of Montana. Depending on how much rain they get in the wet season plays a major impact on how worried farmers have to be about the dry season. In 2017 Montana had its largest wildfire on record since 1910, this being caused by the fact that the wet season before yielded so much rain that Montana was covered with grass and sage. When the dry season came along this grass and sage burned for months destroying approximatlely 438,000 acres. These wildfires impacted 53 of Montanas 56 counties. Using GIS I hope to visualize the change that occurs inbetween these seasons. |
|
|
Methods | |
| I was able to find acceptable images of the Bighorn area using the USGS earth explorer. After finding acceptable images I went through the USGS process of requesting these images and waiting for permission to download. While waiting, I was looking for an appropriate area for cutting and using as the research area. I wanted to use a river valley area with as little farm land around as possible and has some hills with exposed rock. Finding this area was a little tedious due to many farms being placed parallel to Montana rivers. I was able to find an area that had grazing pastures instead of tilled soil for farming, with a good amount of hill and wetlands. Now that I found a good location and was able to download the images I went and immediately exported my preferred research area. With the images cut into the research area I began to segment each image. After the images were segmented I started the classification wizard and began the process of classifying the images. The classes I used; water, barren, shrubland, wetlands, and herbaceous. I used shrubland to represent the pasture land and the shrubland since they are the same agriculture. Herbaceous was used for the areas with thinner plant life and barren was for exposed wrock and truly barren land. It was necessary to do some reclassifying since the barren land was getting mixed with wetland since some barren land is dry wetland and the October image was a bit dark and blue. |
|
|
Results | |
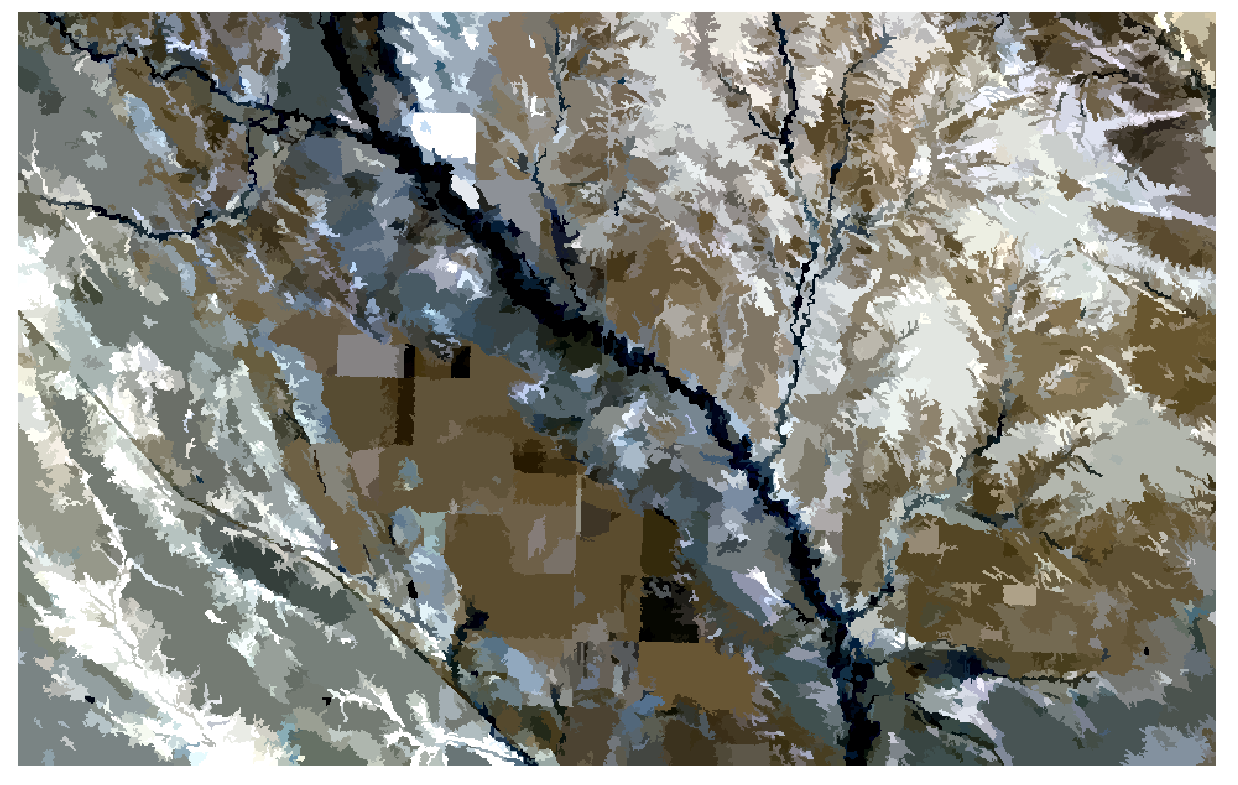
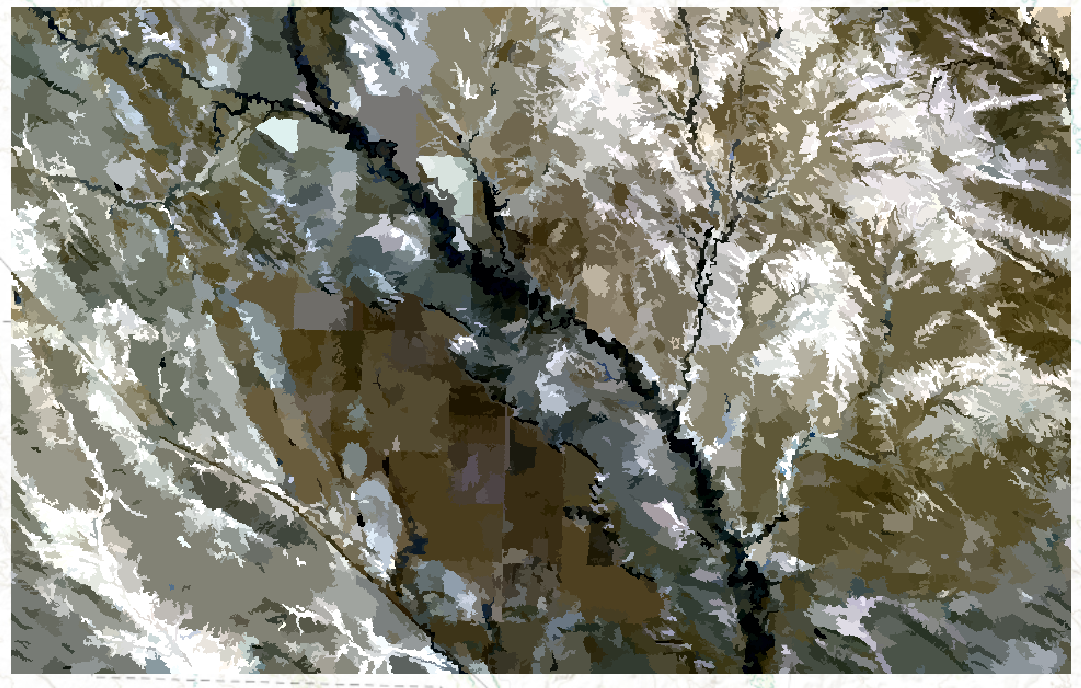
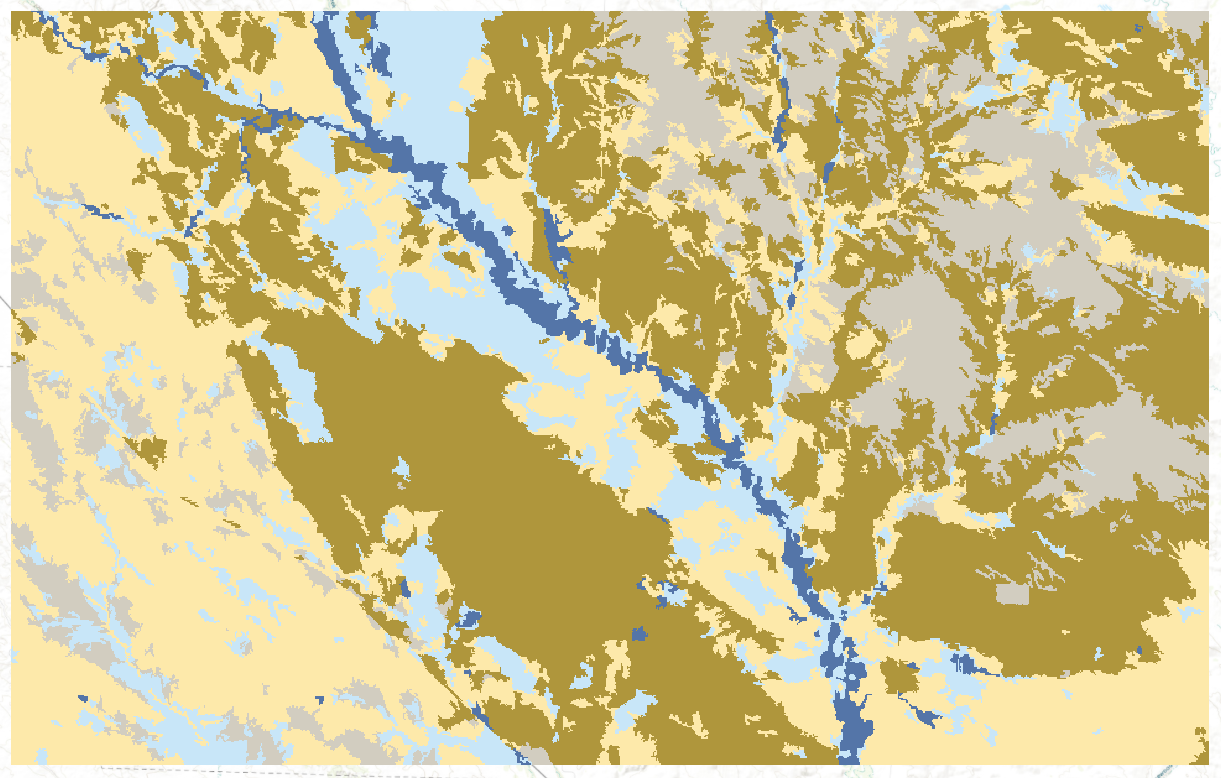
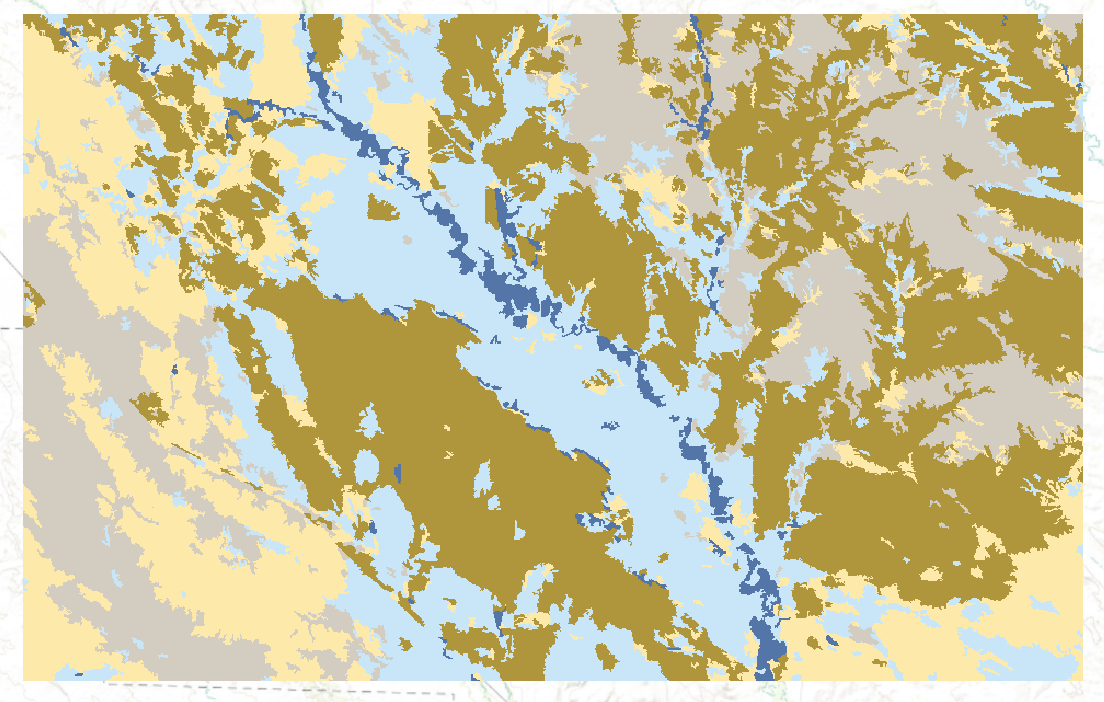
| I was able to succesfully classify these two images to my specified classes. The July image clearly showing less wetland but has more Shrubland and Herbaceuos land. While on the other hand October has much more wetland but also more barren land. |
 |
|
Analysis The increase of shrubland and herbaceous land for the July image is likely caused by a previously heavy wet season but also caused by the shrinking wetlands in the dry season. With the arrival of the dry season causing plants to dry out it will also cause the river to shrink making more land for grass and sage to pop up. Though this grass and sage wouldn't have the same concern of drying out and becoming a fire starter with the river being so close these plants are most likely going to survive dry season. The October image has a major increase in both wetland and barren land. The wet land increase is obviously due to rain increasing the river level in the valley. While the barren land can be a combination of the previous plants having died off by then and its to early in the wet season for them to have grown back already but as well heavy rains getting rid of the rest of the loose dead sage. | |
|
Conclusions The results of the image classification were about what I had expected to find with some surprises. I had some errors in my classification that weren’t fixable mostly due to the darkness of the October image made the classifier think that some river was wetland due to it being frozen. The October image shows a decrease in herbaceous land on the hills compared to the July image. This is not a bizarre phenomenon for the same reason as the loss of shrubland land but the amount shown is much too high to believe. If I were to do this task again I would look for higher resolution imagery and with multiple years instead of just one year. | |
|
References 1. Dana, Rogge. (January 24, 2018) " A Million Acres Scorched by Montana Wildfires" Article 2. The Big Horn County Images Earth Explorer | |