King Fire Burn Area
Christopher Scott
w1759113apps.losrios.edu
American River College, Geography
350: Data Acquisition in GIS, Fall 2020
Abstract
The King
Fire started September 13, 2014 and burned almost 100,000 arces of forest. The
cause of the fire was arson. It was set at the bottom of Forebay Rd on King of
the Mountain Rd. in Pollock Pines, California. Due to the dry conditions and
the bark beetle infestation the fire spread very quickly and became the 2nd
largest fire in California at that time. My intention was to create maps that
can show the health of the burn area by running Band Arithmetic on satellite
images.
Introduction
The purpose of this project is to show how satellite imagery
can be manipulated in ArcGis Pro to display and transform color bands to make
vegetation features stand out for analysis of forest growth. I chose this
subject because I live very close to the area this affected. The images will
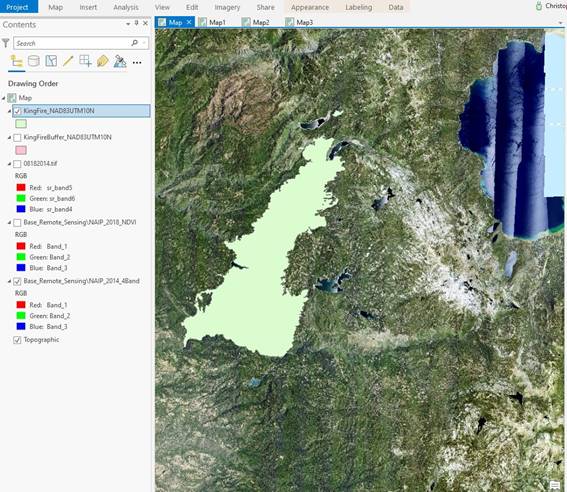
show the burn area before, during and after the fire. For reference I’ve
included a map of the fire perimeter represented by the polygon shown below.
Background
The fire burned
northeast up the American River Canyon and at one point came up to Highway 50
in Pollock Pines which caused evacuations.
5 days after the fire was started a man was arrested on suspicion of
starting the fire. Selfie video of him starting the fire was found on a cell
phone. 2 years later he pleaded guilty to the charges and went to jail. The
fire was contained by October 10, 2014. The rains came and he weather helped
firefighters get it under control. King
Fire
Methods
I obtained 7
Band Landsat8 imagery in Geotiff format for the burn area from Earth
Explorer. The imagery is from 8/18/2014, 9/19/2014, 10/21/2014 and
9/17/2019. The images below represent those dates from left to right.
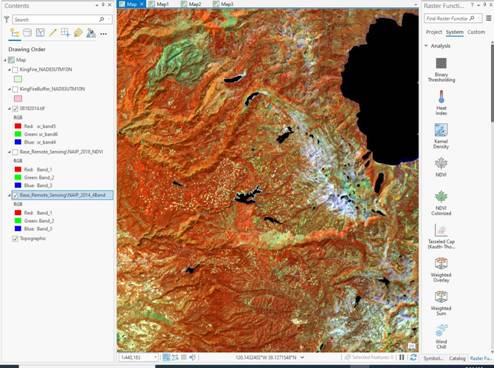
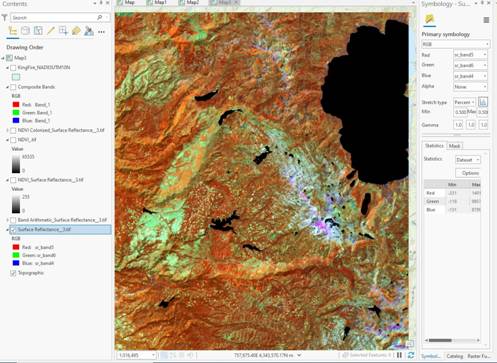
To achieve the image transformation I first added the images to the folder connection and added them to the Geodatabase. The images were added as a feature layers processed through Band Arithmetic using the Ratio Vegetation Index of B5/B4. The Colorized NDVI tool was used to normalize the different reflective materials.
The symbology of the color bands were changed to:
Red Color Display – Band 5
Green Color Display – Band 6
Blue Color Display – Band 4
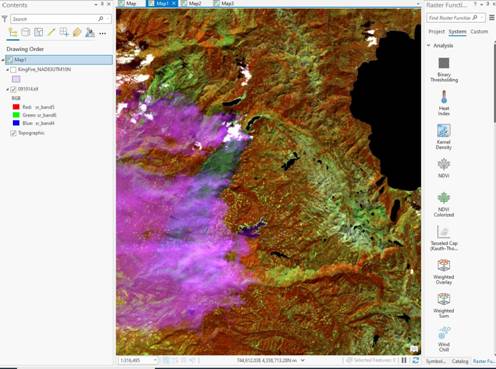
Although counter intuitive it changes the image to show vegetation as not healthy or dead (green) and healthy (orange). The smoke or snow came out with a purple tint. The blue/gray is usually rock outcroppings. In each of the images shown above you can see the progression of the damage done by the fire and the new growth after the fire.
Results
Changing the color bands gave the desired transformation to show both healthy, the burned and some regrowth of the forest. 2 years of above average rain along with logging and replanting is helping with bring the forest back.
Analysis
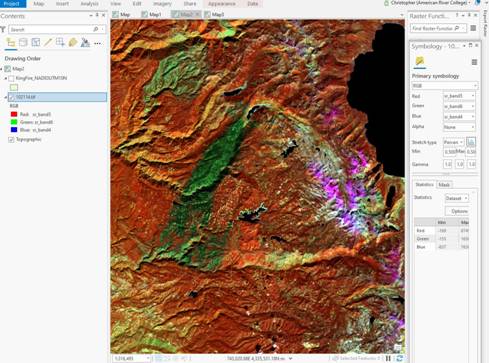
What we can see in the imagery after the band transformations is that one month before the fire the forest look fairly healthy. There are spots of damage indicated by the green shading that show stress from drought and bark beetle damage. During and immediately after the fire the dark green clearly shows the burned scar area. 4 years later we can see that the abundance of precipitation and some reforestation the burned area is coming back to life, indicated by the lighter green shading.
Conclusion
The band transformations run on these images presented a high level overview of the health of the King Fire burn scar. After processing I realized that I could have went a step further and run the imagery through a supervised classification to break down the different kinds of plants, grasses and trees. Processing these images in this manner can be is a helpful tool for all those involved to properly manage the forest growth and conditions.
References/Citations
Satelite Images: Earth Explorer, https://earthexplorer.usgs.gov/
Fire Perimeter Layers: Forest Service, https://data.fs.usda.gov/geodata
General Fire Information: Wildfire Today, https://wildfiretoday.com/2014/09/14/california-king-fire-near-pollock-pines/