Is there any relationship between population density and number of COVID-19 cases? | |
|
Ali Talakoob w1794141@apps.losrios.edu American River College, Geography 350: Data Acquisition in GIS; Fall 2020 | |
AbstractFrom ISO’s perspective, this project’s focus is on Human Health and Disease, and Society. And its goal is to investigate the possible relationship between the population density and the COVID-19 cases/deaths statistics throughout the state of California utilizing in county-level using ESRI products, including ArcGIS Pro.
| |
IntroductionIn all different types of GIS projects, studying demographics data, and utilizing its concepts has always had a crucial role. Due to the COVID-19’spandemic in our today’s world, a major aspect of endeavors by GIS specialists are focused on the COVID-19 topic and finding ways to find, control, and predict its patterns, so its spread can be controlled and hopefully, be diminished in near future. That is why this project is designed to utilize GIS software and its concepts in order to find out if there is any possible relationship between the population density in counties and the number of COVID-19 cases/deaths.
| |
BackgroundAfter finding the first case of novel COVID-19 throughout the world and in California on Jan 25th, 2020, a great number of efforts by scientists, professionals, and organizations has been done to address this issue. Among all the attempts, the COVID-19 dashboard by John Hopkins University is one of the best GIS-based solutions. The main goal of this Dashboard to provide public access to COVID-19 demographical data. After reading two articles regarding the possible relationship between population density and COVID-19 cases, I faced with two different perspectives. The first one is from John Hopkins University that indicates that the urban density is not linked to the higher Infection rates. The other study from PubMed Central implies the population density as one of the indicators in the number of COVID-19 cases in Algeria. The aforementioned studies made me interested in working in order to find which one of these ideas can work for our case study (The State of California). 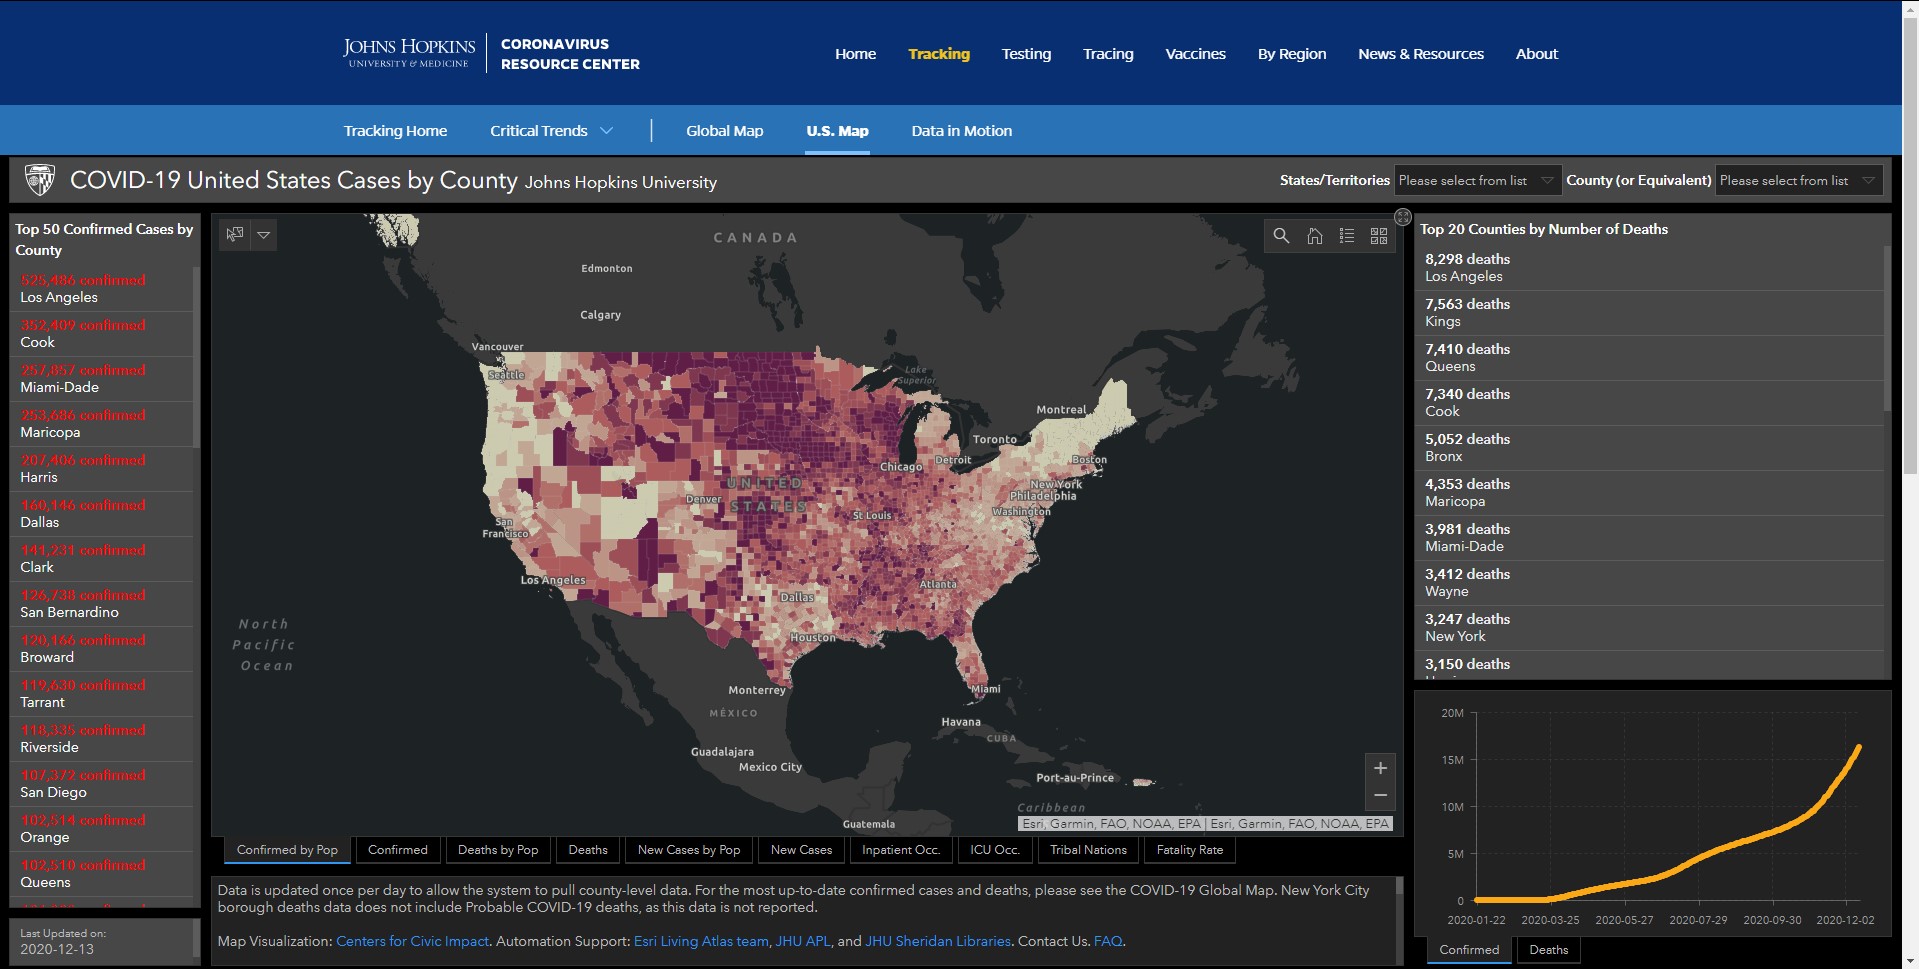
| |
MethodsFor this project, there are three different datasets are used for this project. In order to add demography data to the project, the “USA_Counties_Generalized” is downloaded from the ESRI database. To show the population density, the data are normalized in the symbology section using the “Population (2017)” in the field section and “Shape Area” in the normalization section. Next, the COVID-19 Statistics which is designed in excel format and includes county-level statistics. And is downloaded from California Open Data Portal. Since this dataset was complex, and it includes all the California COVID-19 data since Winter 2019, I filter them down to show the current day prior to submission of this project. Besides, in order to make the dataset ready to upload into ArcGIS Pro, two new fields “Latitude” and “Longitude” is added that contains the location data of California Counties. After importing the aforementioned dataset, is symbolized based on the number of cases. Then, a duplicate of the layer was made and symbolized to show the death statistics among California Counties. 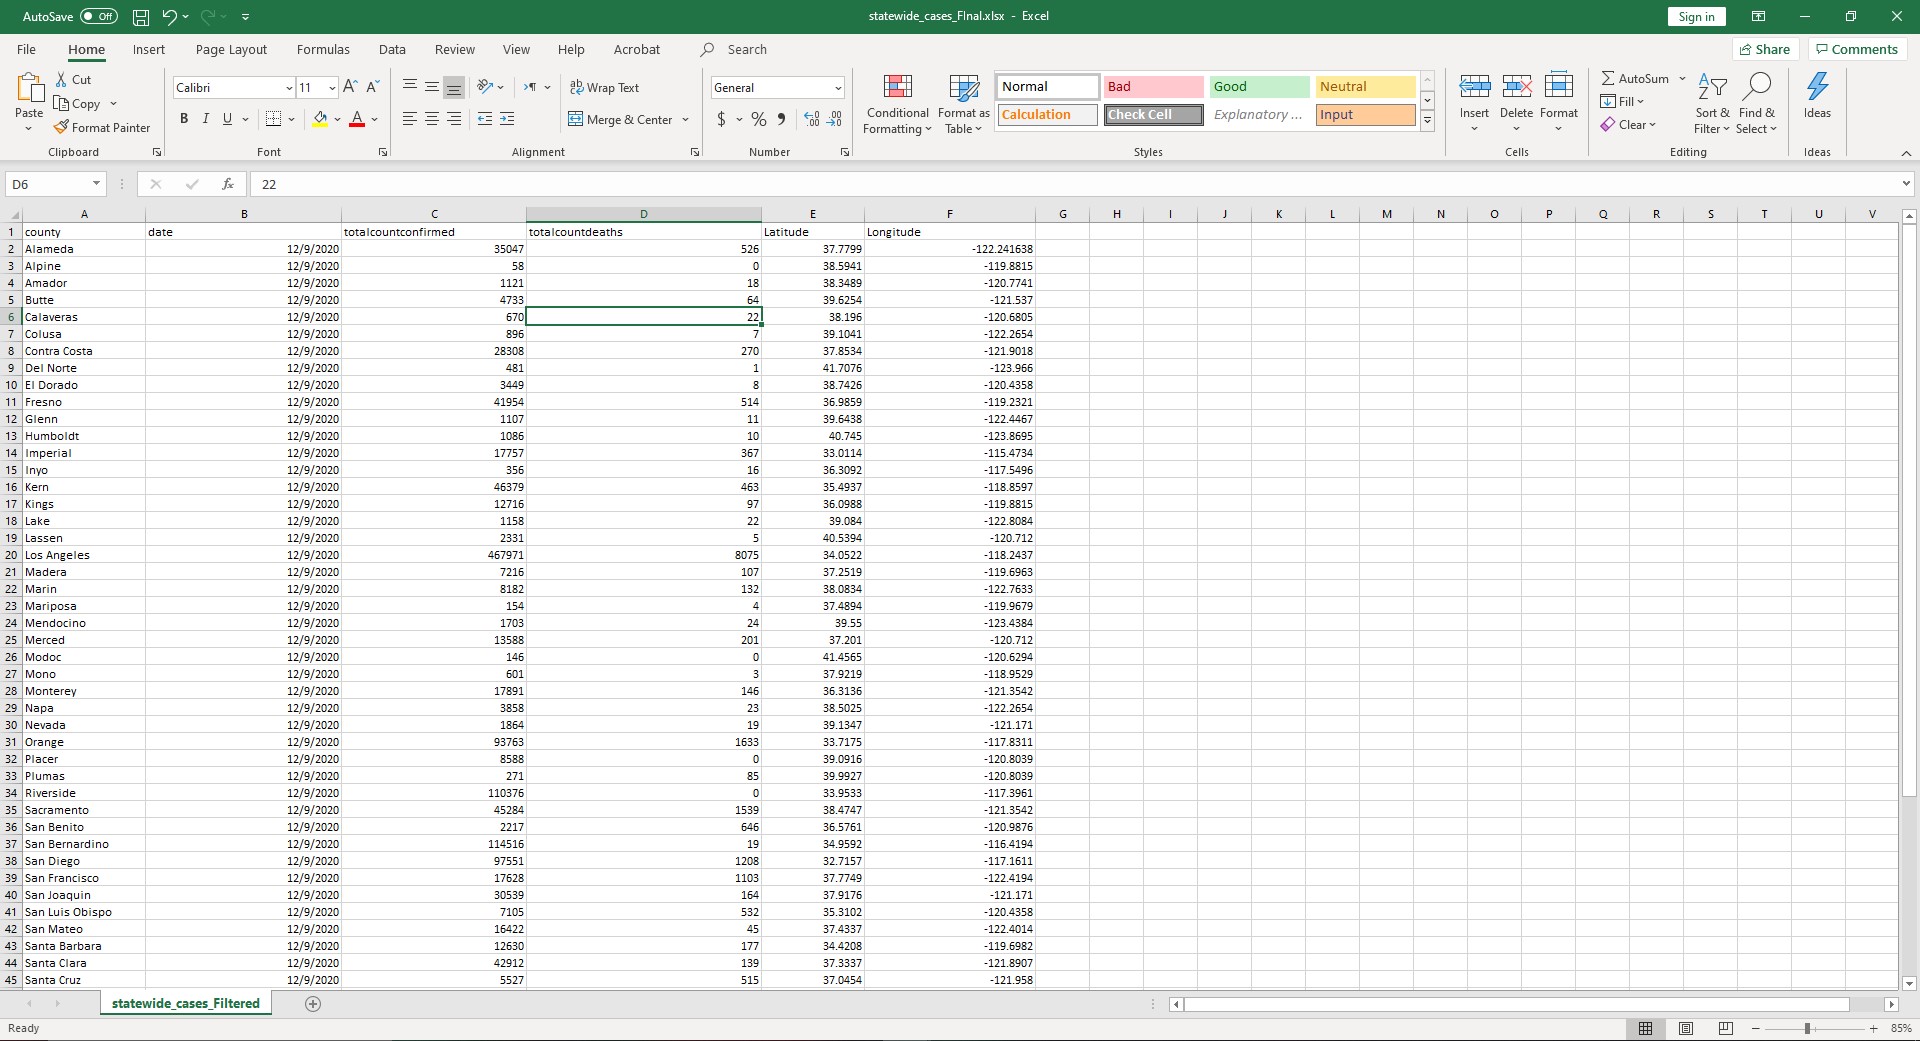
As you may all know, there are other indicators that affected the number of positive COVID/death cases. And one of the most important ones is the lack of access to healthcare facilities. That is why an HPSA feature layer is downloaded from the California Open Data Portal and is imported to show the Health Professional Shortage Area in California Counties. For this dataset, the heatmap symbology is chosen to show the density of medical facilities with the shortage in primary care. It will help the users to see if there is any relationship between population density and HSPA with the number of positive COVID-19 cases? 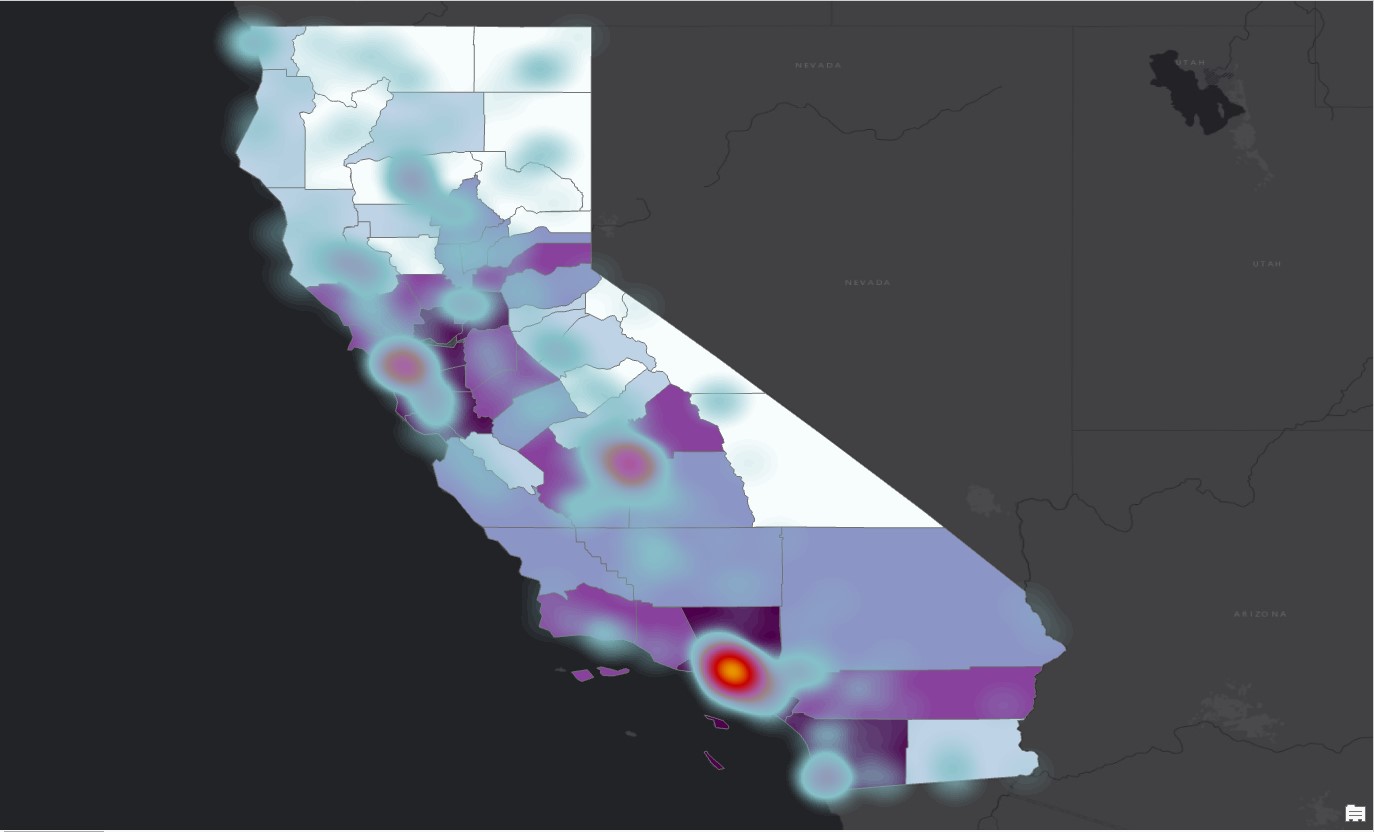
| |
|
Analysis By using layer overlay to analyze the inputs, it is proved that almost in all of California Counties, the higher population density resulted in more COVID-19 cases and, the same pattern is with the death rate patterns in counties too. Also, the use of heat map symbology made it possible to investigate the possible relationship with the COVID-19 disease. It is also noteworthy to mention that counties with higher population density and less accessibility to medical facilities struggle more with COVID-19. 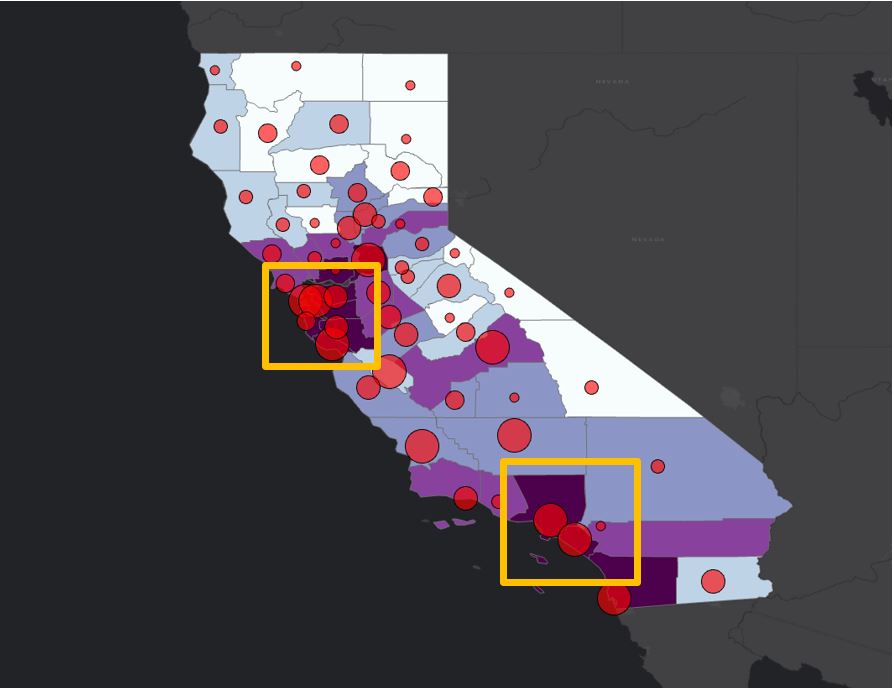
By zooming to the highlighted orange area as it is shown in the picture bellow, the relationship between COVID-19 cases/ deaths, population density, and lack of access to medical facilities can be clearly seen in Los Angeles county. 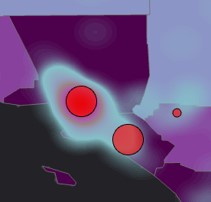
| |
ConclusionsThere are several ways in which this project can be developed, but my opinion is to focus on some specific counties with a higher number of COVID-19 cases and start adding more indicators that by controlling them, we can prevent, control and stop the spread of the virus among all of the counties. Future collaboration with different departments in the State of California is needed to get access to more datasets, including homelessness statistics, income data, and demographics for across the state.
| |
ReferencesJohn Hopkins University, "Johns Hopkins Launches New U.S. COVID-19 Map.", 14 April 2020 John Hopkins University, "COVID-19 United States Cases by County". 26 September 2020. Rogers, Kristin. "Johns Hopkins' dashboard: The people behind the pandemic's most visited site. 11 July 2020. Hamidi, Shima, Sabouri, Sadegh and Erwing, Reid "Does Density Aggravate the COVID-19 Pandemic? Early Results and Lessons for Planners". (2020) John Hopkins University. Kadi, Nadjat and Khelfaoui, Mounia "Does Density Aggravate the COVID-19 Pandemic? Early Results and Lessons for Planners Population density, a factor in the spread of COVID-19 in Algeria: statistic study". (2020) US National Library of Medicine. CALMATTERS STAFF, "Timeline: California reacts to coronavirus". (2020) CALMATTERS. California State Geospatial Portal, (2020) The State of California |