|
City of Sacramento Bicycle Network Analysis
|
|
|
Author
Korinne Tarien American River College, Geography 350: Data Acquisition in GIS; Fall 2020 |
|
|
Abstract
The City of Sacramento's flat terrain and temperate climate make the city ideal for cycling throughout most of the year. However, Sacramento experiences low bike ridership. Safety likely plays a key role in deterring higher bike ridership. This analysis incorporates a variety of cycling infrastructure, land use, and road network data to analyze the current network and to propose future investments in better bike infrastructure that improves safety and connectivity. The analysis focuses on enhancing existing high-quality bike infrastructure before expanding the network. Recommendations on investing are made based on current infrastructure needs, interaction with cars, and network interruptions from cross-traffic. Recommendations are close to those proposed by the City of Sacramento, with long networks proposed along major railways. |
|
|
Introduction
The City of Sacramento, CA lies at the center of the Central Valley. It's flat terrain and temperate climates make biking available to most people for most parts of the year. However, despite relatively large amounts of bike infrastructure integrated throughout the city, Sacramento experiences low bike ridership. Low bike ridership may be due to the design of the network throughout the city. Cycling infrastructure should focus on quality instead of quantity. High quality bike routes that ensure safety and efficiency are more likely to attract new riders and increase overall ridership. This analysis will be analyzing the current bike network in Sacramento and identify key areas for investment that will improve accessibility by bike. |
|
|
Background |
|
| According to the 2009 National Household Travel Survey, roughly 50% of all trips are 3 miles or less (Flusche, 2010). This translates to a 20-minute or less bike ride. Yet, only 1.8% of those trips are made by bicycle.
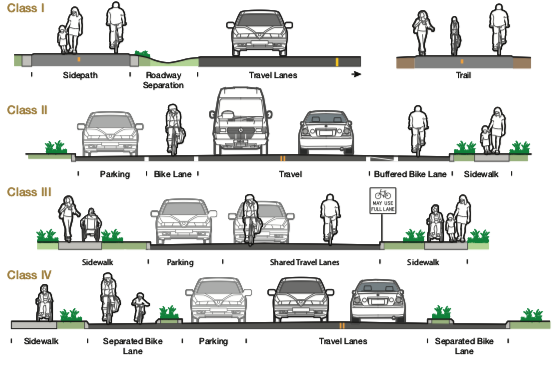
Low bike ridership can likely be attributed to the high occurrence of interactions with cars. A study from Portland State University cites safety as the key barrier to higher bike ridership (Geller, 2006). The study found that approximately 60% of survey respondents identified as "Interested but Concerned," showing an interest in cycling but concern for safety. Bike infrastructure is often categorized by their separation from other traffic. The California Bicycle and Pedestrian Plan establishes a bike path classification scheme as follows: Class I paths are bike paths that are fully separated from the street. The separation from vehicle traffic and reduced cross-traffic make Class I paths ideal. Class I bike paths are often situated along uncompromising natural and built features such as rivers, railroads, or freeways. Class II paths are on-street facilities typically designated by striping. Class II paths designate space exclusively for bicyclists, however are situated along moving motor vehicle traffic and experience the same amount of cross-traffic at intersections as motor vehicles. These paths provide good separation in dense city areas but overall do not provide an adequate amount of safety for most riders to feel comfortable. Class III paths are paths that are shared with motor vehicle traffic. These paths are typically denoted with signage to encourage motor vehicles to share the road space. These paths have the highest interaction with cars and therefore are best situated along residential roads where motor vehicle speed is low. Class IV bike paths were recently added to the classification system, a way of building bike paths along existing roadways while improving safety with separation by physical barriers, such as planter boxes or bollards. Class IV paths provide a great alternative to Class II paths, that can be used in dense city areas but improve the safety of the rider. Most cities are comprised of all bike path classifications for the variety of scenarios throughout the city landscape. However, the increased safety of Class I and Class IV paths are most likely to encourage greater bike ridership. Class I paths can connect suburban areas to the city core with improved safety and the least amount of disruption due to cross-traffic. Class IV paths provide a great solution for dense urban areas where Class I paths are not feasible. |
|
|
Methods |
|
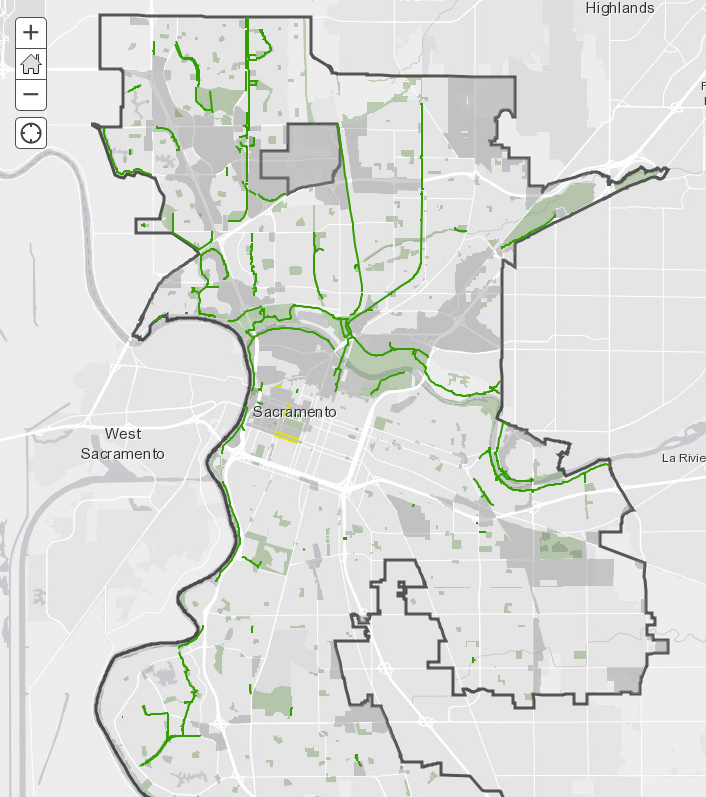
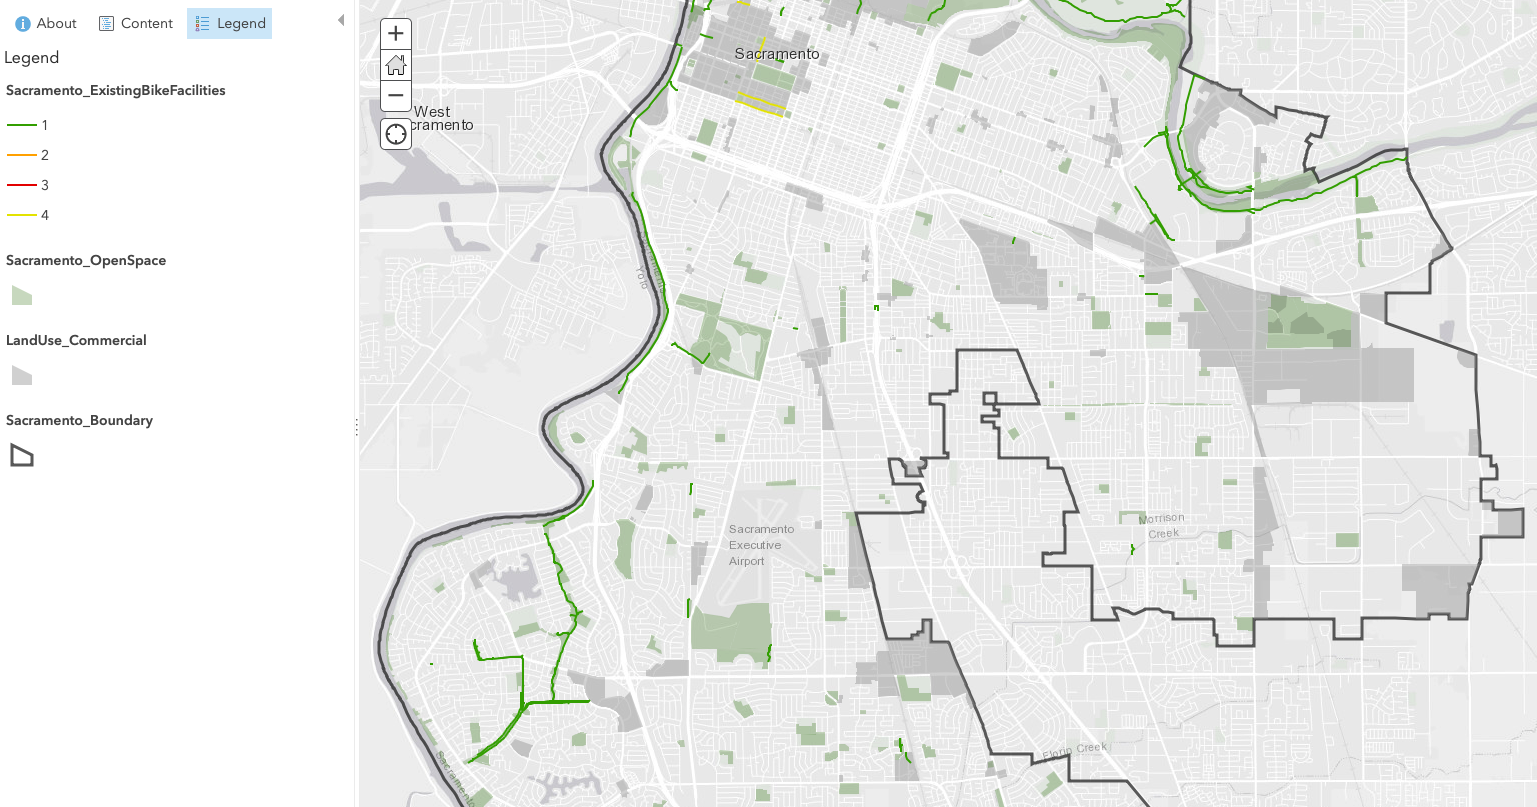
| Step 1: Analyze current infrastructure for gaps.
The first local investments should be to close any gaps in the current network. These gap closures are most cost-effective for well-established routes that would encourage higher bike ridership if fixed. Bike network data from 2019 was obtained from the Sacramento Area Council of Governments (SACOG) using Esri ArcGIS Online software. The data was clipped to a boundary layer of the City of Sacramento from SACOG. Symbology was adjusted to reflect the safety of bike facility classifications by relative safety. The bike network was then filtered for only Class I (green) and IV (yellow) facilities, the safest bike facilities. |
|
| Step 2: Identify areas missing high-quality bike paths.
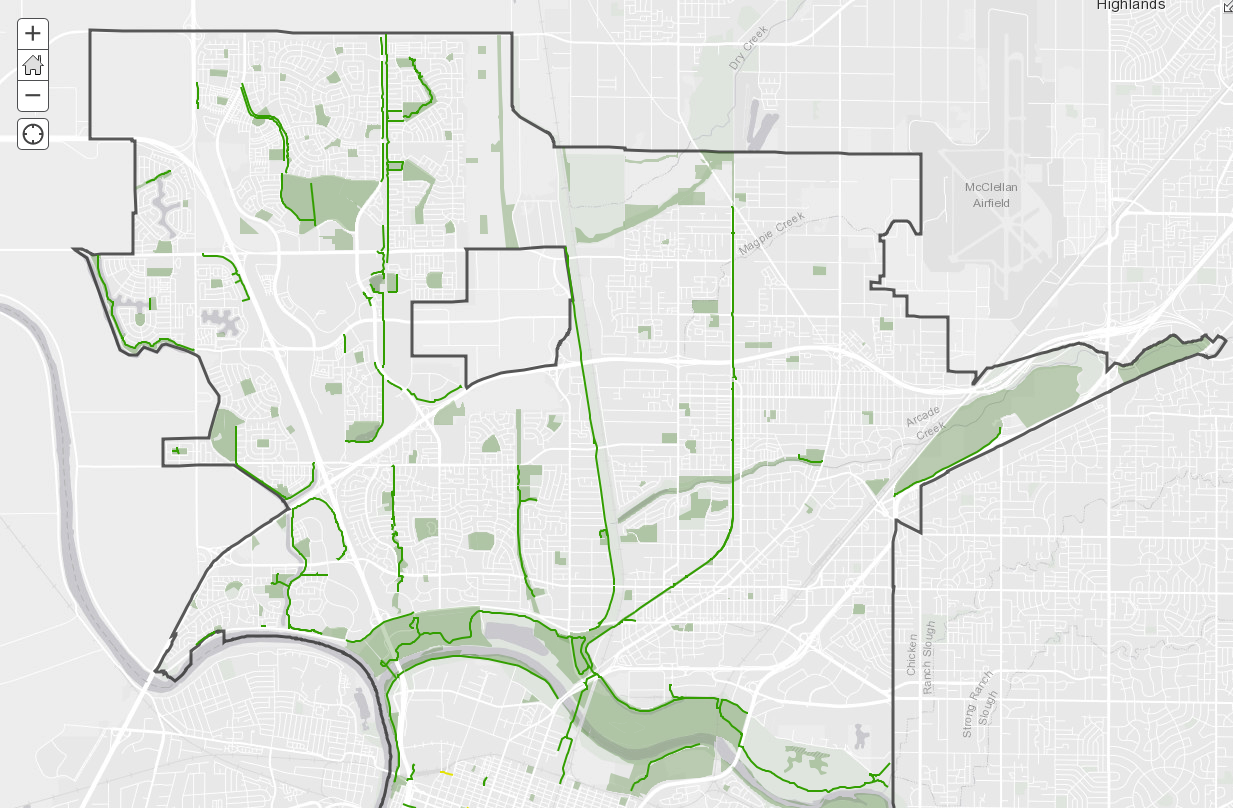
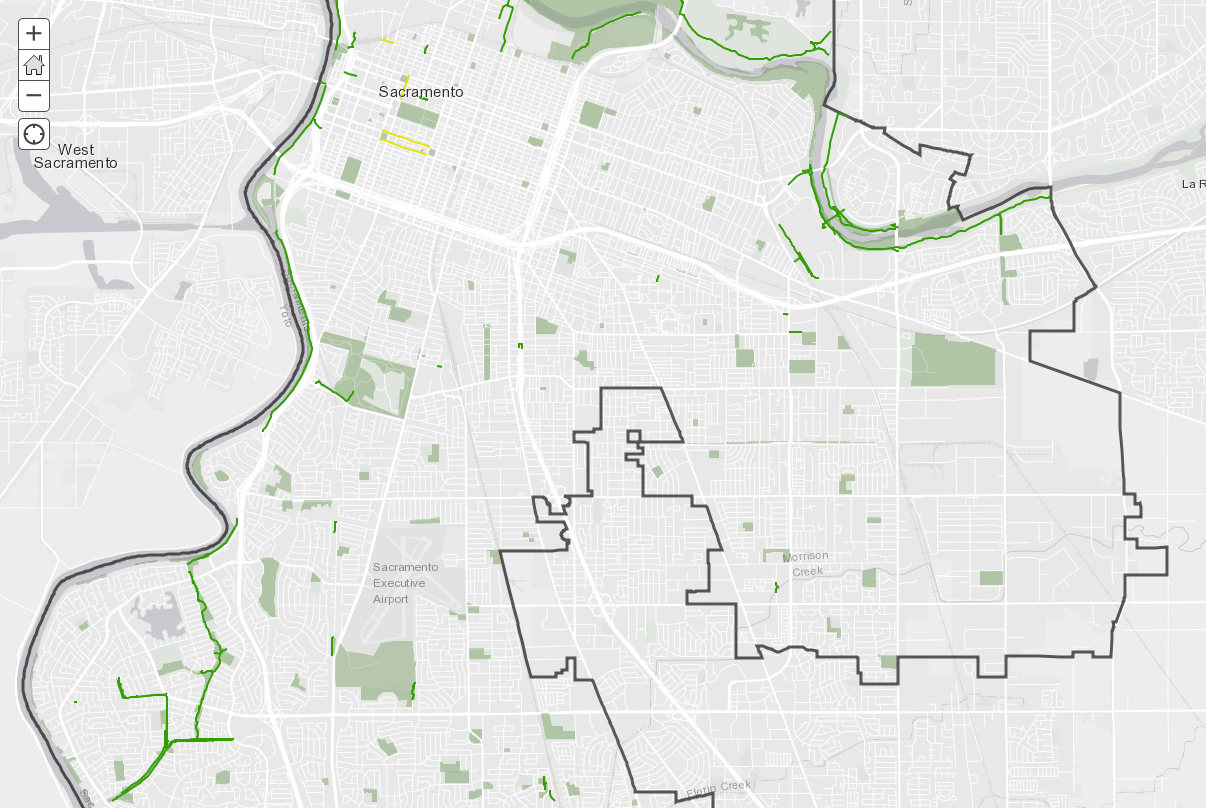
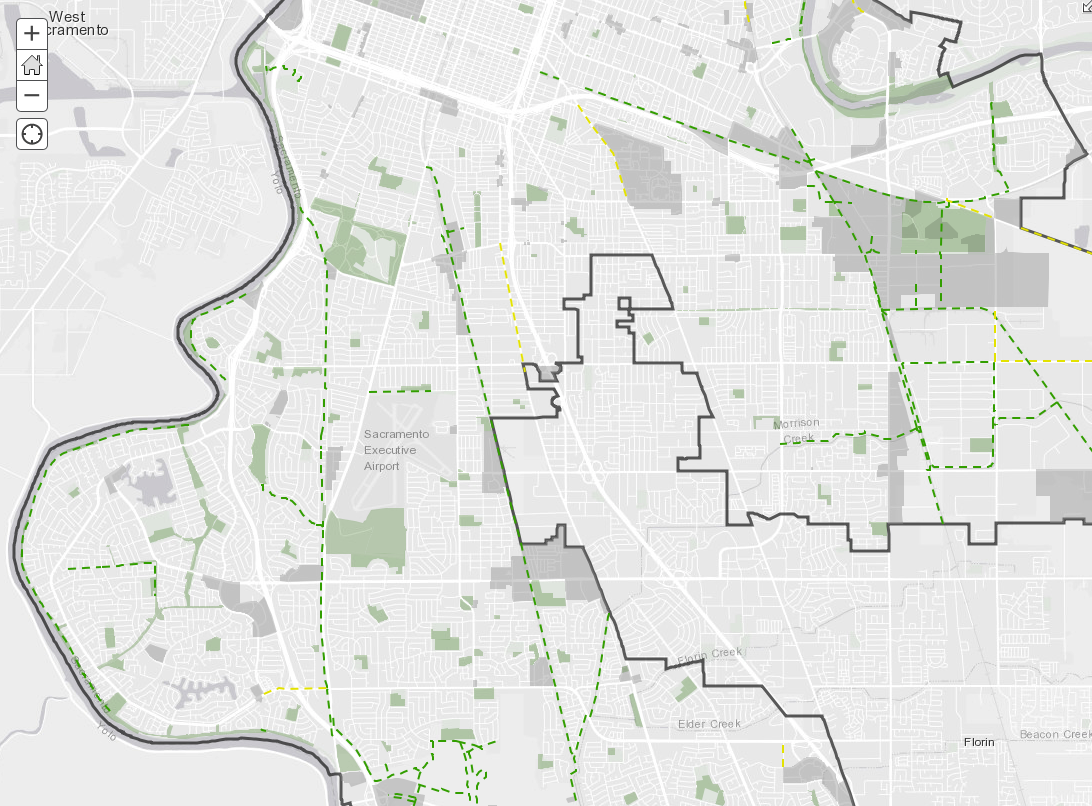
Looking at Class I and Class IV bike paths, it becomes clear that there are a few well-established routes primarily in the northern parts of Sacramento. However, high-quality bike infrastructure is lacking in most parts of Sacramento south of the downtown area. |
|
| Step 3: Analyze connectivity to essential resources.
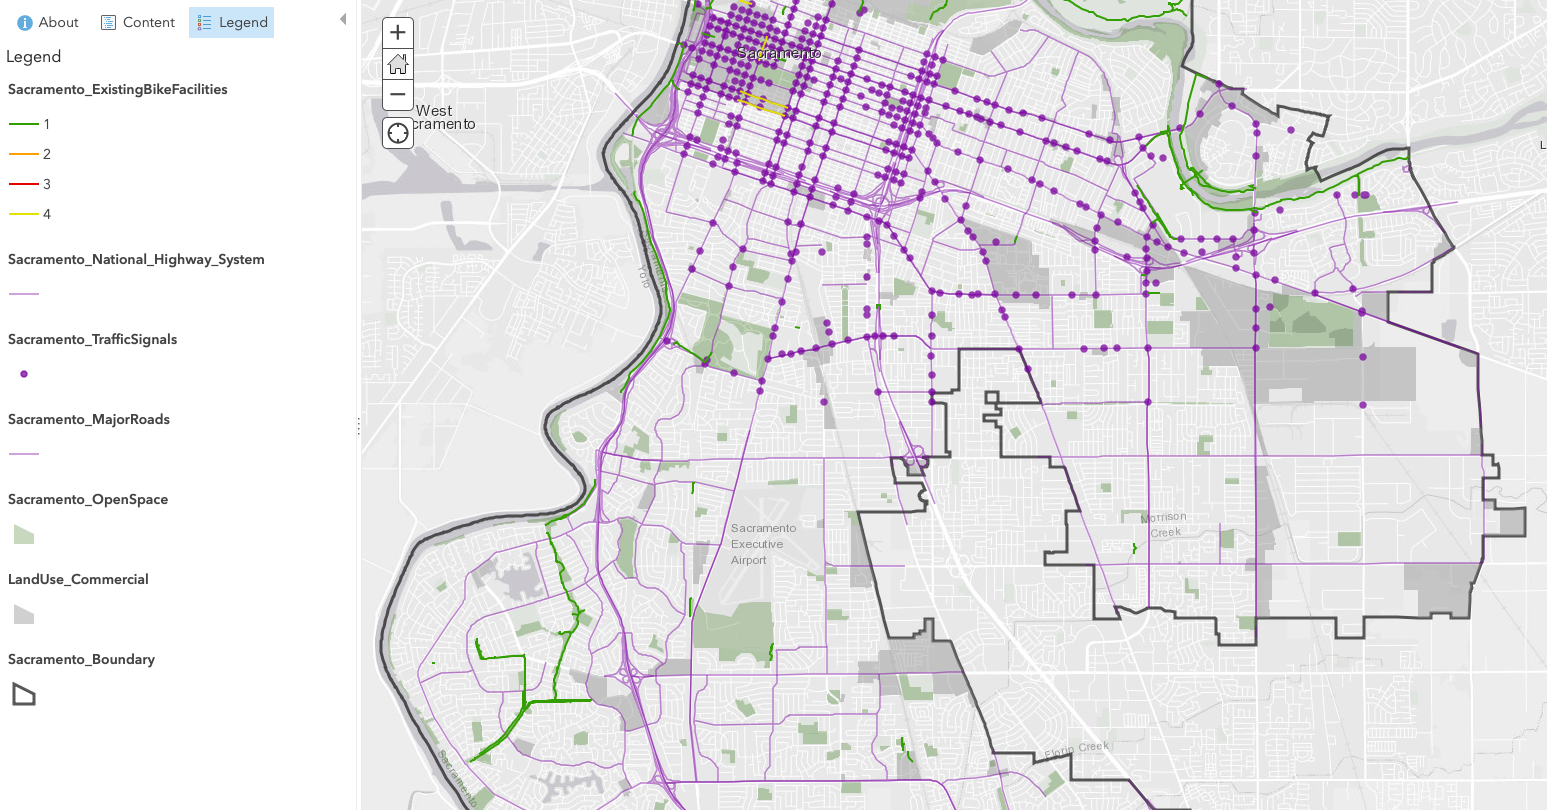
Bike networks should connect residential neighborhoods to essential resources, such as grocery stores or medical services. By improving access to these resources, people are more likely to take their bike instead of drive. After adding a land use layer from the City of Sacramento's General Plan 2035, land uses were filtered for commercial types and symbology was changed to gray polygons. |
|
| Step 4: Consider other elements that may deter bike ridership.
Bike paths should have the least interaction with motor vehicles possible while still maintaining a direct connection to essential resources. Ideal bike networks connect residential neighborhoods to essential resources. These networks should be separated from motor vehicle traffic for safety and noise issues. Networks should also avoid stop-and-go motion from stoplights, stop signs, or other interruptions. An arterial roads layer from SACOG was added to delineate networks with high traffic counts or high traffic speeds. An additional highways layer was added from the California Department of Transportation to supplement arterial roads with state highways. A stoplights layer from the City of Sacramento was also added to gain insight on potential stop-and-go motion of cyclists along routes. Spatial analysis was conducted for all layers to find roads and stoplights that were either within or intersected the City of Sacramento boundary layer. |
|
|
Results |
|
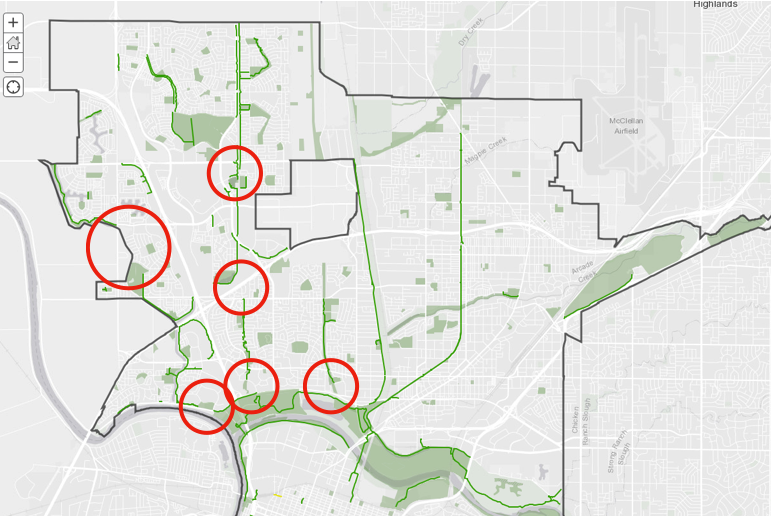
| The initial analysis found that there are several well-established bike paths that extend up into the northern regions of the city. These paths include long segments along greenbelts or canals. Most paths are a combination of serval smaller segments. There are 3 high-quality paths that would open most of the South Natomas area to the downtown core if investments were made to connect the neighborhood to the American River Trail. Similarly, North Natomas is cut off from connections to South Natomas by I-80. Additional investments are needed to create more continuous bike paths across major arterial roads in the North Natomas region.
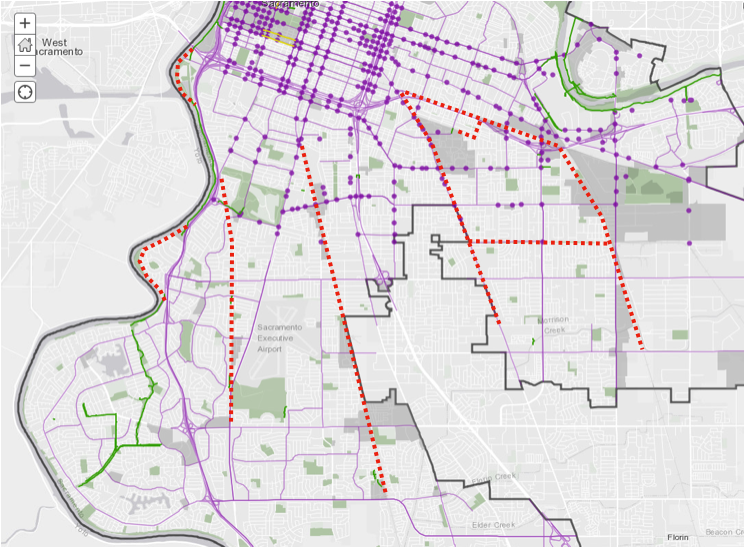
The southern part of Sacramento contains only one high-quality bike path, along the river. This path is fragmented and requires intermittent navigating along city streets. In addition to closing these gaps, new bike paths along the Blue and Gold light rail lines would provide uninterrupted bike access to the downtown core from southern and southeastern regions of the city. An additional bike path along Stockton Blvd is also being proposed to improve access to the residential neighborhoods of Tahoe Park and Florin. |
|
|
Analysis
The recommended gap closures and network additions are closely aligned with the city's currently proposed bike network layer from 2019. Although it is not clear how the city has made their assessment, it is clear that there is a similar approach to planning bike path networks, which prioritize separation from major motor vehicle traffic arterials and with a focus on continuity.
|
|
|
Conclusions
This initial analysis provides a foundational understanding of large barriers for current and proposed network development. Incorporation of more data would enhance the understanding of the landscape. For example, stop sign data poses a similar disruption to bike travel as streetlights but there is currently no stop sign data available for the City of Sacramento. Additionally, some of the data used in this study has a limited extent, such as the streetlight data which primarily covered the South Natomas, Downtown, and East Sacramento neighborhoods. The extent to which arterial road data covered the city was also limited in the northernmost regions near North Natomas.
Additional and more granular data would provide greater insight into how to improve and expand the current bike network. Further analysis with community surveys and ride-along tours would enable planners to understand the community's interest in how the network is developed or key issues areas. |
|
|
References
Flusche, Darren. "National Household Travel Survey - Short Trips Analysis." The League of American Bicyclists. January 2010. https://www.bikeleague.org/sites/default/files/2009_NHTS_Short_Trips_Analysis.pdf Geller, Roger. "Four Types of Cyclists." Portland Office of Transportation. 2006. https://www.portlandoregon.gov/transportation/44597?a=237507 Lewis, Gabe. "Urbana Kickapoo Rail Trail Extension Study: Bicycle and Pedestrian Network Analysis." Champaign County Regional Planning Commission. October 2020. https://ccrpc.org/wp-content/uploads/2020/10/Chapter-4.pdf "Toward and Active California: State Bicycle and Pedestrian Plan." California Department of Transportation. May 2017. https://dot.ca.gov/-/media/dot-media/programs/transportation-planning/documents/f0020350_activeca_final-plan-2017-05-18-a11y.pdf |
|