Title
Changes in Land Cover within 2018 California Fire Perimeters
Author
Justin Forrester
American River College, Geography 350: Data Acquisition in GIS; Fall 2021
Abstract
This project explores the changes in land cover that occured from 2017 to 2019 within wildfire perimeters from the 2018 fires that occured in California. The purpose is to highlight the vegetation changes as a result of recorded damage to the landscape. A number of publically available GIS layers from ArcGIS Online and Living Atlas are used to create a web map and a dashboard, which has been augmented with a number of filtering and analysis tools. Only the land cover layer has been modified for the purpose of facilitating the identification of changes between the target years.
Introduction
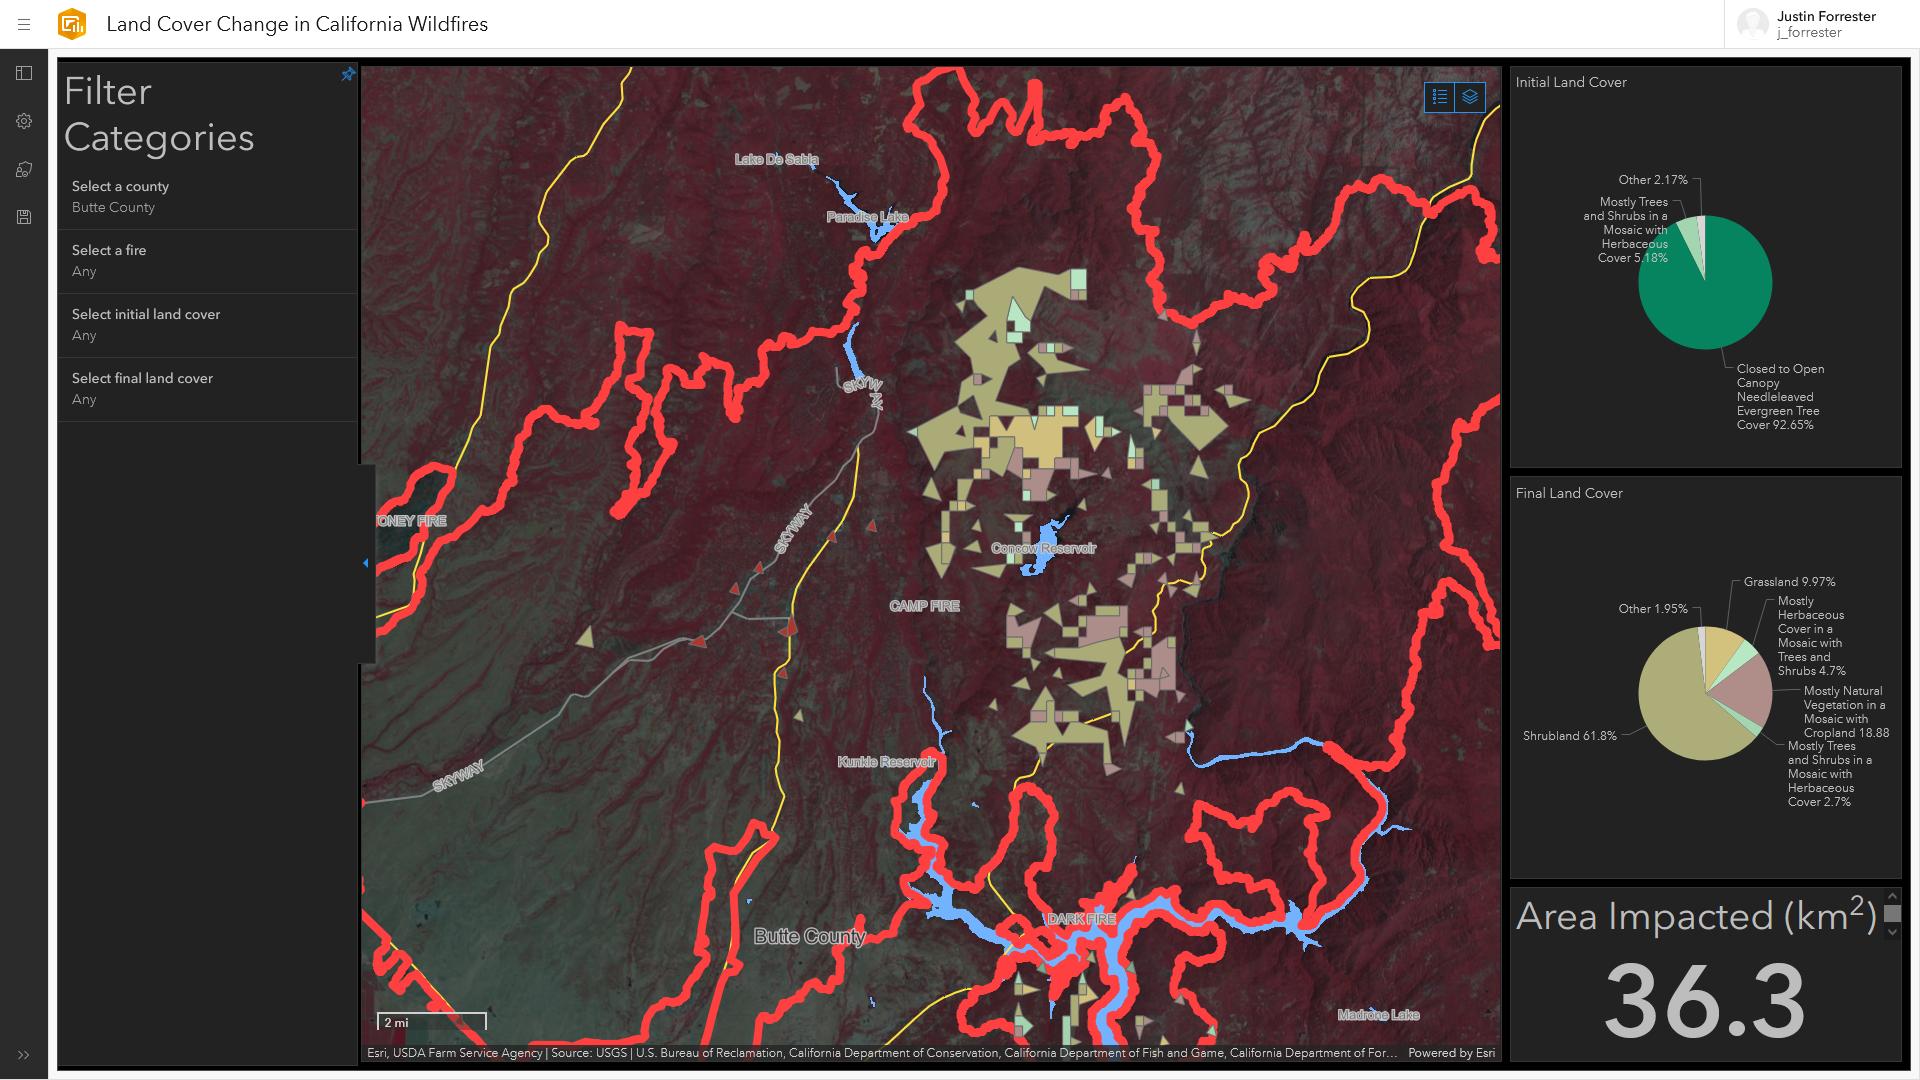
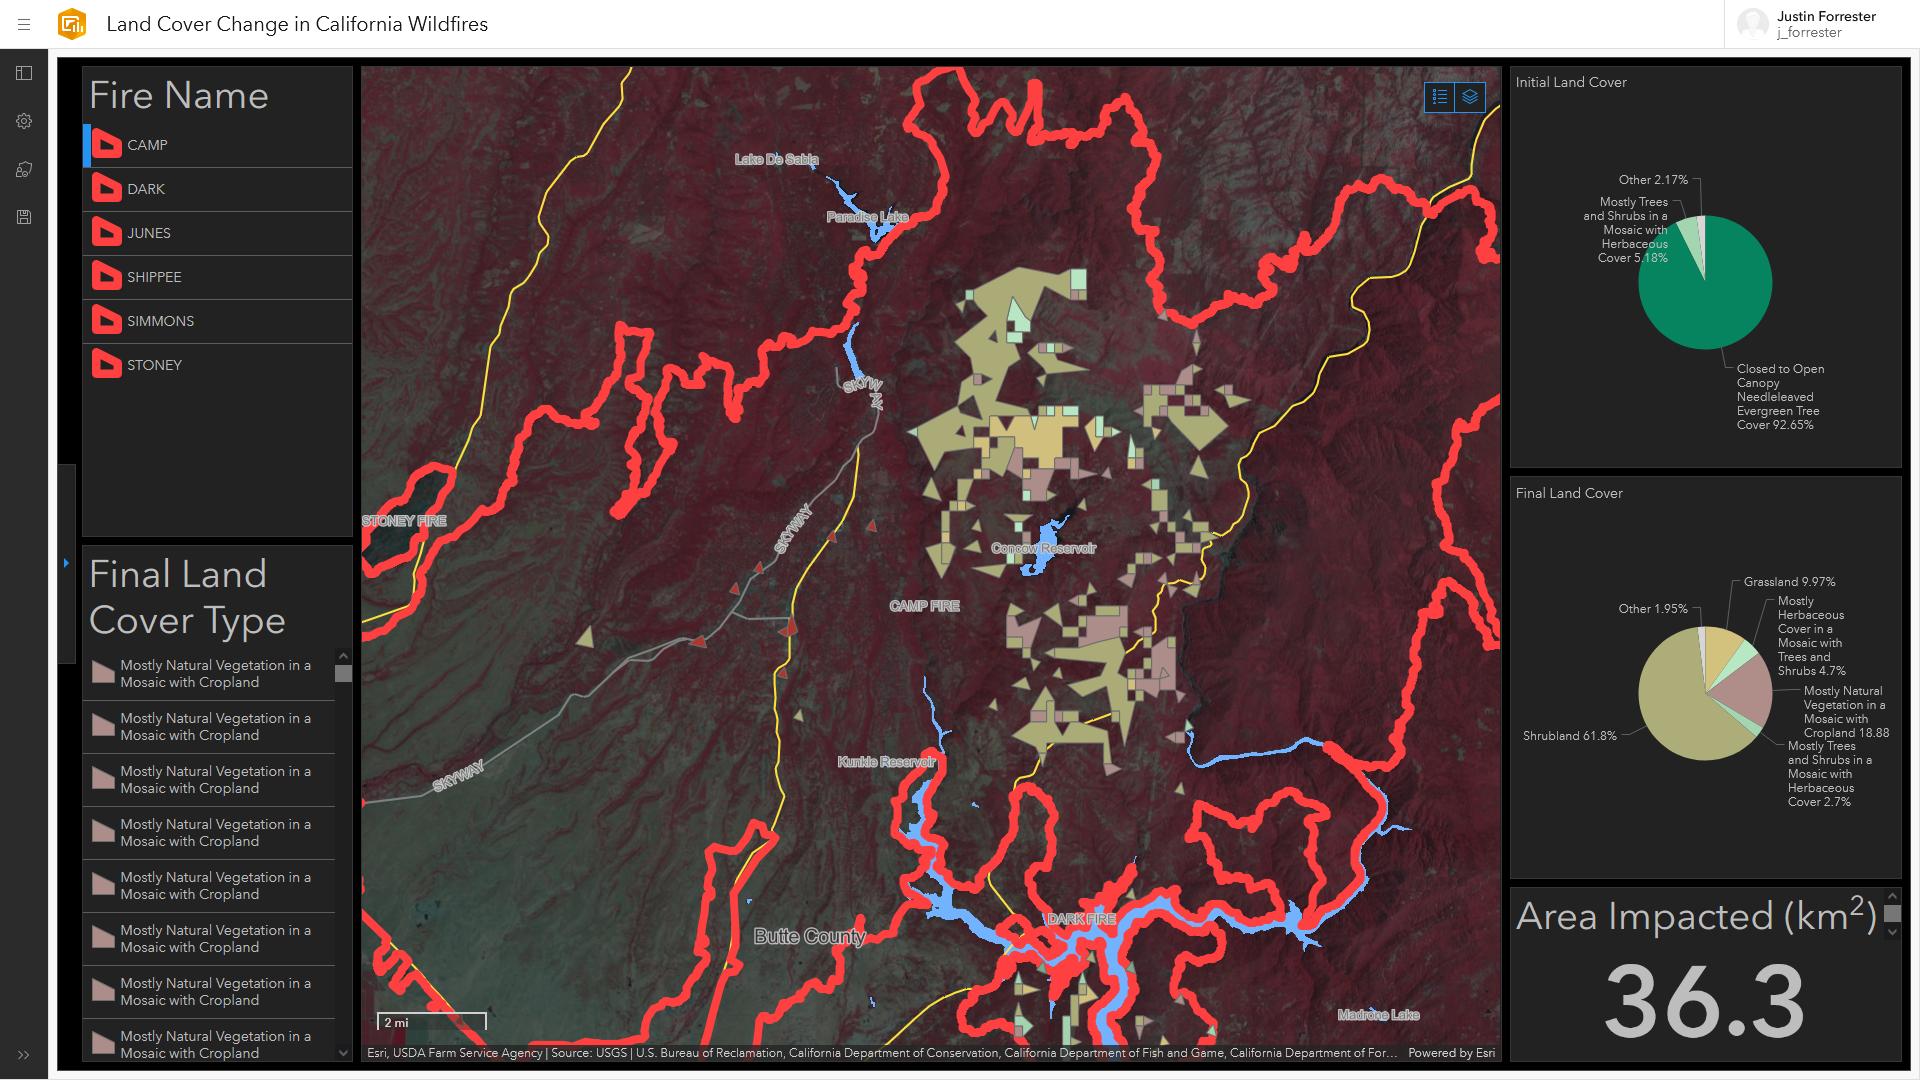
With wildfires a longstanding issue within California and with increasing devastation across the world, it is important to track the changes to the distribution of flora species so that appropriate recovery efforts can be made. One way to track these changes at a large scale is by reviewing the land cover types associated with specific regions. This project utilizes publicly available data layers acquired on Esri’s ArcGis web platform, such as ArcGIS Online or Living Atlas, to explore the changes in land cover within fire perimeters between the years 2017 and 2019. While all recorded fires within California in 2018 may be explored using the data within this project, particular focus is made on the 2018 Camp Fire which was especially devastating. To facilitate exploration and analysis, a web map and dashboard has been created to view pertinent aspects of the study. The dashboard is particularly useful for its ability to provide intuitive filtering options and summary information in charts.
Background
"Post-Wildfire Rebuilding and New Development in California Indicates Minimal Adaptation to Fire Risk" by Kramer et al, 2021, discusses the building damage done by wildfires in California and the prevalence of rebuilding in the aftermath. The study looks at building damage, as well as rebuilding and new construction taking place within historical wildfire perimeters obtained from CalFire and the USDA Forest Service data. While the purpose is different, the FRAP perimeter data used for this map is similar to that used by Kramer and some techniques are similar. While this work focuses on general land cover change, some new development of urban areas and cropland is observed within fire perimeters, supporting the results by Kramer.
Methods
This map contains two main categories of layers: (1) The primary layers which are used to highlight land cover changes within 2018 California wildfire boundaries. (2) A number of contextual layers distributed among the major FGDC Frameworks including orthoimagery, roads, bodies of water, elevation, and county/state boundaries.
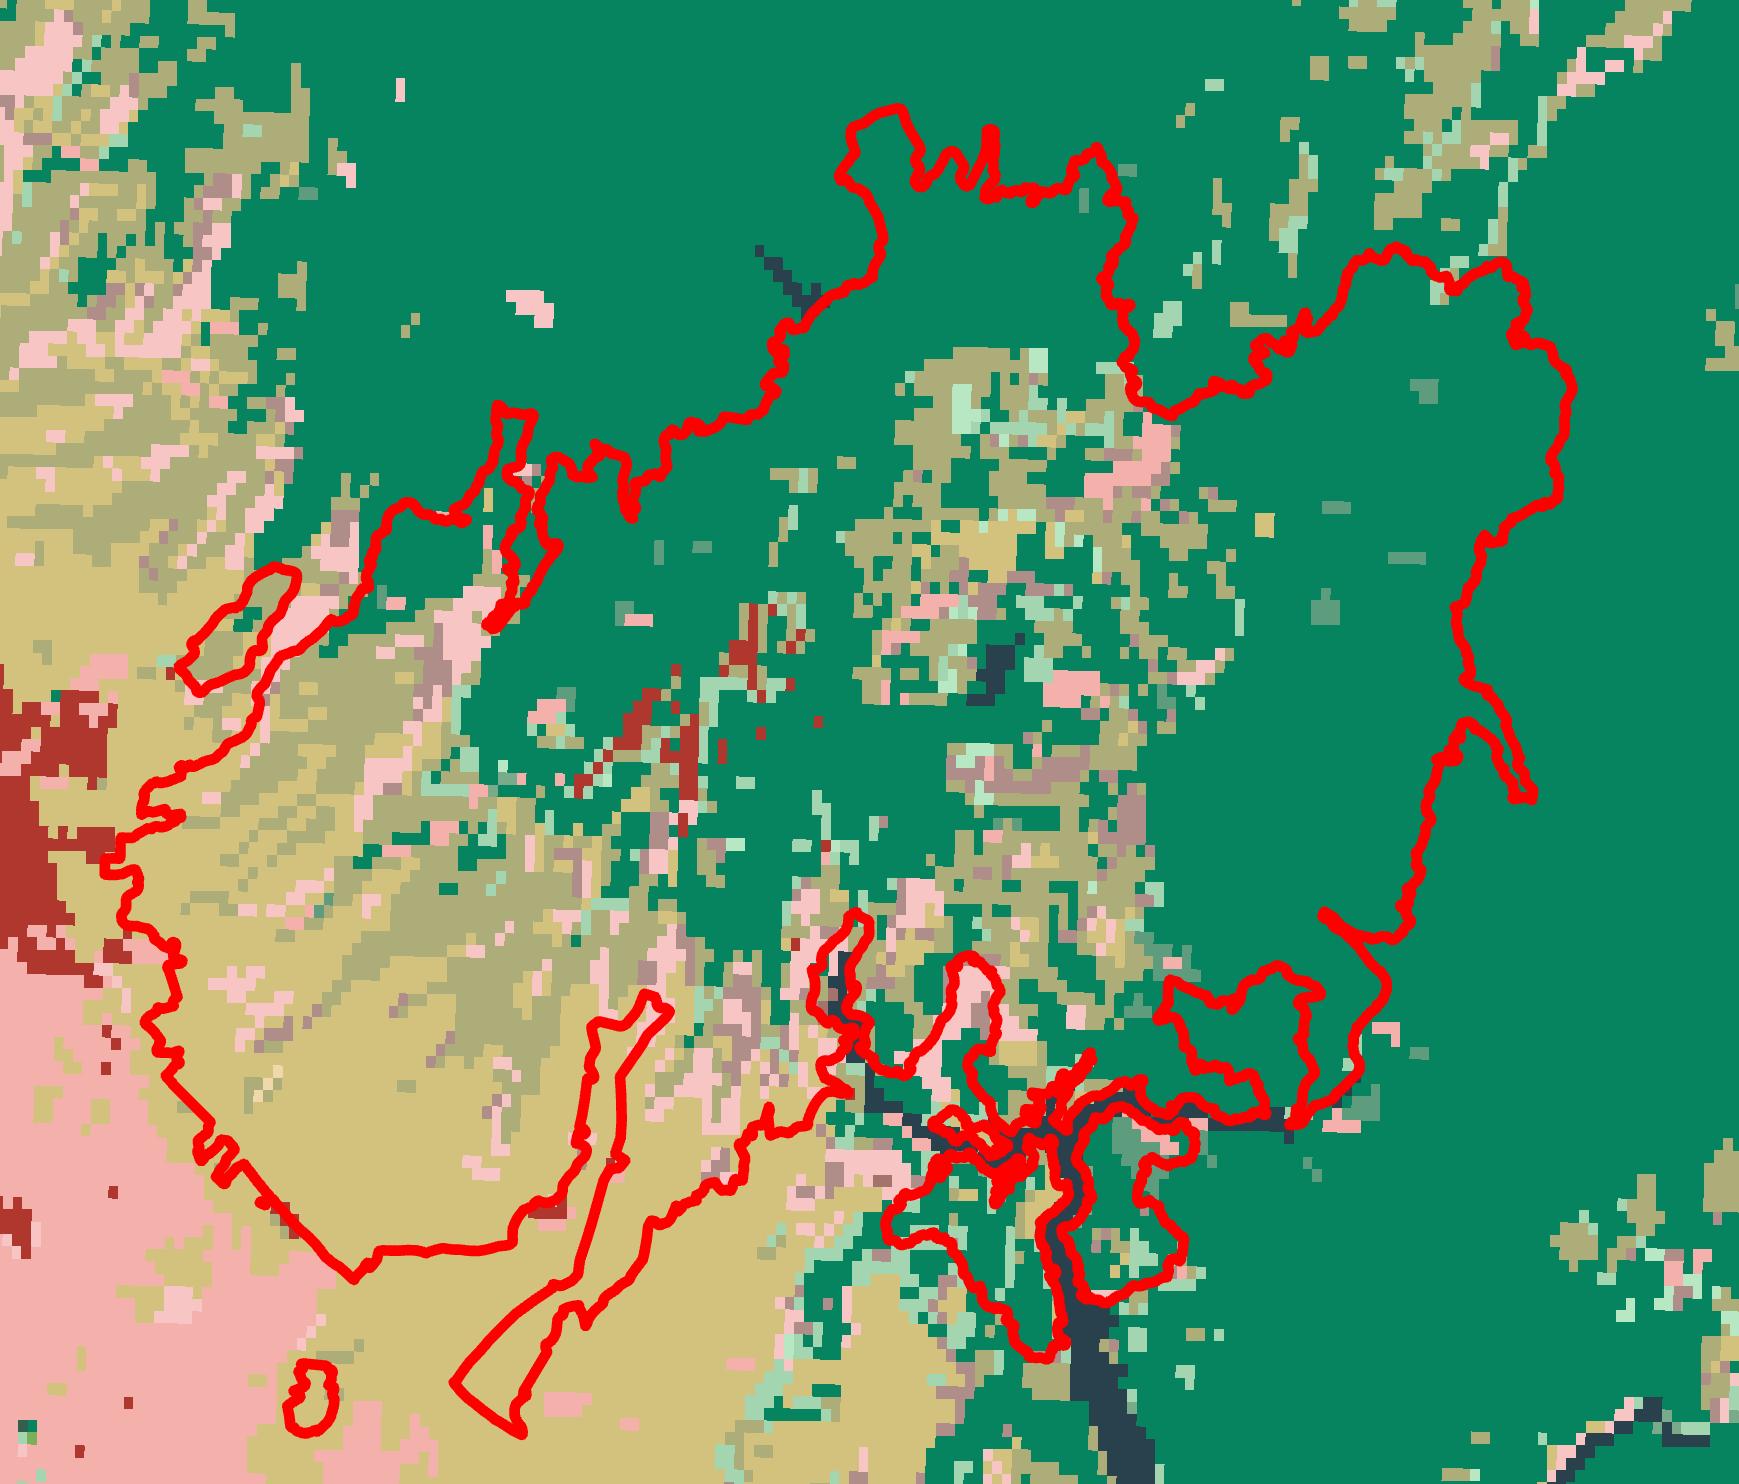
Fire perimeters were obtained from Fire Resource and Assessment Program (FRAP) data, which utilizes CAL Fire and USDA Fire Service, limited to the year 2018 only. The initial land cover data was obtained from the "Global Land Cover 1992-2019" layer published by Esri, which uses the ESA Climate Change Initiative data mapped to 300m. County boundaries were obtained from the "California County Boundaries" layer published by CAL Fire in 2014.
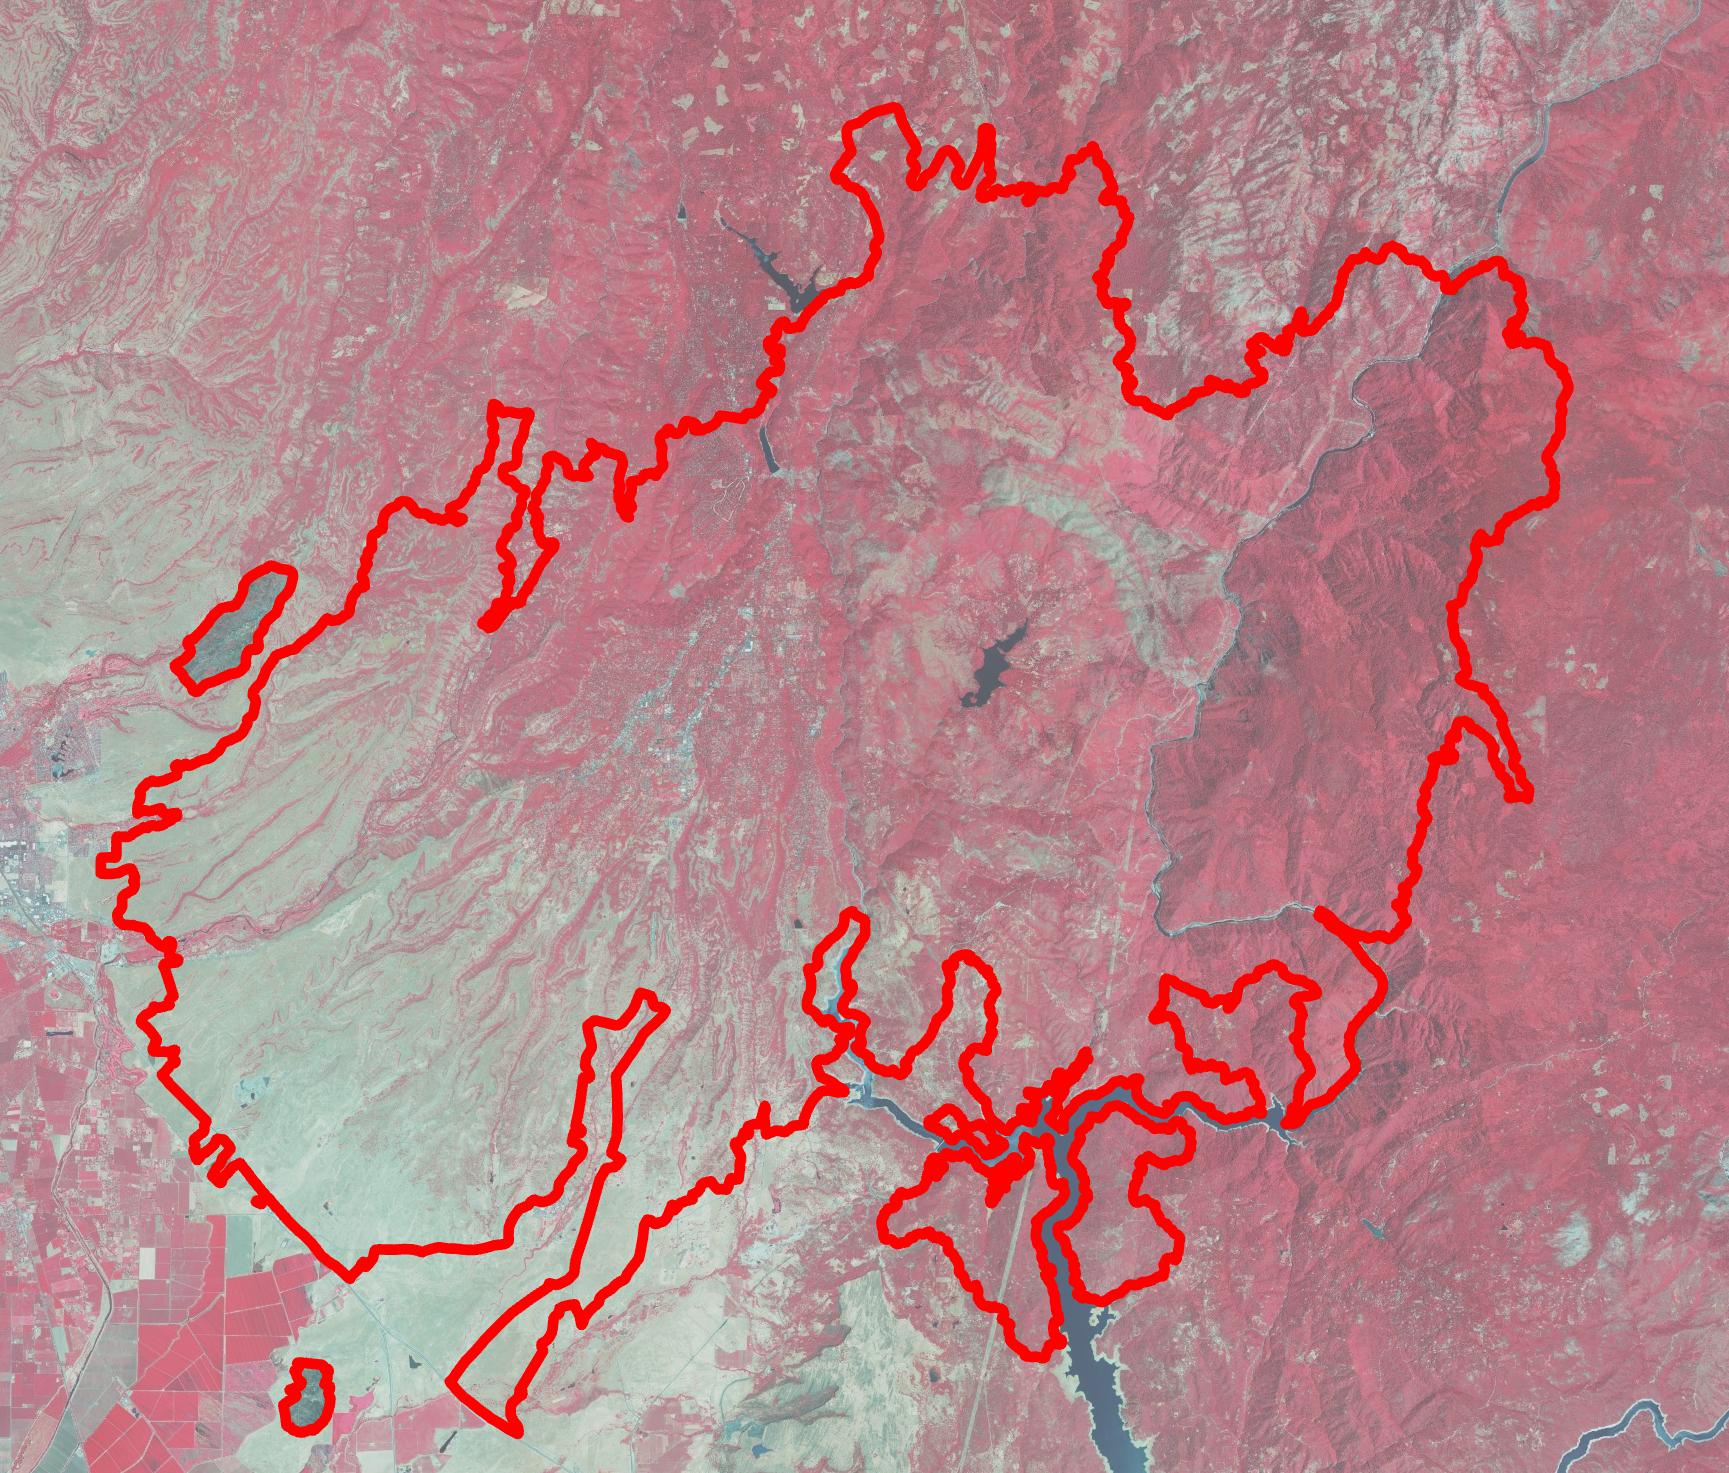
Infrared orthoimagery was used from the "USA NAIP Imagery: Color Infrared" layer provided by Esri, utilizing 1m or better imagery from the USDA National Agriculture Imagery Program (NAIP) with the latest images from 2019. This layer is used as base imagery in this map due to the ease of visibility for vegetation in the infrared spectrum, which helps to demonstrate the density of vegetation in the regions damaged by wildfires.
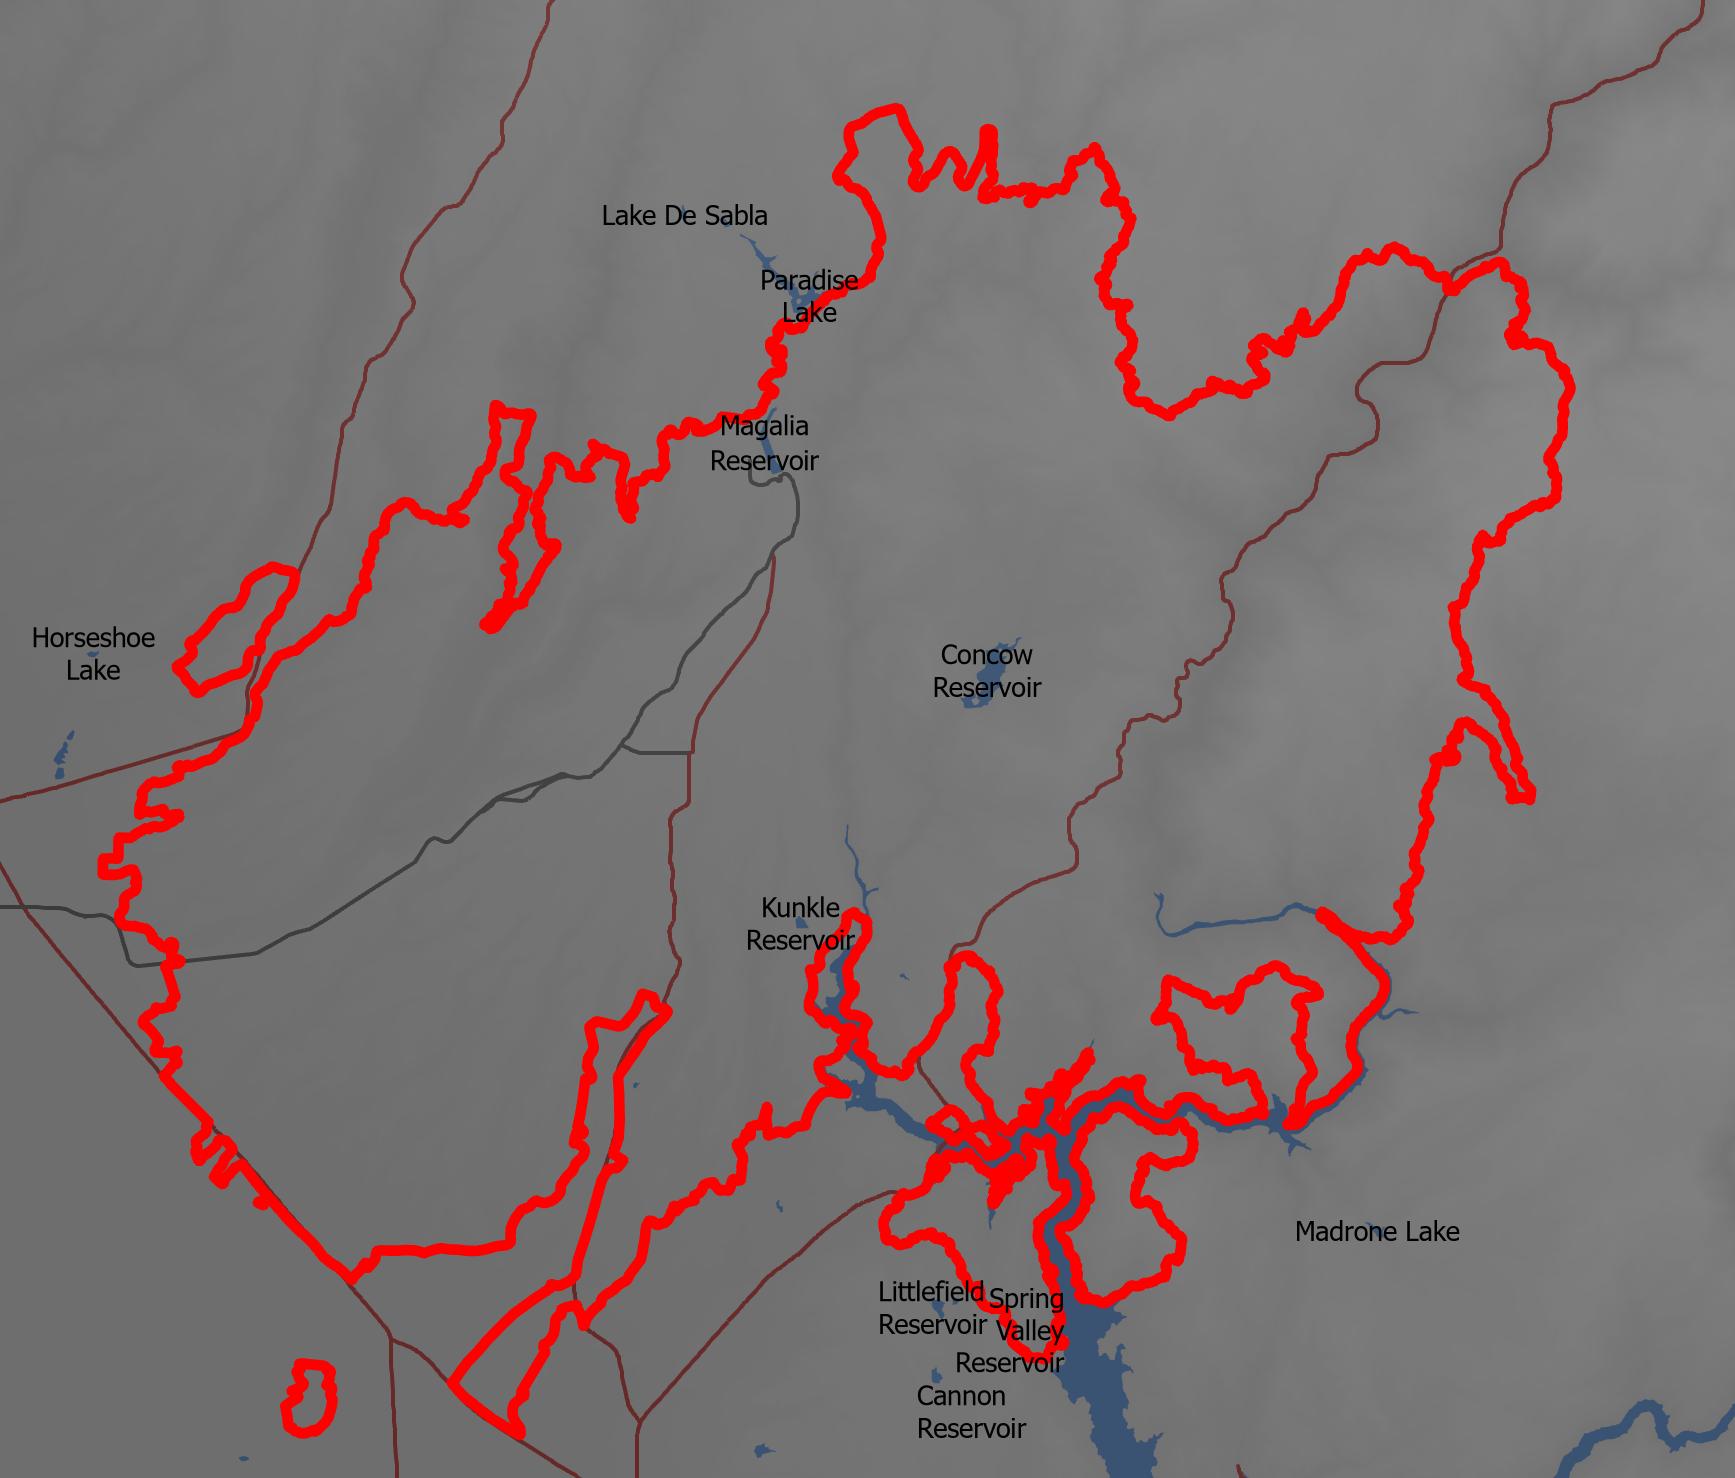
Roads were obtained from the "National Highway Planning Network" layer using data from the Bureau of Transportation Statistics, supplying location information for roads of various sizes across the United States. This data was last updated in 2020 as of this map creation. Bodies of water were included from the "National Hydrography Dataset Plus Version 2.1" provided by Esri, using data from the EPA Office of Water and the US Geological Survey originally published in 2019. This covers bodies of water such as lakes and rivers of varying sizes across the contiguous United States. Elevation was obtained from the "Ground Surface Elevation - 30m" layer provided by Esri, utilizing 1 arc-second data from the USGS National Elevation Dataset (NED) and last updated in 2021.
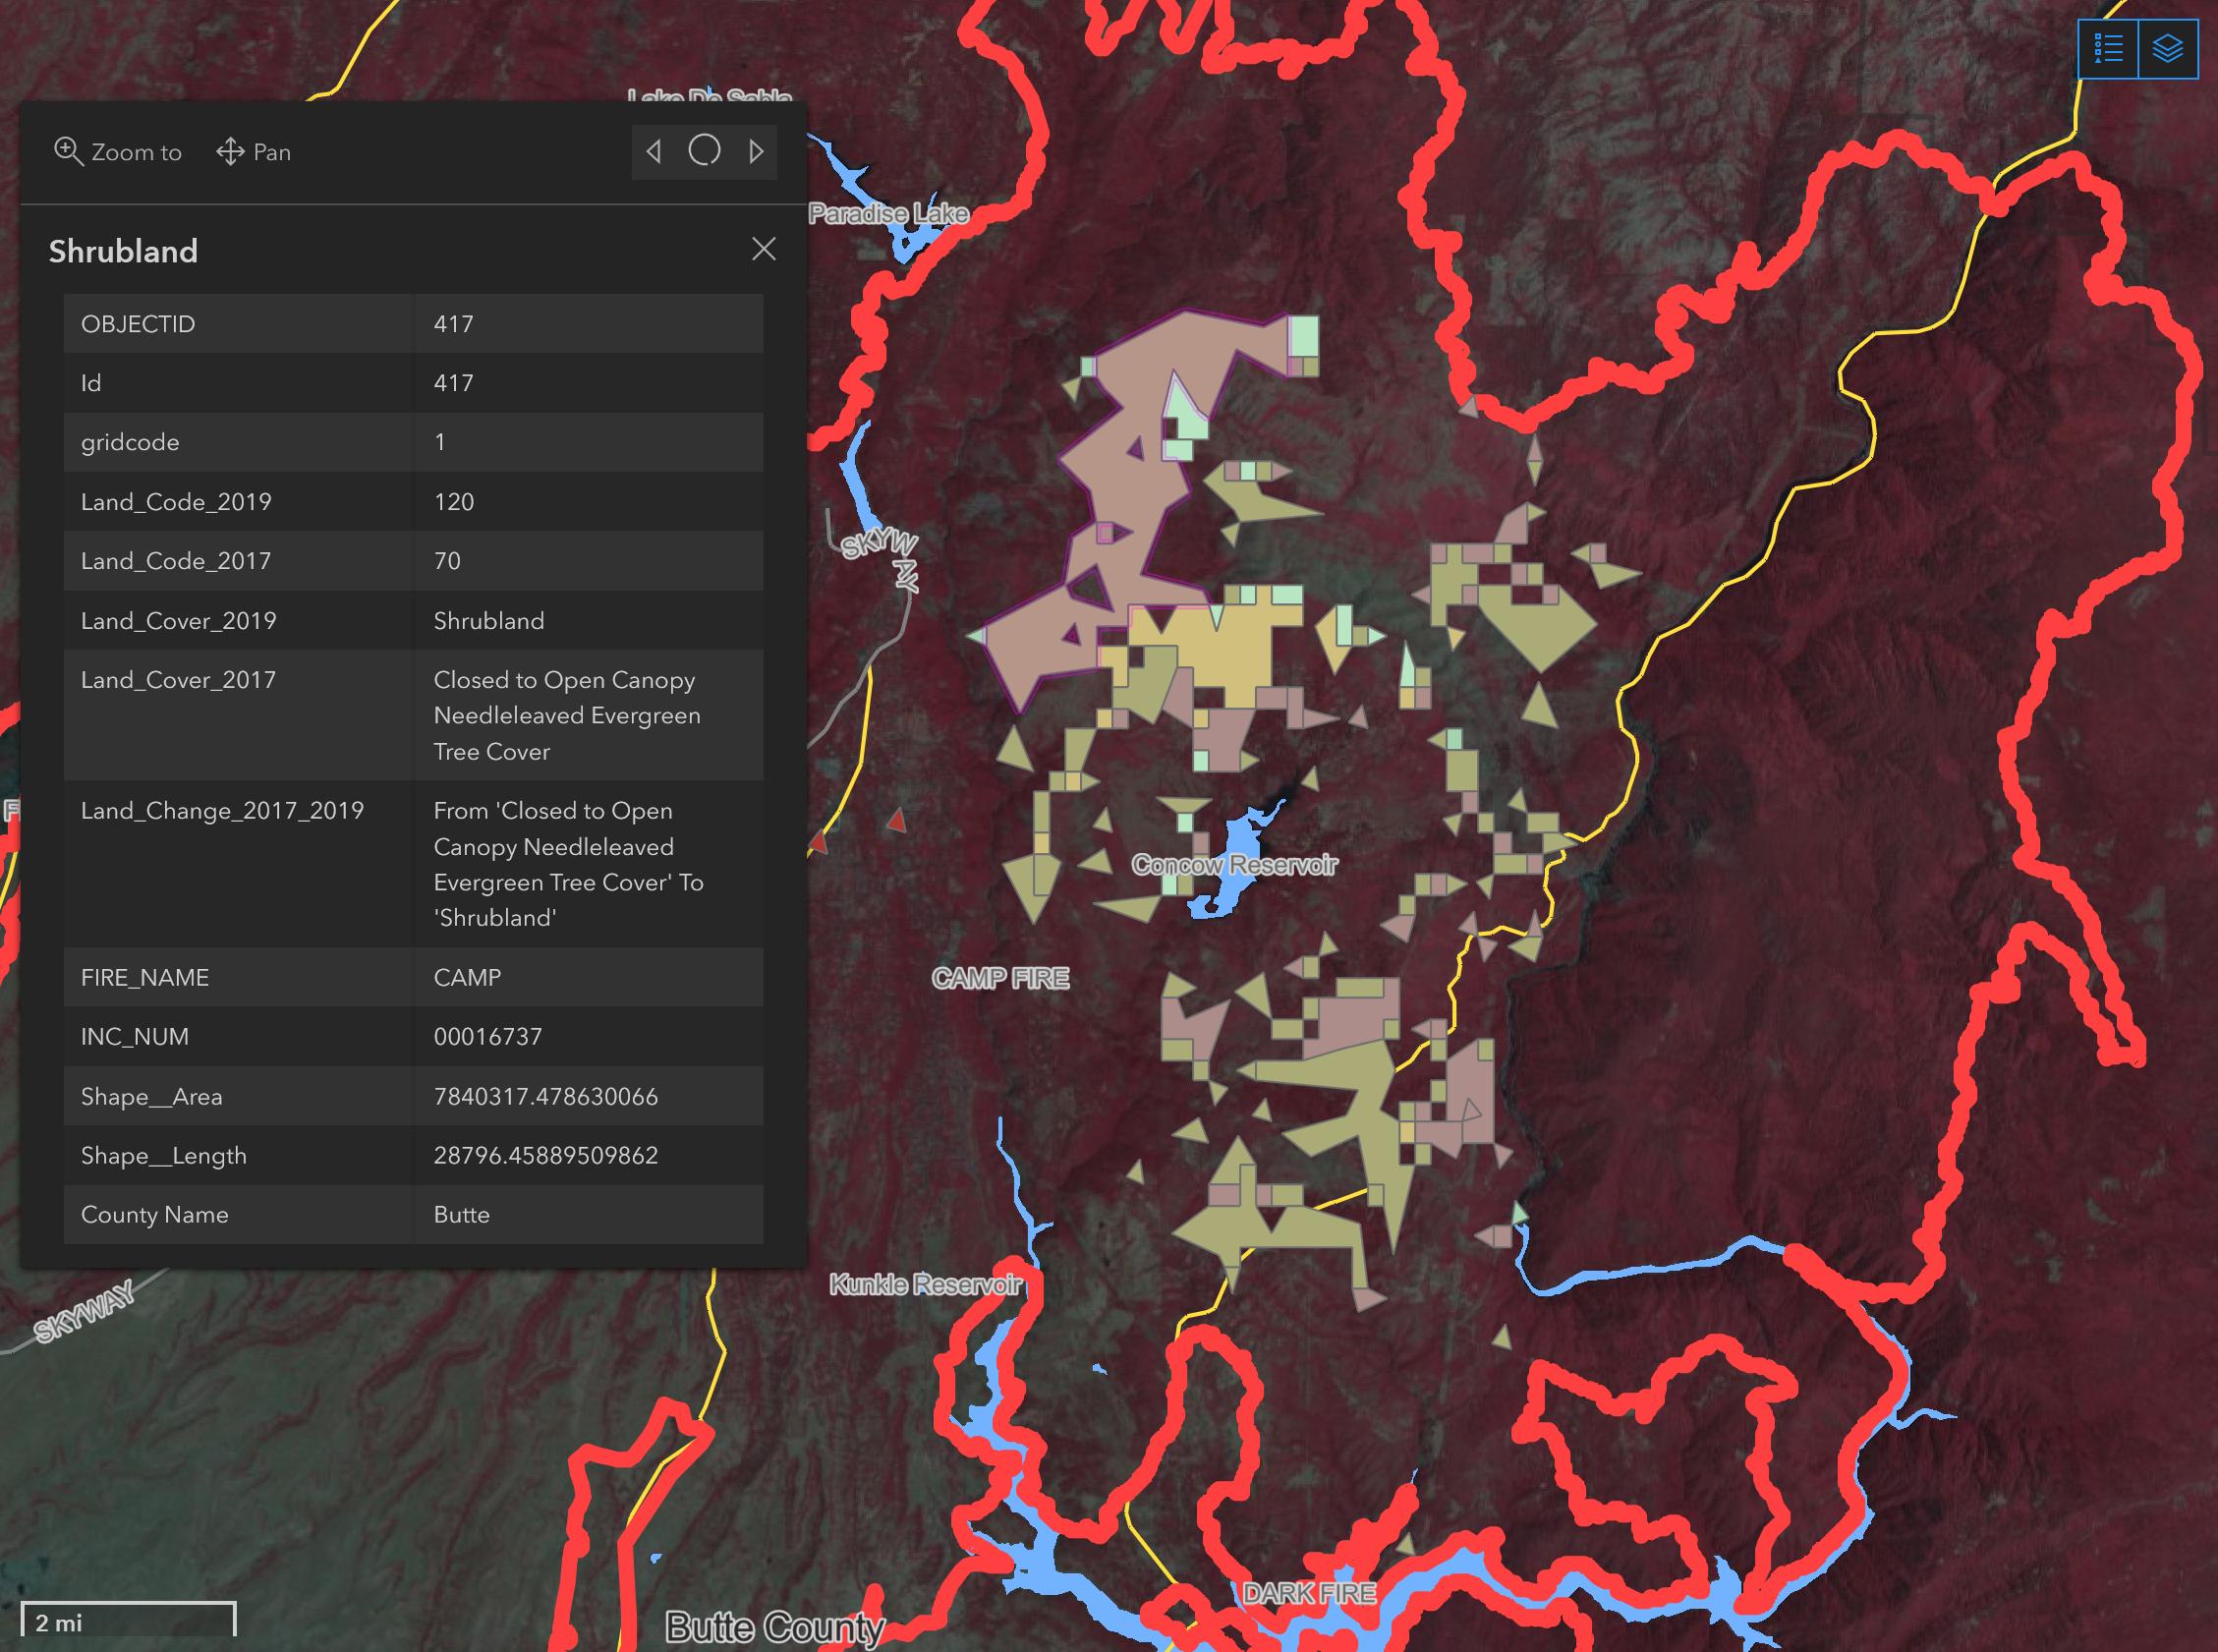
The land cover layer was modified by clipping the original land cover rasters from 2017 and 2019 to within the 2018 fire boundaries, using the raster calculator to compare the clipped 2017 and 2019 rasters and save new rasters for only locations where the land cover differs. Next a raster combination was performed to create unique codes for the before/after value sets in order to create a single raster. This raster was subsequently transformed to polygons and multiple attribute join operations were performed to retrieve the before/after land cover type strings, fire name, and county name for use in the dashboard. Lastly, the layer was projected to the equal area projection NAD 1983 (Teale) Albers with length units in meters, which matches the selected projection for the fire perimeter layer. The projection was required for meaningful area calculations. The modified land cover layer was published as the feature layer: “Land Cover Change in California Wildfires.”
Results
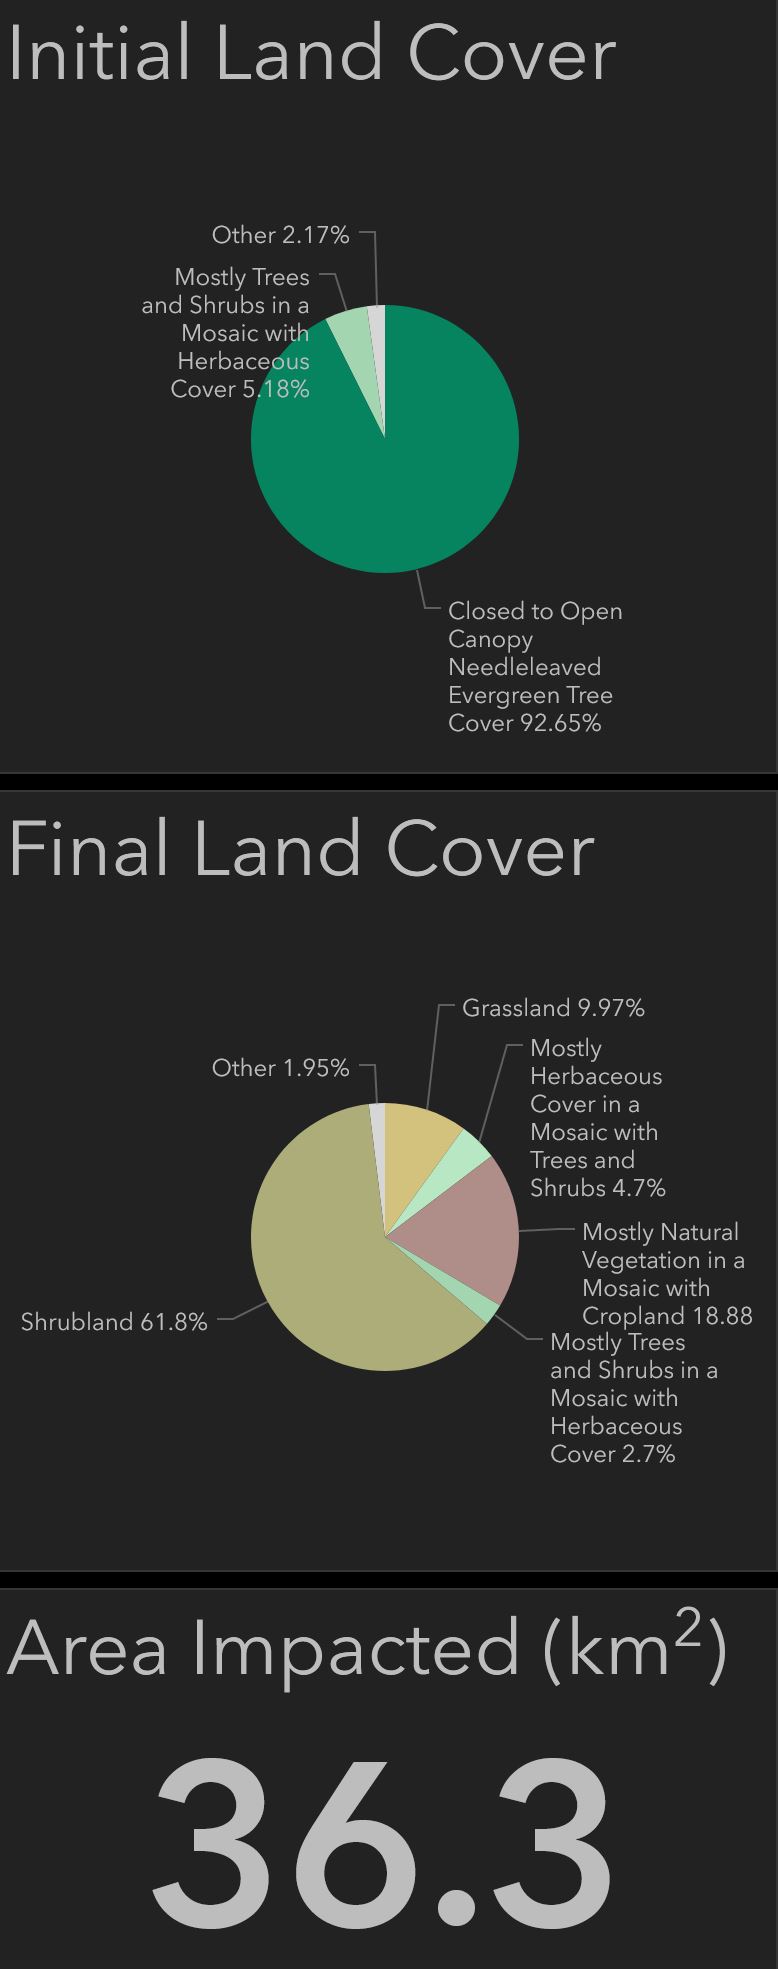
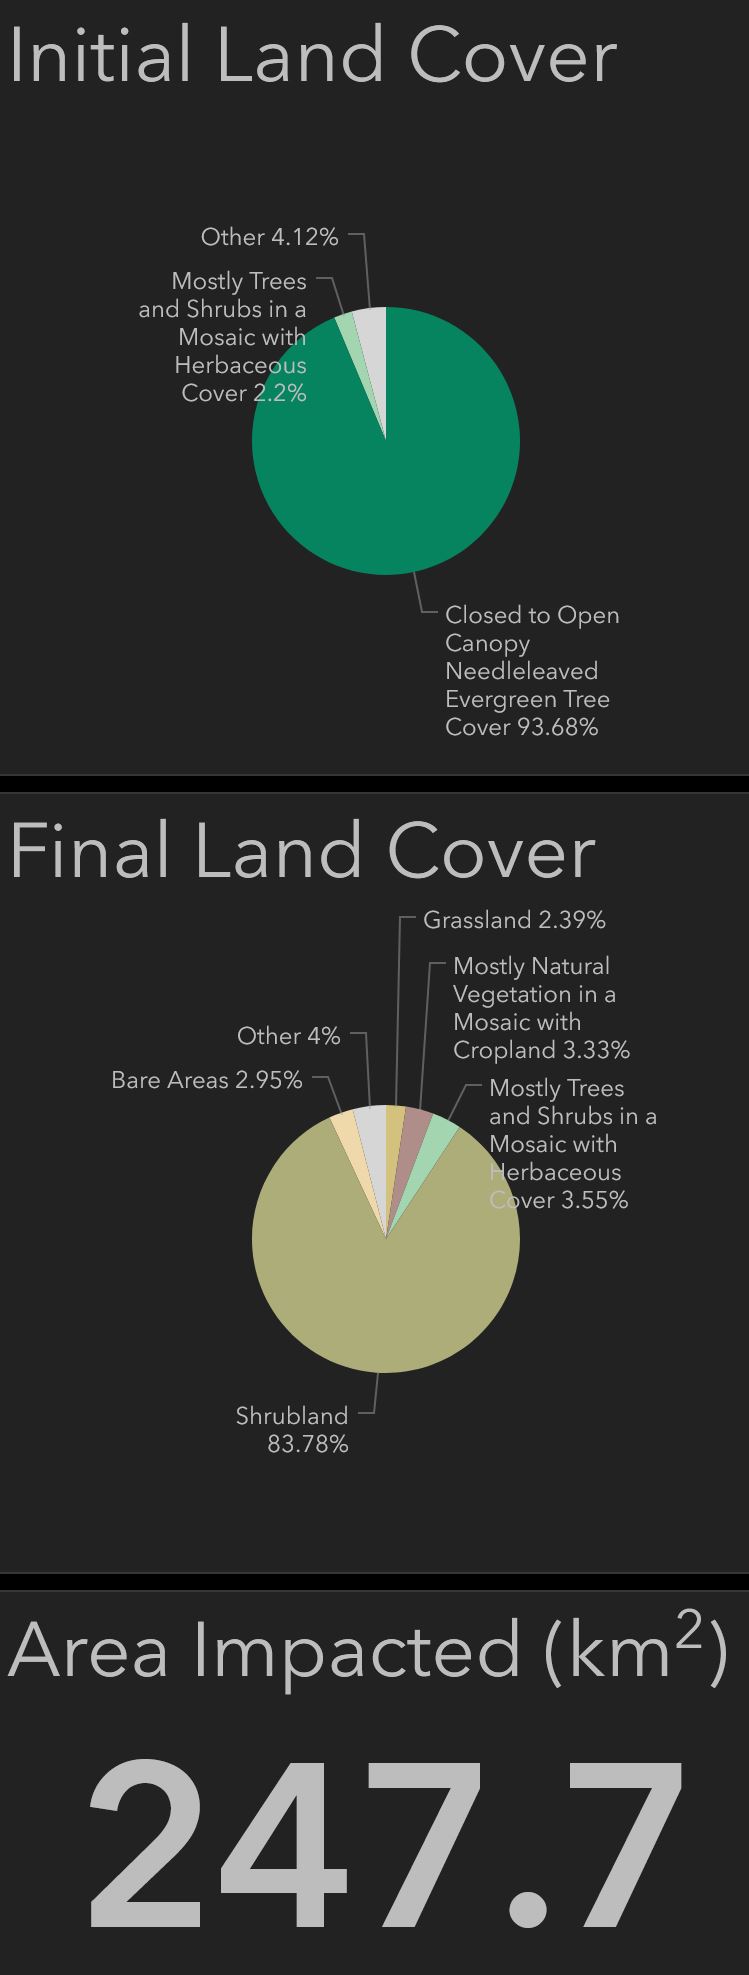
Below are the land cover change results for the 2018 Camp fire on the left and for the cumulative 2018 fires in California on the right. The pie charts provide a comprehensive breakdown of the changes and display the data as a user of the dashboard would see.
Camp Fire
California Fires
Figures and Maps
Analysis
One reoccurring challenge with developing the dashboard was inexplicably malfunctioning design elements. Upon first creating the dashboard and choosing the source web map, I attempted to add multiple selector elements. However, when choosing ‘Categories from Features’ for the selectors to use, instead of displaying a list available map features an empty list would show up. Eventually I just tried refreshing the browser and the feature list showed up correctly on the next attempt. Similarly, while configuring an action for one selector to filter the options on another selector, the filtering action would not work even though the same action functioned for filtering other elements. After refreshing the browser, the expected behavior was produced.
Another issue encountered was the inability to import modified web layers from ArcGIS Pro. Initially this project was developed in Pro and many of the same layers were imported and selection queries or clipping operations applied to restrict the extent of datasets to within the California state boundary. After completing the spacial analysis operations to create the final land cover change layer, an attempt was made to publish the whole collection as a web map from within Pro. Unfortunately this operation failed because many of the layers had selection queries applied and Esri would not permit their publishing. Therefore the attempt at publishing the whole map was abandoned and the critical land cover layer was saved locally so that it could be published. This layer was used in new web map with the entire datasets for the other layers added without the modifications made in Pro.
Conclusions
There are a few different improvements and future developments that could be applied to expand functionality or expand the study. While the focus of the project was to the land cover change within fire perimeters, the same process could be applied to look at changes outside of fire perimeters to explore how different the land cover changes are inside and outside of the fire perimeters. Given the extensive drought, for instance, it is possible that the changes in land cover may be so wide spread as to make the those within fire perimeters to be minor in comparison. Another future development that could be made to extend functionality would be to utilize a spatial analysis model to automate or streamline the creation of land cover change layers based on different time frames. The land cover layers provided by Esri as well as the fire perimeter layers by FRAP cover a wide range of years and would permit the extension of the project to cover many years.