Commute Time in Sacramento by Car and by Public Transit
Author: Shana Negin
School: American River College
Class: Geography 350: Data Aquisition
Date: December 2021
Contact Information: shana.negin@gmail.com
Abstract
I will compare transit time between driving and taking public transportation. I will choose 10 'home' addresses, locations in residential neighborhoods around Sacramento. I will choose one place of work. I will examine transit time from the 10 homes to the same work place. I will examine drive time and public transportation time.
Introduction
Some baseline statistics about Sacramento County from the US Census:
- 1.5 Million People
- 500,000 Households
- 994 Square Miles
- Mean Transportation Time to Work: 27.8 Minutes
Which, though this is a subjective opinion, FEELS like somewhat of an average city in the USA. Doing some math around this data, We can get a feeling for the shape and size of the city. Sacramento averages:
- About 3 people per household
- About 500 households per square mile
We want to examine how much time a commute takes, completed over public transportation, or in a car, from different places in Sacramento. Is there anywhere where public transportation could be a faster option?
We are choosing Sacramento for the sake of simplicity and due to my familiarity with the domain - this study could be completed over any number of neighborhoods and cities.
Finally, ten locations is probably not really enough samples to make any realistic conclusions, but it is a start. In the future, a larger database of addresses could be compiled and run through the same comparison for more conclusive results.
Background
Getting to work is something every person must do. Even in this time of remote work, where many jobs have moved to home offices, a large number of people must commute every day. How people travels to work affects many things. Here are a few:
- Personal
- Personal expenses
- Free time available
- Community Interaction
- Community
- Local air quality
- Road / Outdoor safety
With the number of cars in use increasing over the last century, we have witnessed children's outdoor play disintegrate, cities with average temperatures higher than the surrounding area, and a general disconnect between suburban dwellers and the community of the city where they work. Determining whether these factors are caused by or merely correlated to the rise of the automobile as the dominant form of transportation is beyond the scope of this project. As a start, we will just look at the state of pubic transportation and the state of driving to work, and build up some base data for why individuals continue to choose private car transportation rather than public transportation, despite the cost.
The Costs:
And yet we know that in the US, only 5% of commuters use public transportation.
This study is a gentle first step into an exploration of why most people choose to use personal cars, despite the multitude of benefits to not doing so.
Let us first learn a little bit about the public transportation available. The public transportation in Sacramento is provided by Sacramento Regional Transit (SacRT). For full disclosure, please know that I, the author, am currently an employee of SacRT, although this study is being completed independently, and for educational purposes only. According to the SacRT website,
Sacramento Regional Transit District (SacRT)...operates over 80 bus routes (fixed-route, microtransit and dial-a-ride), 43 miles of light rail serving 52 light rail stations and ADA paratransit services all within a 400 square-mile service area throughout Sacramento County, which includes service in the cities of Sacramento, Citrus Heights, Elk Grove, Folsom and Rancho Cordova.
SacRT is committed to operating a world-class transit system with state-of-the-art service. Buses and light rail trains operate 365 days a year. Buses operate daily from 5 a.m. to 11 p.m. every 12 to 60 minutes, depending on the route. Light rail trains begin operation at 4 a.m. with service every 15 minutes during the day and every 30 minutes in the evening.
I would like to emphasize that this project is not meant as a evaluation of SacRT as a service provider. I have chosen to examine this service because it is local to me, but I could easily look at other agencies around the country and expect to find similar results. The idea here is to look at the the transit with the understanding that the transit providers are doing their best with what they have,
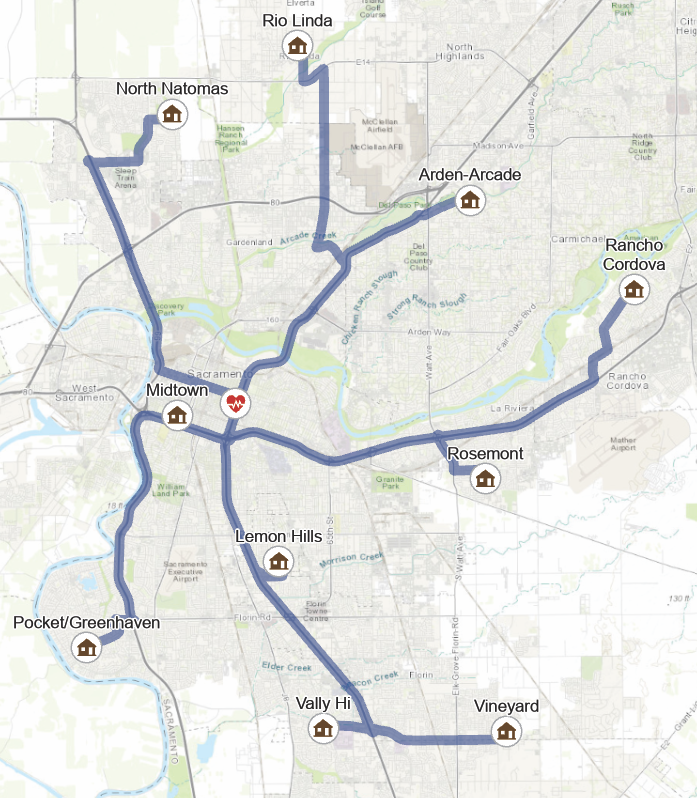
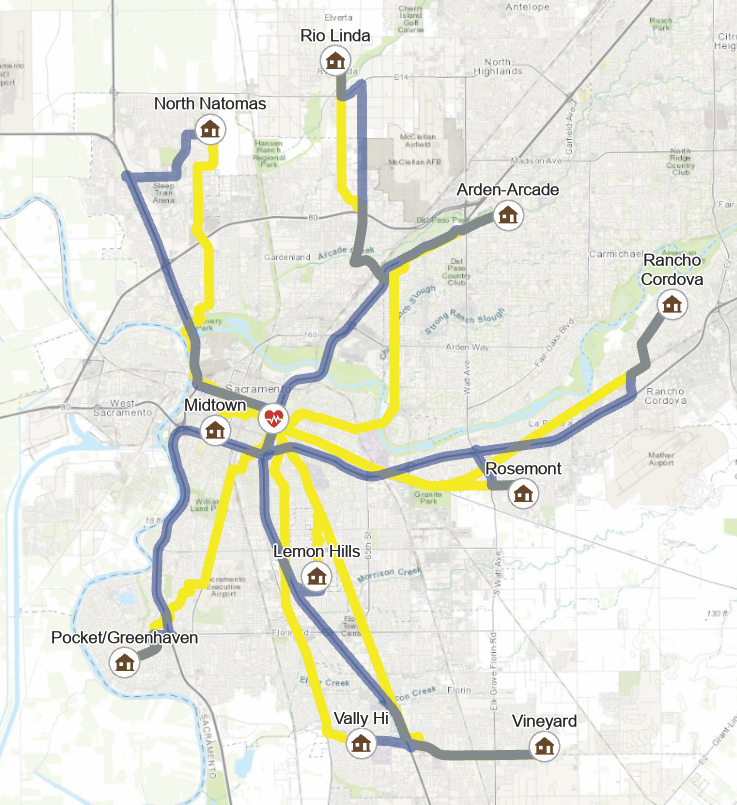
Location of Study
The study is about commute times, and thus needs start and end points. The study examines 10 different commutes. The end point of each trip is the same: Sutter Hospital, 2825 Capitol Ave, Sacramento, CA 95816. I chose this location because
- The location is central to the entire county
- I imagined it was a place where people with all sorts of careers could work. Someone living anywhere in Sacramento might work at this location
- It is the type of place where on-site work is necessary
The 'start' locations, which I will refer to as the homes, are addresses of actual residences, either a single family home or an apartment complex, picked from residential neighborhoods around Sacramento. I have picked locations that are all within the Sacramento Regional Transit District service area, in order to facilitate measurement of transit times.
| Neighborhood | Address | Lat | Long |
|---|---|---|---|
| Arden-Arcade | 4255 Winding Way, Sacramento, CA 95841 | 38.64189198 | -121.3641452 |
| Lemon Hill | 4812 Lemon Hill Ave, Sacramento, CA 95824 | 38.51565506 | -121.4505441 |
| Midtown | 1214 U St, Sacramento, CA 95818 | 38.56710744 | -121.4955572 |
| North Natomas | 1637 Dreamy Way, Sacramento, CA 95835 | 38.67267553 | -121.4970814 |
| Pocket/Greenhaven | 7540 Rush River Dr, Sacramento, CA 95831 | 38.48575172 | -121.5363981 |
| Rancho Cordova | 10679 Audubon Way, Rancho Cordova, CA 95670 | 38.61011272 | -121.2911954 |
| Rio Linda | 7053 Castle Creek Way, Rio Linda, CA 95673 | 38.69627377 | -121.440812 |
| Rosemont | 9190 Blue Point Lane, Sacramento, CA 95826 | 38.54410636 | -121.3582184 |
| Vally Hi | 8281 Sunbird Way, Sacramento, CA 95823 | 38.4570252 | -121.4312653 |
| Vineyard | 8324 Redbank Way, Sacramento, CA 95829 | 38.45559099 | -121.3495424 |
Methods
Public Transit Analysis
ACTION: Acquire Data
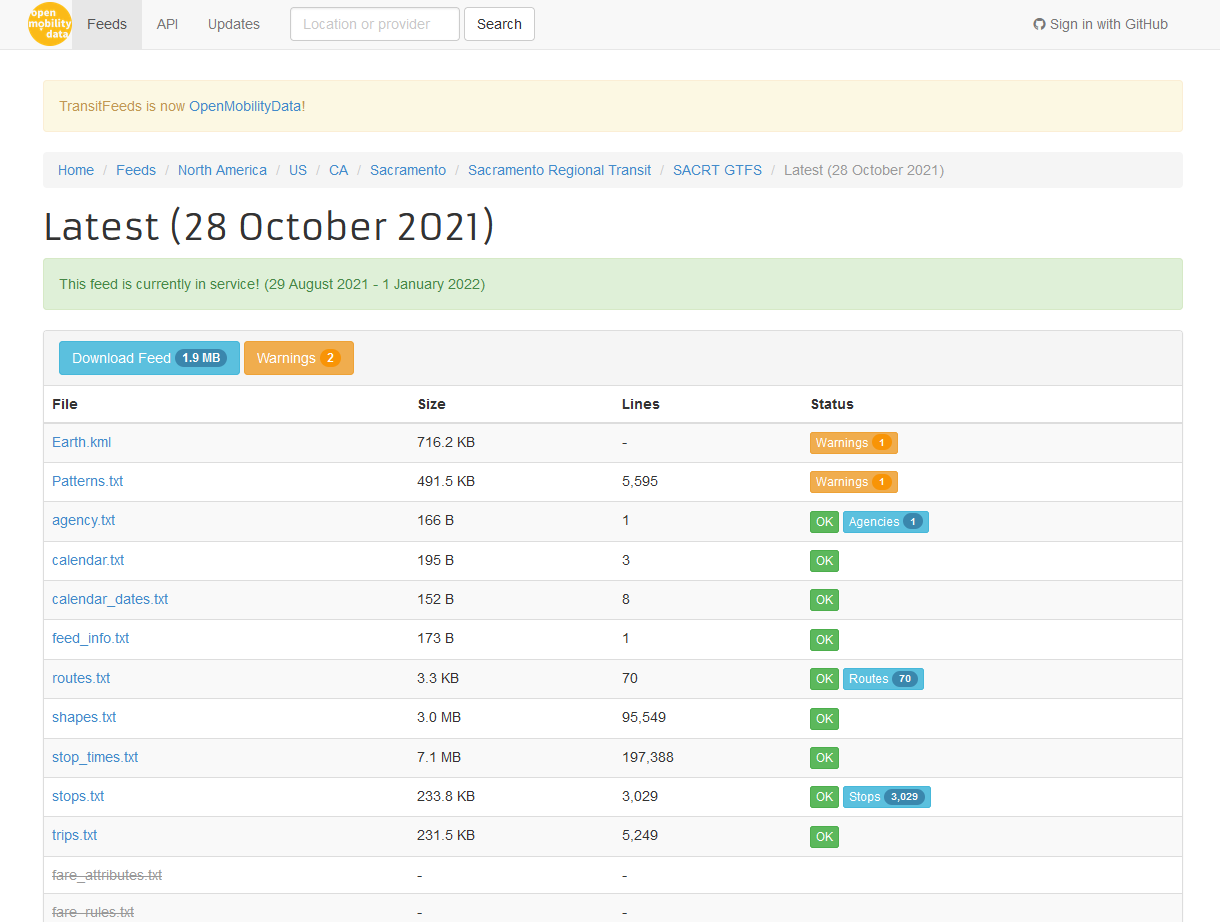
I created a Network Dataset using public transit data acquired through the GTFS (General Transit Feed Specification), a open data standard created by Google and TriMet Portland which creates a standard way to present transit data so that it would be easier to build tools to use that data. Interestingly, I found that the most updated GTFS data was not found on the actual SacRT site, but at a transit data aggregator caled OpenMobilityData (formerly called transitfeeds.com). This data does not include use of microtransit, dial-a-ride or complementary ADA paratransit services, but only use of fixed route, and results of this study will only reflect analysis of fixed route data.
ACTION: Create Dataset
To create the network dataset, I used a tutorial called Create and use a network dataset with public transit data published by ESRI.
ACTION: Create Routes
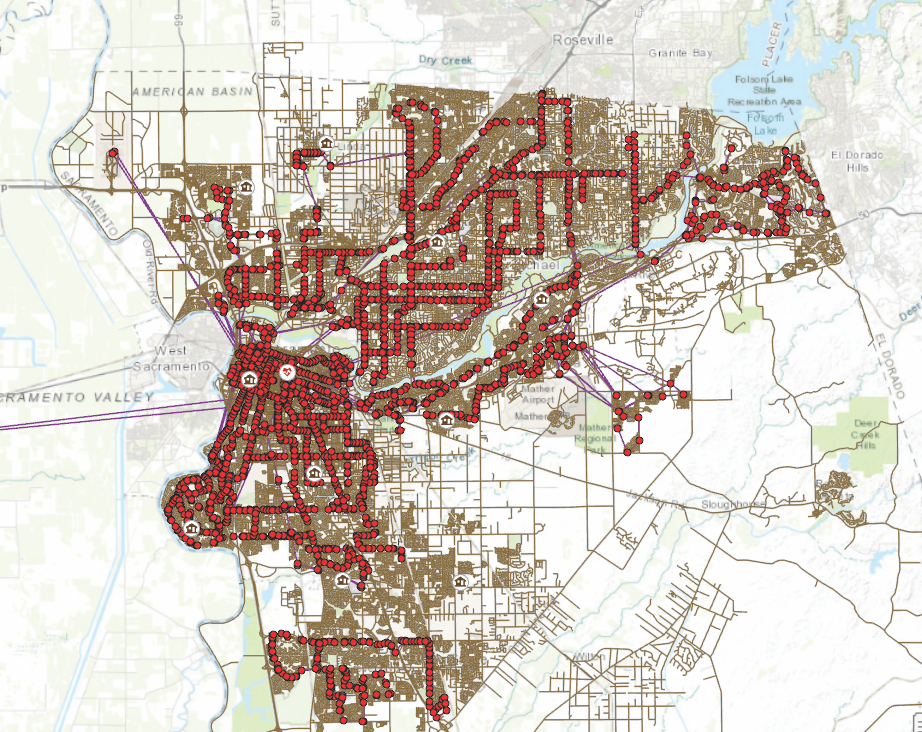
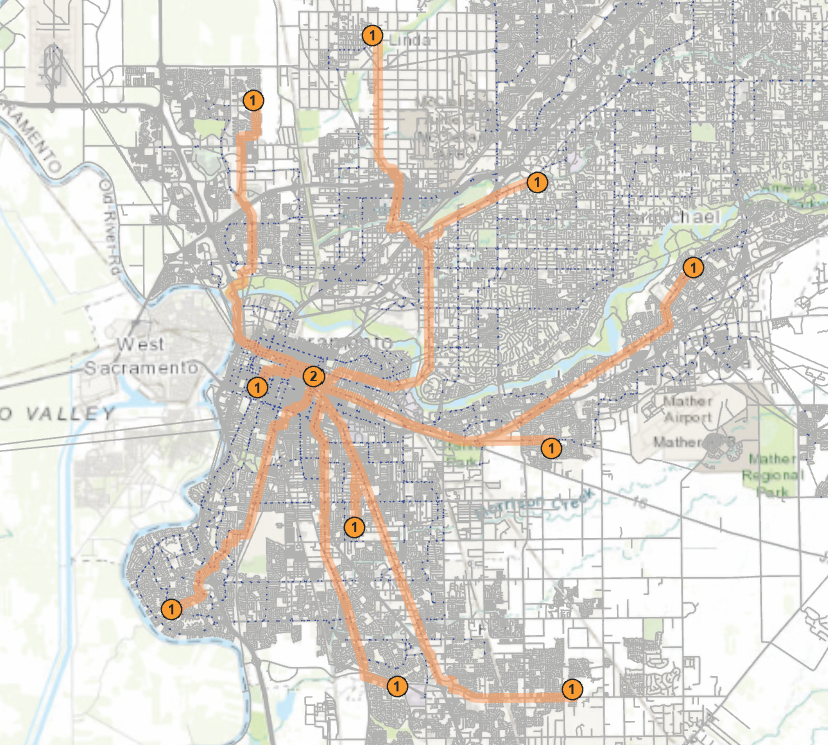
Within the network analysis toolkit is a Route Solver. I had to input my stops manually, but I used the data layer of lat/longs from my Home list to visually guide me to where to place the stops. I could edit a single table with different route names, and sequence numbers, to calculate all the routes at once.
If I could solve the manual clicking aspect of importing points to the Route Solver, this method would be scalable for a much larger dataset.
Drive Time Analysis
ACTION: Acquire Data (same data as public transit data)
Dataset is the location of study table, so all that is necessary is to get those coordinates into our route analysis
ACTION: Set Up HERE API
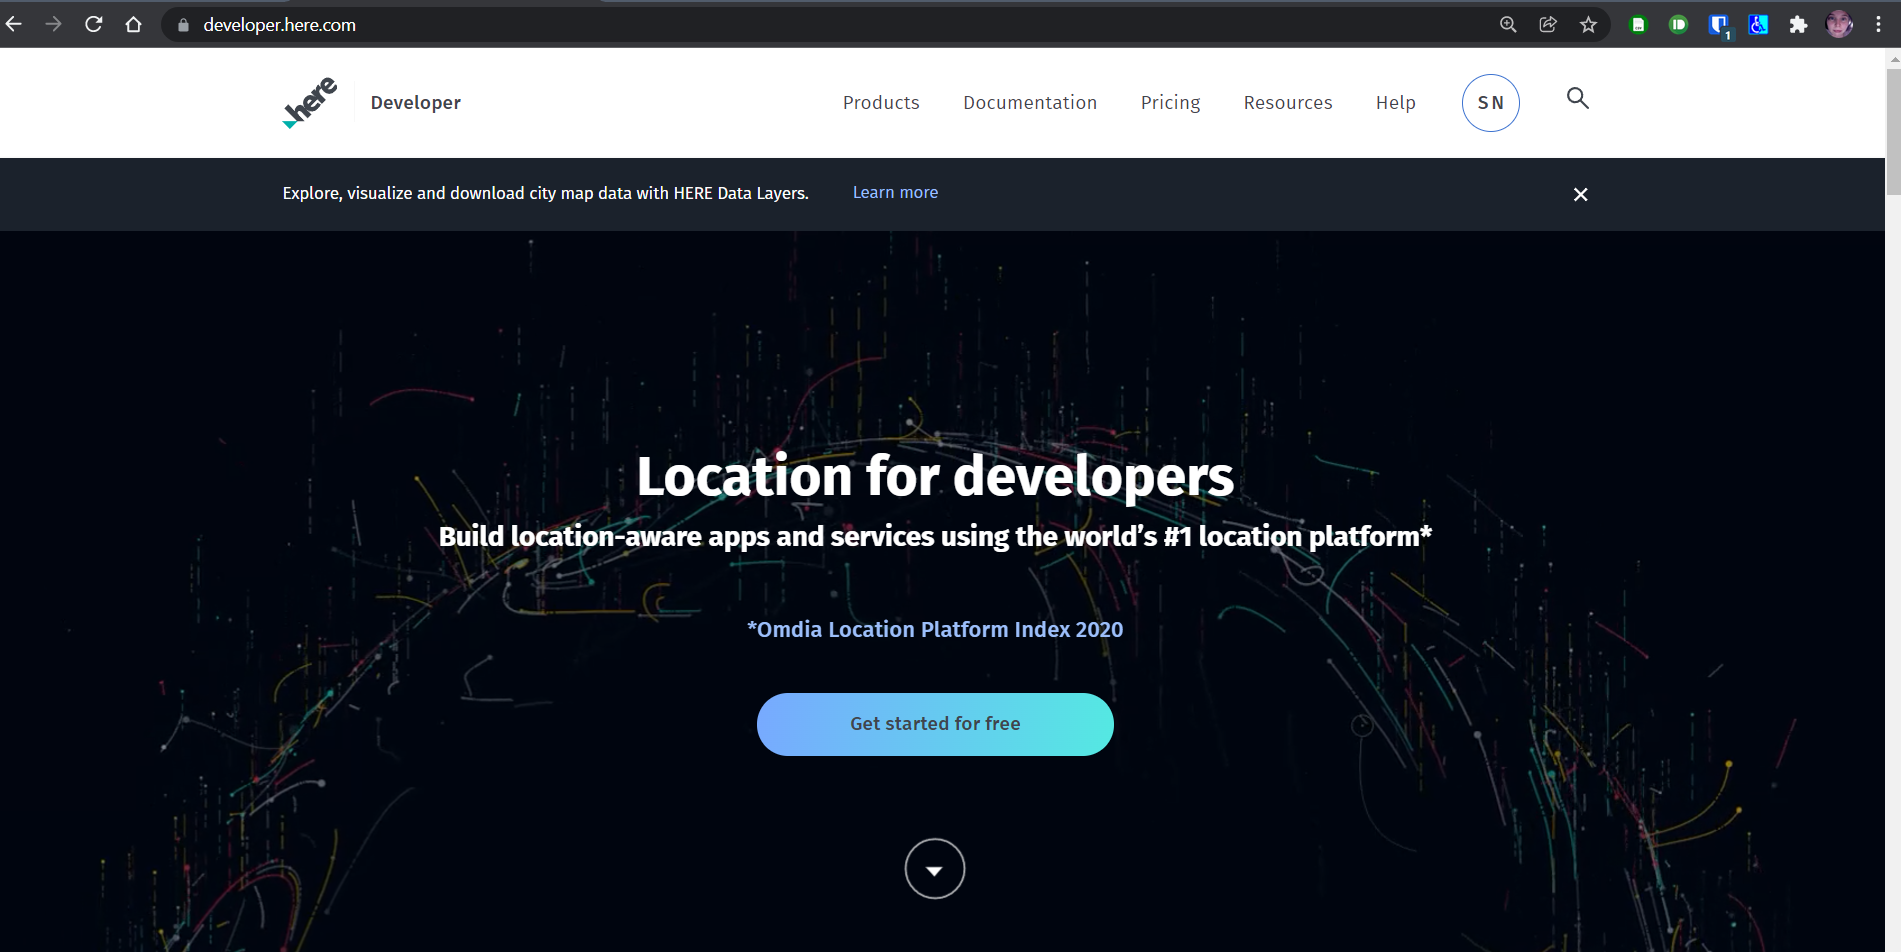
Originally I wanted to use the ESRI Driver Time Analysis, but they only offered service area analysis (which stops fall within 30, 45, 60 minutes, etc). Since I was looking for actual route time, I looked for another solution. I found HERE, a company that provides location data and tools. I signed up for their free API/Developer plan, which was enough for my needs. After some sifting, I was able to determine driving routes and drivetime for all of my locations in the form of tabular data as well as polylines.

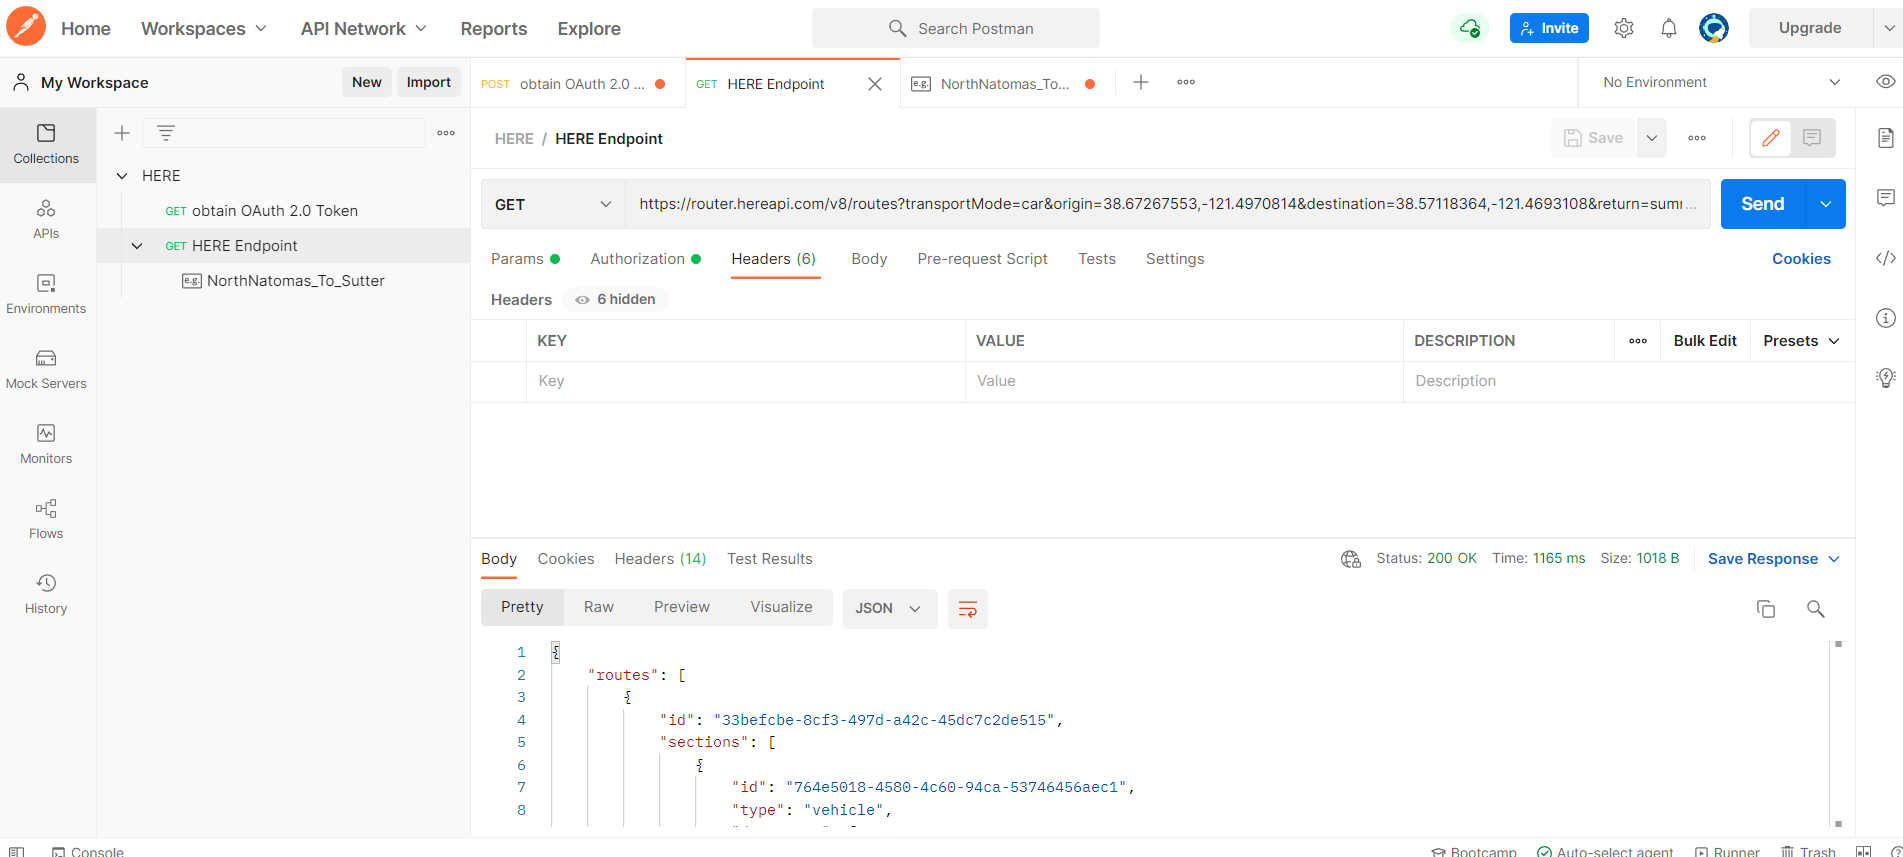
ACTION: Get data into ESRI
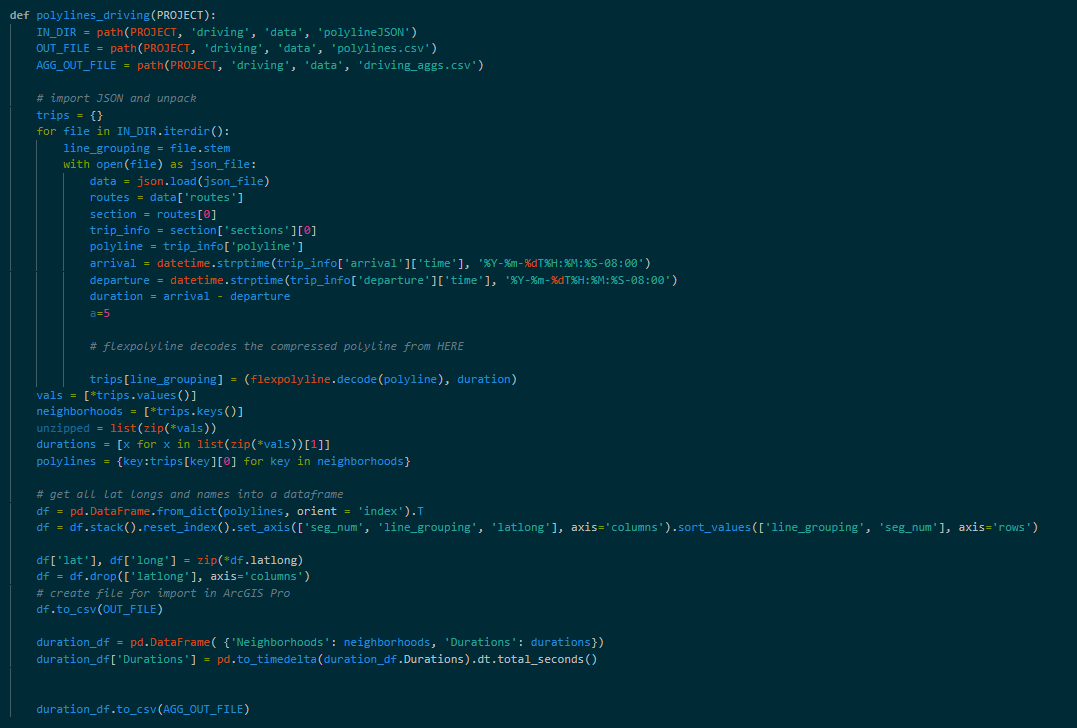
I wanted to visualize the data out of HERE next to my public transit data, which meant bringing the drive polylines into ArcGIS Pro. I did this through the use of the valuable pandas libary in python, as well as HERE's polyline decoder. When you request a polyline of a route, they provide it in a compressed form and it has to be decoded into the list of latitude, longitudes that ArcGIS Pro needs to plot it on the map.
Problem
Very late into the project, I realized the travel time calculations for the public transit are completely wrong. The table below shoes 3 hours commutes, which is not correct for the routes we are examining. While the routing is good, I will have to use another source for travel time.
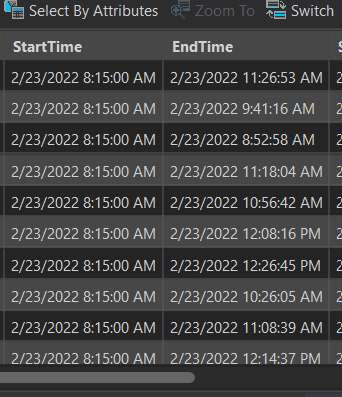
SO, I went back to HERE and redid the transit routing with the data from HERE instead of the ArcGIS Pro. I was able to get better trip time data.
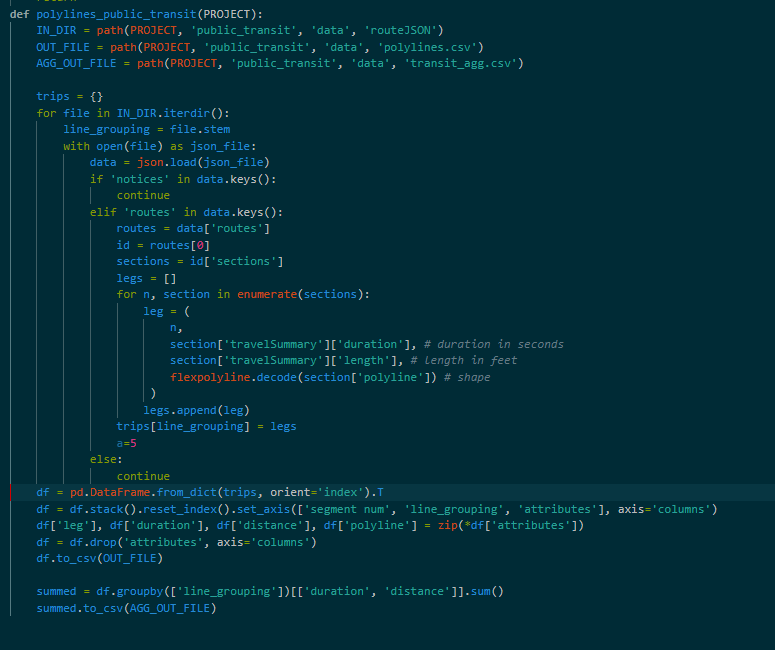
Code for processing Transit Data
Results
Difference in Travel Times to
Sutter General Hospital, 2825 Capitol Ave, Sacramento, CA 95816
| Neighborhood | Public Transit | Driving | Diff |
|---|---|---|---|
| Arden-Arcade | 1:14:00 | 0:11:25 | 1:02:35 |
| Lemon Hill | 0:37:00 | 0:10:04 | 0:26:56 |
| Midtown | 1:04:00 | 0:07:02 | 0:56:58 |
| North Natomas | 1:14:00 | 0:21:56 | 0:52:04 |
| Pocket Greenhaven | 0:58:00 | 0:16:49 | 0:41:11 |
| Rancho Cordova | 0:55:00 | 0:18:04 | 0:36:56 |
| Rio Linda | 1:04:00 | 0:21:43 | 0:42:17 |
| Rosemont | 0:47:00 | 0:14:07 | 0:32:53 |
| Valley Hi | 1:04:00 | 0:16:57 | 0:47:03 |
| Vineyard | No Transit Option | 0:19:34 | |
| Average | 0:59:40 | 0:15:46 | 0:44:19 |
Analysis
In examining the results of this dual mode travel analysis, I look to provide some data to back up the claim that we don't take public transportation because it takes too long. In the above results, we see
- Average difference in travel time: about 45 minutes. (45 minute MORE for public transportation)
- Greatest difference: Arden-Arcade, which takes about 12 minutes to drive and over an hour to take transit.
Considerations
In order to complete this project in the time frame and with the resources I had immediately available, I made a few assumptions within my data
- To perform a network analysis on the public transit data, I had to have a column of data that told us which streets were restricted to pedestrians. I did not have this data, so I just made an assignment that said that highways and ramps were restricted to pedestrians and other roads were not. I also had to assign a road class to each road, which I used the same class designation from the centerlines gdb which distinguished between highway, ramp, major road, local road, etc, and made best guess assignments based on this labeling. If I were continuing this exploration, I would put some more effort into seeing if there were more accurate descriptions of all of the road restrictions.
As a check for accuracy, I would like to discover how close our process, using ArcGIS Pro Network Analysis with our layers, to the results from Google Directions, which is the conventional tool for predicting transit time. To do this, I would need to plot each trip in google maps and view the results
Conclusions
As a fan of public transit, it is had for me to admit it, but it is pretty clear why people don't want to take public transit to work - it just takes so much more time. It takes enough more time that all of the detriments listed above become acceptable consequences.
Next steps: determine why transit takes so much time. Are the routes not there? Are the runs not there? What is the issue? Stay tuned.....
References
- https://www.webmd.com/balance/features/driving-is-hazardous-to-your-health
- https://www.thesimpledollar.com/save-money/is-it-really-cheaper-to-ride-the-bus/
- https://www.theguardian.com/cities/2019/may/21/how-can-we-get-our-children-playing-outside-again
- https://www.business2community.com/space-science/commute-killing-environment-01484840
- https://mass.streetsblog.org/2019/08/20/exhaust-pipes-are-making-bostons-heat-waves-much-much-worse/ https://www.census.gov/newsroom/press-releases/2021/public-transportation-commuters.html
- https://pro.arcgis.com/en/pro-app/latest/help/analysis/networks/create-and-use-a-network-dataset-with-public-transit-data.htm
- https://transitfeeds.com/p/sacramento-regional-transit/67
- https://gtfs.org/
- http://www.sacrt.com/aboutrt/