Utilization
of GIS in Analysis of Climate Change Predictions for Santa Cruz County
Kelsea
Ranks
GEOG
350 Fall 2021
Veisze
Abstract
Comparison of average maximum temperatures from the
current decade and predicted average maximum temperatures for the middle and
end of the century.
Introduction
Climate change is a present and persistent threat to
California’s diverse ecosystems. Ecosystems such as the coastal redwood forests
in Santa Cruz County are particularly at risk. As the impacts of climate change
are observed across the state, new methods of predicting and tracking these
changes are emerging
Background
I lived in Santa Cruz from 2015 to 2019 when I
attended university there. I came to love the redwood forests around the campus
and often wondered what the changing climate would mean for the area. I
experienced the typical mild weather that the region is known for, but I also
experienced weather anomalies. I remember a summer day in 2018 where the
temperature in downtown Santa Cruz was over 100 degrees, a rarity, but a
situation that could become more common in the future as temperatures are
predicted to rise. Historically, the average maximum temperature in Santa Cruz County
is around 67.5 degrees, but climate models predict that the average maximum
temperature by the end of the century could be 71.9 to 74.5 degrees (Langridge,
2018).
Methods
To detail the use that GIS has in modelling climate
change data, the following maps were created in ArcGIS Pro using data from the
California Heat Assessment Tool (CHAT) (See figures 1-3). Figure 1 displays
average maximum temperature data from 2011 combined with data predicted until
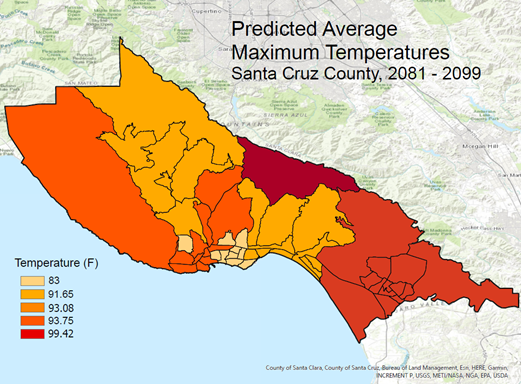
2030. And figures 2 and 3 display predicted maximum temperatures for 2051-2070
and 2080-2099, respectively. These future time periods were chosen because the
represented the middle of the century and the end of the century. The county of
Santa Cruz is divided into its census tracts to better reflect the temperature
changes throughout the county.
Results
Figure 1
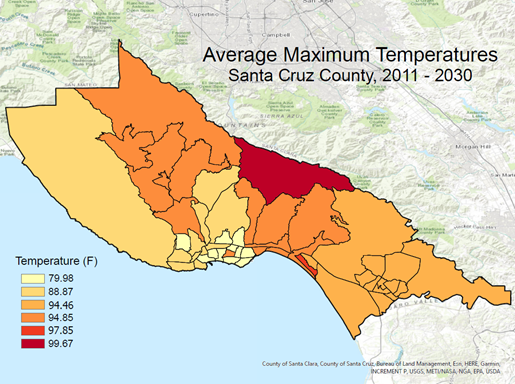
Figure 2
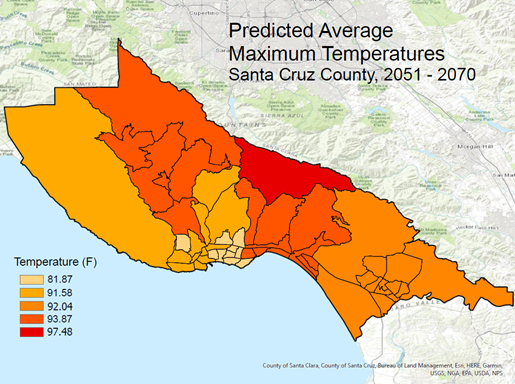
Figure 3
Analysis
The available data already showed that temperatures
were expected to increase over time, but the utilization of GIS allows for the
data to be visualized in a way that makes the temperature changes more obvious.
I was surprised to see that some tracts had a decrease in temperature over the
course of the century. Opposed to the tracts in the county that had lower
average maximum temperatures, which showed an increase in temperature over the
century. For instance, in the area of downtown Santa
Cruz, the average maximum temperature is 79.9 currently, but is predicted to
rise to 83 degrees at the end of the century. The gap between the coolest and
hottest areas of the county is predicted to decrease from a difference of
almost 20 degrees to around 16 degrees at the end of the century.
Conclusions
GIS software like ArcGIS Pro is incredibly helpful in
creating visuals out of data that is hard to visualize. The maps created for
this project provide a useful way to visualize changing climate data
side-by-side. By creating GIS climate data, counties in California are better
able to predict where in their jurisdictions action is needed to mitigate or
prepare for the effects of a changing climate.
References
(n.d.). Retrieved from California Heat Assessment
Tool: https://www.cal-heat.org/explore
Chornesky, E. A., Ackerly, D. D., Beier, P., Davis, F. W.,
Flint, L. E., Lawler, J. J., . . . Weiss, S. B. (2015, March). Adapting
California's Ecosystems to a Changing Climate. BioScience, 65(3),
247-262. Retrieved 10 2, 2021, from
https://academic.oup.com/bioscience/article/65/3/247/237354
Cowell, P. J., & Zeng, T. Q. (2003). Integrating
Uncertainty Theories with GIS for Modeling Coastal Hazards of Climate Change. Marine
Geodesy, 5-18.
Langridge, Ruth. (University of California, Santa
Cruz). 2018. Central Coast Summary Report.
California’s Fourth Climate Change Assessment.
Publication number: SUM-CCCA4-2018-006.