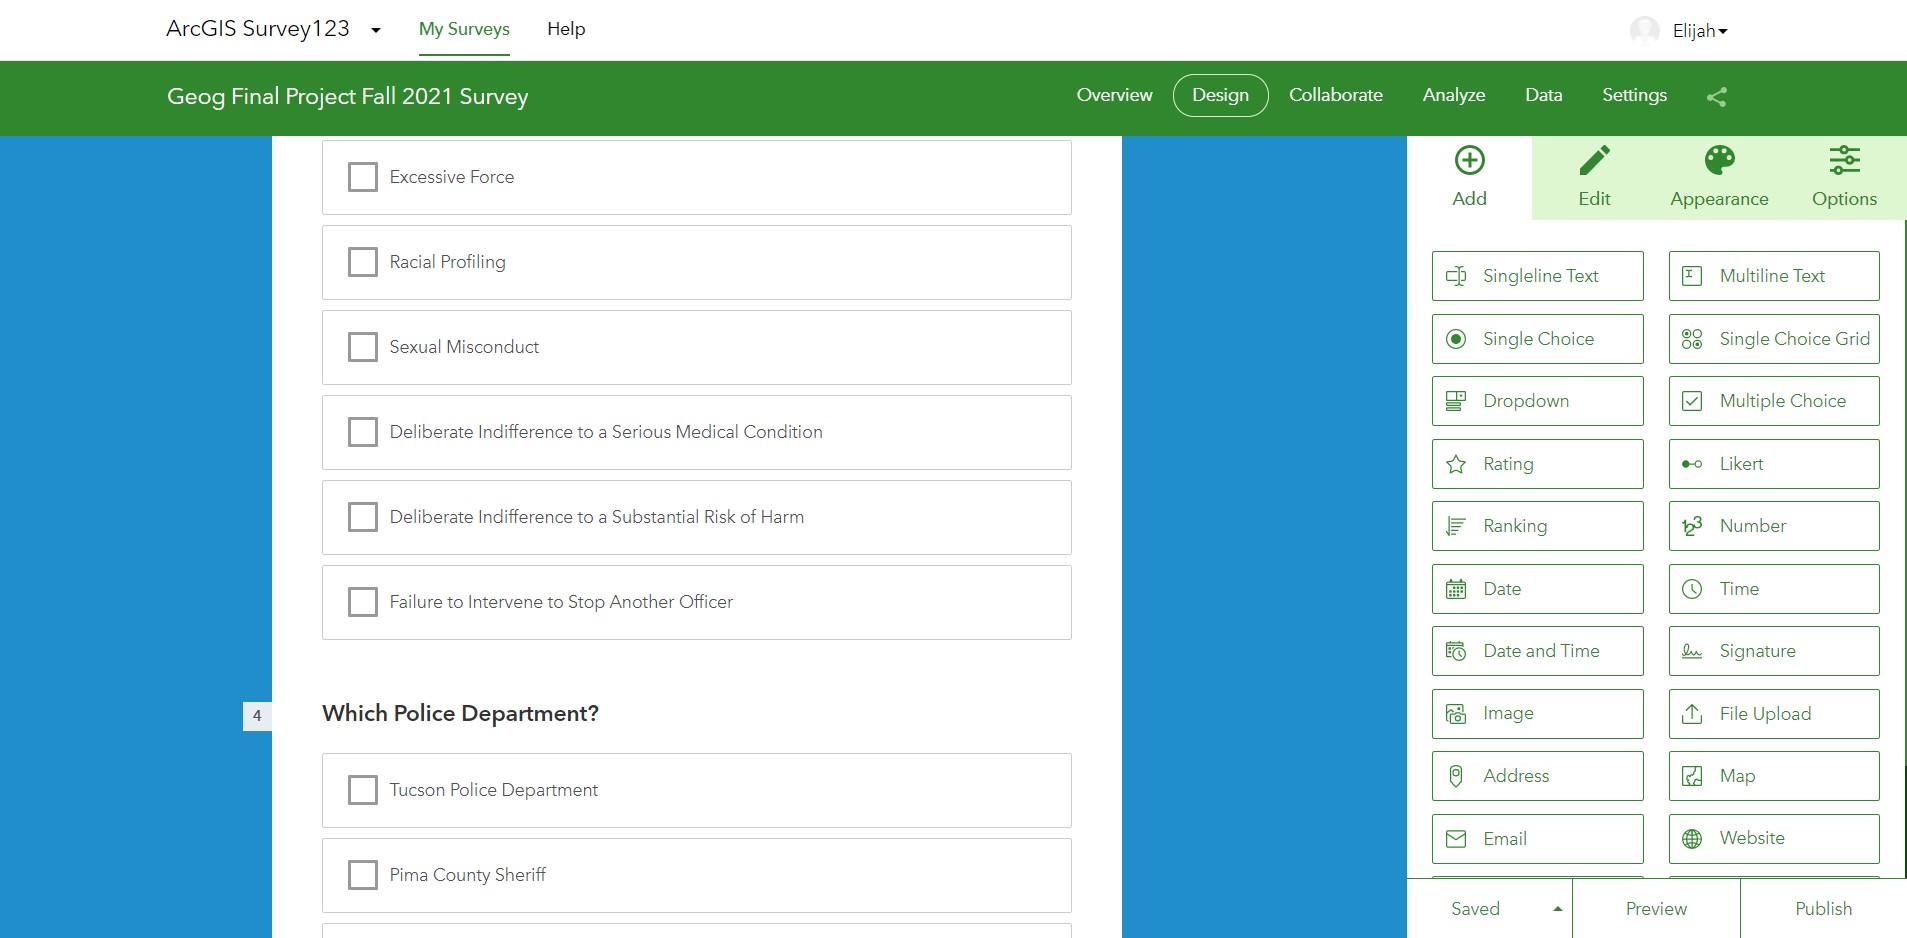
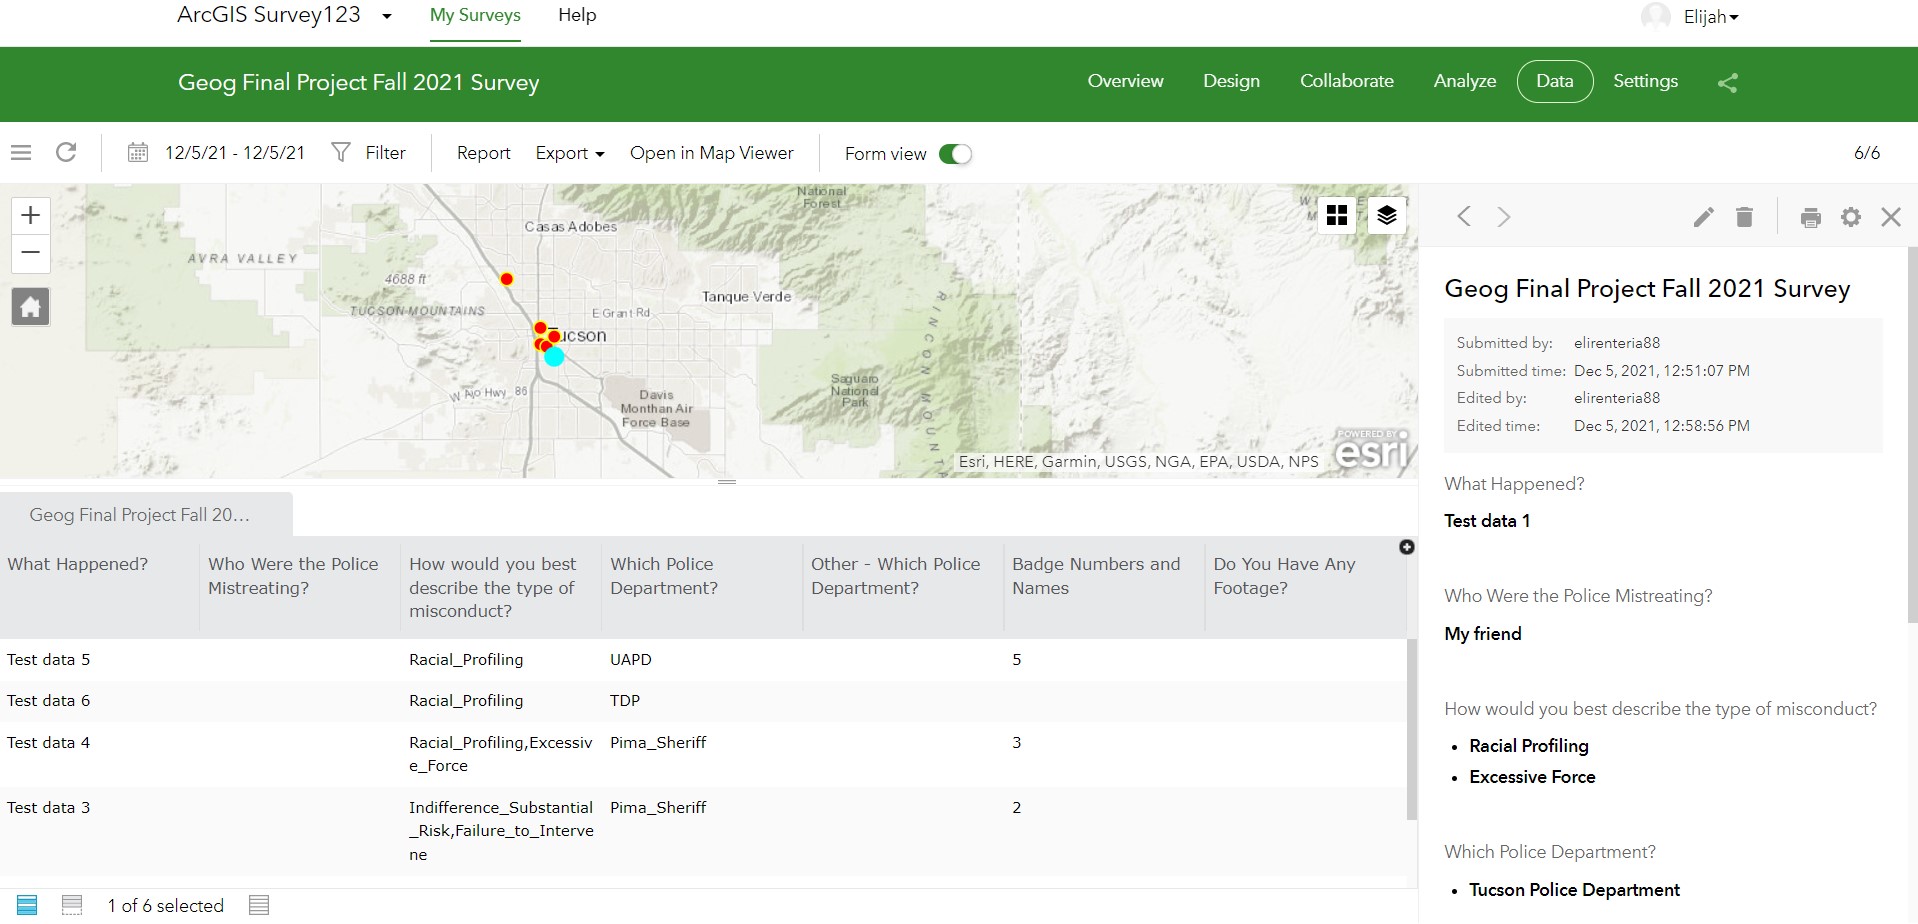
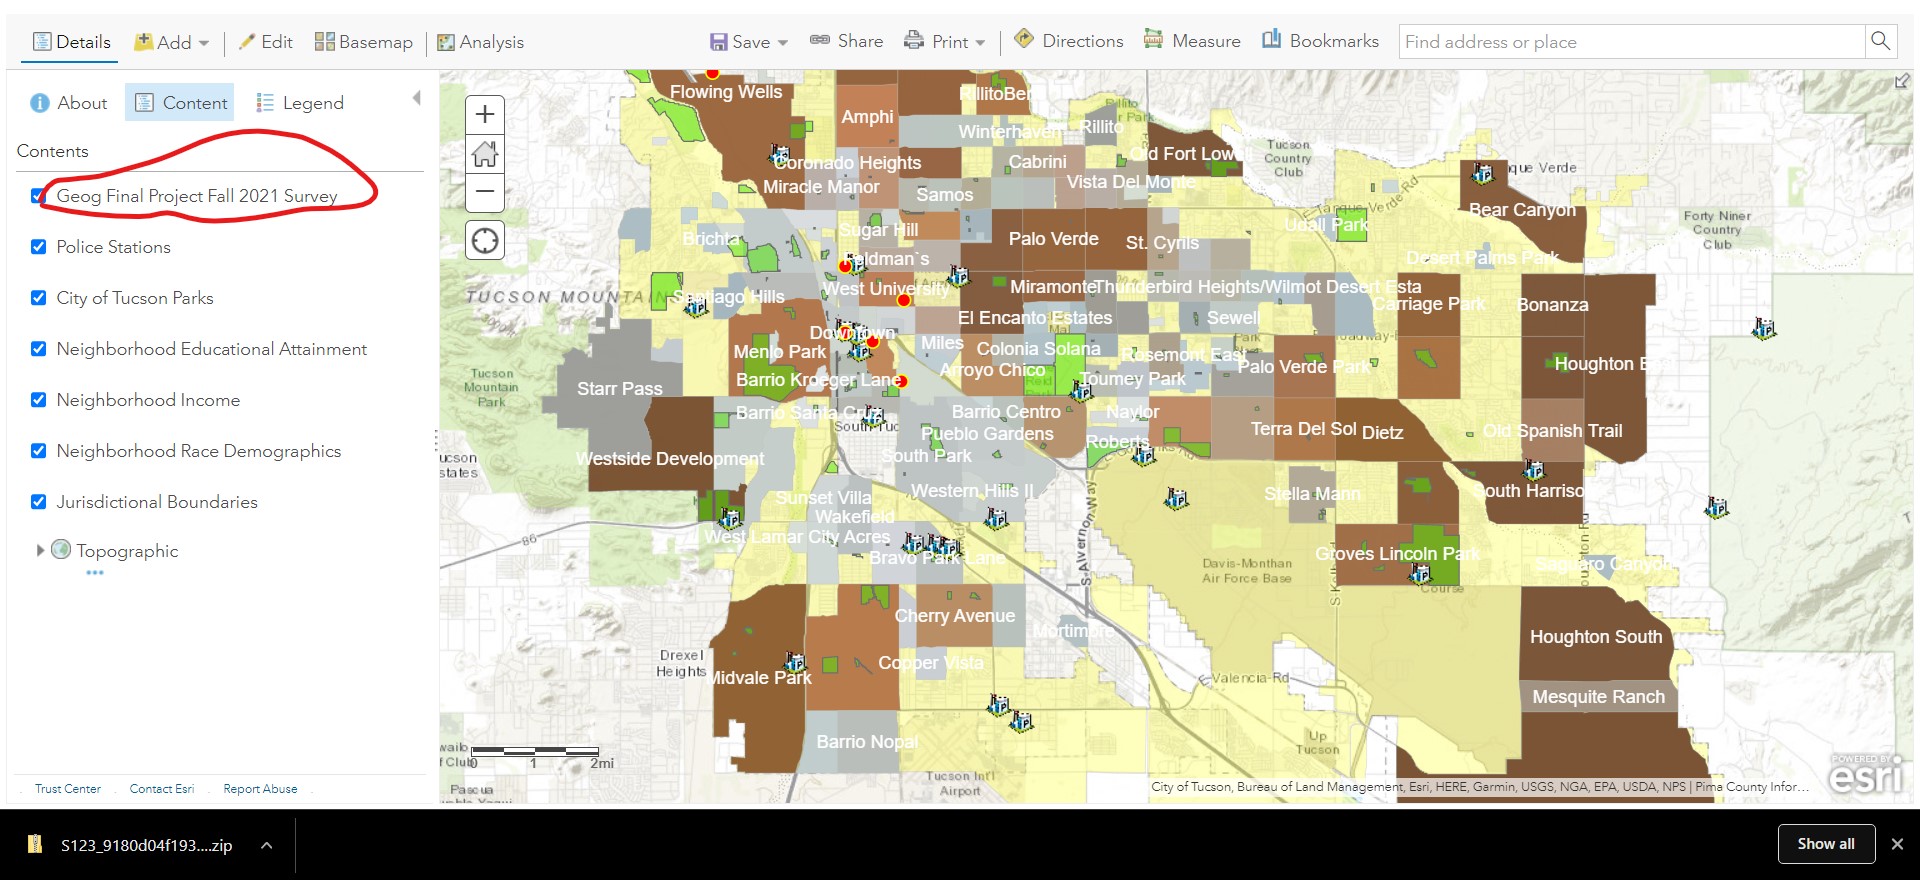
Title
Police the Police
Survey - Web Map - Dashboard

Author Information
E. Renteria
American River College, Geography 350: Data Acquisition in GIS; Fall 2021
elirenteria88@yahoo.com

Abstract
This paper covers the process, methods, and results of creating a survey123 application, webmap, and dashboaord that could assist watchdog orginizations in collecting data on police misconduct. The paper also includes an analysis and discussion of potential issues with the application, and ways in which this project could be expanded. Introduction
This project focused on creating a webmap and accompanying survey123 application that aims to crowdsource and collect data on police misconduct. The data was then presented in a dashboard. This project’s applications will help ordinary citizens photograph, record, and otherwise document, when law enforcement abuse their power. It is already common to see videos on the news, recorded by bystanders, of police engaged in misuse of their authority, be it police brutality or racial profiling. This project aims to use a citizen science approach to crowdsource incidents, and collect data on individual officers and/or areas in which police misconduct occurs more frequently. While this project is focused on the City of Tucson, AZ, and only contains feature layers for that geographic area, it’s applications could be expanded to other cities and regions in the United States. The web map includes a variety of publicly available data from the City of Tucson’s GIS Division, including census data on income, educational attainment, and racial demographics organized by neighborhood, as well as parks and police stations. The survey application, made using survey123, contains eight questions ranging from multiline texts, multichoice questions, as well as map, and file upload capabilities. The survey allows users to collect badge numbers, indicate locations, write what happened, upload images and videos, and indicate the type of incident or misconduct that occurred. This data can then be used by researchers of watchdog groups that document police misconduct. The data was also displayed in a dashboard for easy use and interpretation by a user.

Background
While taking the GIS certificate classes at American River College, I noticed that many instructor examples of GIS in action involved crime, either collecting data for police departments and cities concerning crime or analyzing geospatial data related to crime. Each example, in several classes over the course of the program, was tacitly in support of law enforcement. Esri even offers a suite of services marketed towards law enforcement (Esri Police Resources). In light of the Black Lives Matter uprising over the summer of 2020, I felt that I should address this institutional bias in my final project, and design an application that could be used to support activists in the struggle against law enforcement misconduct and police brutality. In doing research for this project, I discovered that GIS researchers as far back as 2001 were working to address this issue as well. In an article by Lawton, B. A. et al, Using GIS to Analyze Complaints Against Police: A Research Note, focused on documenting citizen complaints against the Philadelphia police department using GIS. Over a two year period the researchers gathered approximately 2,000 complaints filed against the Police Department and used ArcView GIS to geocode them to two separate addresses, the location of the complaint and the complaintee’s address (2001). This allowed the researchers to associate complaints with census data and create hotspots of police complaints, a similar goal to what I would hope this project could achieve.

Methods
I wanted to select data that I knew would be accurate and created by a reliable institution. Since I was focusing on the City of Tucson, I decided to see if the city had a GIS division that produced regularly updated data. The Tucson Open Data website had the data I needed for the webmap application. I wanted specific data for the webmap that might be useful alongside the data collected by the survey application, so I looked at what data the GIS division of Tucson maintained. I was able to get all the data I needed from the City of Tucson. For the survey I wanted something quick that could be used on the phone. I used survey123's drag and drop functionality to create eight questions. To collect data for the survey, I decided it was best if I supplied all the survey questions myself. I did not think I would get any responses from friends and family, and did not think making the survey public would be good idea. I answered the dropdown survey questions and randomly dropped pins throughout Tucson. I did not provide descriptions of any police conduct, real or otherwise. I then added the survey data as a feature layer to the webmap. The dashboard was created using Esri's apps tools. The webmap was added the dashboard, as well as a variety of widgets.

Results
The webmap resulted in five layers that I thought would help put the data collected with the survey application in perspective. I landed on income, educational attainment, and racial demographics sorted by neighborhood, as well as parks and police station locations for the City of Tucson, to see if data collected might be aggregated close to these areas (Figure 3). With the survey application, I aimed to collect data that could be used to sort incidents in a useful way. I also wanted geospatial information, and information that might help locate where the incident took place. I also wanted to make the survey accessible and quick to fill out. I wanted a maximum of ten questions, and ended up with eight. Two multiline text questions where the user could explain what happened and to whom. Two multiple choice questions for the user to select what type of misconduct occurred (Figure 1) and by what law enforcement agency. I selected the types of misconduct based on the Justice Department’s law enforcement misconduct page. The law enforcement agencies were the most common in the area from personal experience, the Tucson Police Department, Pima County Sheriff, University Police, and Private Security. A single line text question for badge numbers, and a question to upload photos and a question to add any links to external video footage. The final question allows the user to drop a pin at the location where the event occurred. The individual survey results could be viewed aggregated in survey123 (Figure 2) The dashboard (Figure 4) incorporates the web map and a selector for the race, income, and educational attainment layer that zooms in to the neighborhood and generates a popup. It also includes a reported case counter, and a recent incident list that allows you to click on a recently reported incident and zoom in on the map. It also has a chart and links back to the survey application.

Figures
Figure 1
this is Figure 1


Figure 2
this is Figure 2


Figure 3
this is Figure 3


Figure 4
this is Figure 3


Analysis
I found some issues with creating webmap in the dashboard. I was unable to find an easy way to switch layers on and off, although it is possible within the map widget. The labels were also distracting, and there were issues in arcgis online formatting them so that they only appeared when zoomed in. I was able to fix several of the layers, but some didn’t work correctly. I initially wanted to focus on Los Angeles, but found that data for my hometown of Tucson was smaller and more accessible for a proof of concept. I also decided to not circulate the survey to friends and family or the public to collect test data, because of the sensitivity and implications of the data that could be collected. Instead I filled out several surveys with a little information just to see if the project would work. Other than that the process went smoothly.

Conclusion
I am actually quite pleased with the final project result. The survey integrates well with the webmap and the dashboard, which was my biggest fear. I think the services could be improved with input from activists and groups focused on this type of work, especially with making the survey questions more accessible and targeted, as well as what data would be most useful to display on a dashboard. My hope would be that the dashboard would be something that users, perhaps using social media, could easily interpret and use for educational purposes and I think input from relevant groups would be helpful in that regard. At the moment, some of the dashboard applications are not very self explanatory, and could be improved. Overall, I think this project serves as a proof of concept, and shows that this type of data (geospatial police misconduct data) can be collected from the public and utilized in useful ways. Future research could look at how activists are collecting data on police misconduct, and work together with organizations to create a more focused application. .

References
Lawton, B. A., Piquero, A. R., Hickman, M. J., & Greene, J. R. (2001). Using GIS to Analyze Complaints Against Police: A Research Note. Justice Research and Policy, 3(2), 95–108. https://doi.org/10.3818/jrp.3.2.2001.95