Title Acquiring Wildlife Data in an Urban Environment | |||||||||||||||||
|
Author Dickie Rigdon American River College, Geography 350: Data Acquisition in GIS; Spring 2021 Contact Information (email: w1937306@apps.losrios.edu) | |||||||||||||||||
|
Abstract My final project centers on the surprising existence of a keystone species thriving in small creeks surrounded by urban development. The animal species present is the American Beaver. Even though there is sparse woodland, low water flow for most of the year, and steady destruction of dams by the city government, the beavers continue to exist in these marginal environments. The beaver is considered a keystone species because it creates an ecosystem with its dam building activity and provides essential habitat for other species including fish, bird, amphibian, insect, invertebrate, and plant species. Importantly, beaver ponds also allow recharge of groundwater. California is suffering through years of drought and every drop of precious water harvested through recharge is money in the bank for future supply needs. | |||||||||||||||||
|
Introduction The city removes the beaver dams on occasion which drains the ponds. Through phone research, I found they do so for claims of flood control of private property. Once drained, the vital wetland habitat is lost and all that remains is a stream trickle. The project is focused on a hyperlocal area (one small beaver pond) and seeks to argue for or against the commonly held belief that beavers and their dams are a nuisance only. The negative factors addressed are infrastructure damage/disturbance, property damage (tree loss), and flooding of private property. Through Data Acquisition and GIS, I seek to confirm or deny some of the beaver stereotypes. The resulting data and analysis do show a surprising outcome. | |||||||||||||||||
|
Background Upon moving to Rocklin, CA and subsequent walks near a neighborhood creek, I noticed what appeared to be a beaver dam. Interested, I looked closer and found it was a beaver dam and also found recent activity of fresh mud and gnawed sticks on the dam. On daily walks with the dog or bike rides with the kids, I kept an eye on the beavers and began collecting photo data of the dam and the pond through the seasons. Looking closely at other areas along the creek, I noticed even more dams and activity. Even though constrained by urban development, the headwaters of Pleasant Grove Creek proved to be a fertile habitat for the beavers and myriad wildlife drawn to the ecosystems they create. I have worked previously with GIS on this creek and its open space with Geog 90 (Introduction to GIS, Sierra College) and Geog 342 (Remote Sensing, American River College). However, those studies were broader in scope (GPS Mapping and Drone Mapping respectively) and not specifically targeting one species and its behavior. My presentation may show some of this previous GIS work of the study area. | |||||||||||||||||
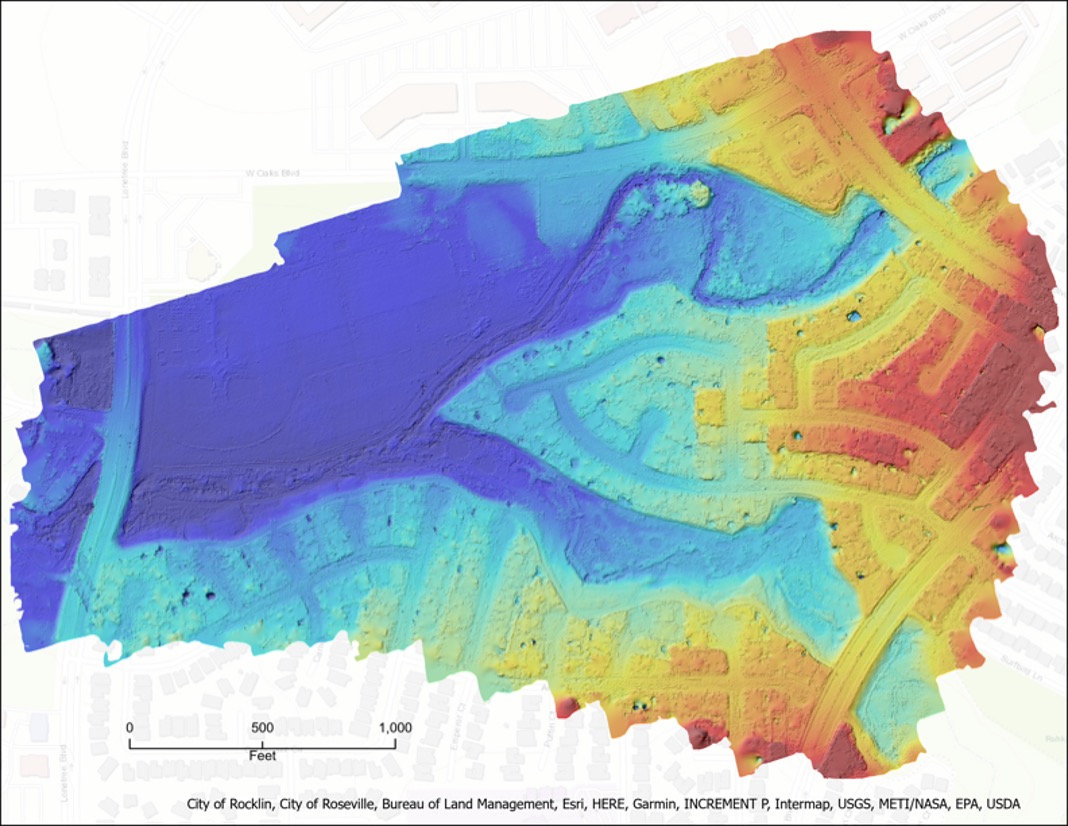
The photo, at right, is a DEM of the beaver study area made with consumer level drone (Geog 342 Remote Sensing). The class data is not yet posted online. Google Map of Study Area Quick real world view of the beaver pond area in Rocklin, CA |
| ||||||||||||||||
|
Methods Some of the methods used to gather data that seemed pertinent to answer my questions. Speak with City about why they remove dams. Get cadastral and elevation datasets from City (ArcGIS Portal). Get Manhole elevation data from SPMUD read only Webmap. Get elevations and locations on my GPS/iPHONE field survey. Get FEMA 100 year flood zone data (ArcGISPortal). | |||||||||||||||||
| To test for Private Property and Potential Flooding:
• Rocklin cadastral layer to show parcels and neighborhoods near the study creek • FEMA 100 year flood plain layer • Top of Dam Elevation (GPS) • Elevation with 1' Contour Lines To test for Infrastructure Damage / Disturbance:• Manhole locations and height data • Top of Dam Elevation (GPS) To test for Property Damage (trees):• Visual Survey and GPS enabled Photos |
| ||||||||||||||||
|
Results For flooding of private property and infrastructure test, the Garmin GPS yielded high elevation results and those were excluded. Elevations for Sewer (Manhole Rim Height), Top of Beaver Dam, and Cadastral (Parcel) are given in the table below. Note, the FEMA 100 Year Flood Zone height is 130' compared against the City One-Foot Contour Lines Layer. The one-foot contour lines were derived from LiDAR that was interpolated. Sewer Height from SPMUD Webmap. City Top of Dam Height estimated against one-foot contour line overlay. GPS units from iPhone. (Photo to Points). | |||||||||||||||||
|
The elevation test resulted in a dam height between 122' and 126'. This would not cause flooding of the manhole at 127'. Nor would it come close to inundating property at 134'. GPS data shows 10' difference and City shows 8' difference. Also, during storms, water simply pours over the dam and doesn't back up from it. Photo in presentation showing this action. UTIL = SPMUD, GPS = IPHONE, CITY = CITY OF ROCKLIN | ||||||||||||||||
|
Figures and Maps | |||||||||||||||||
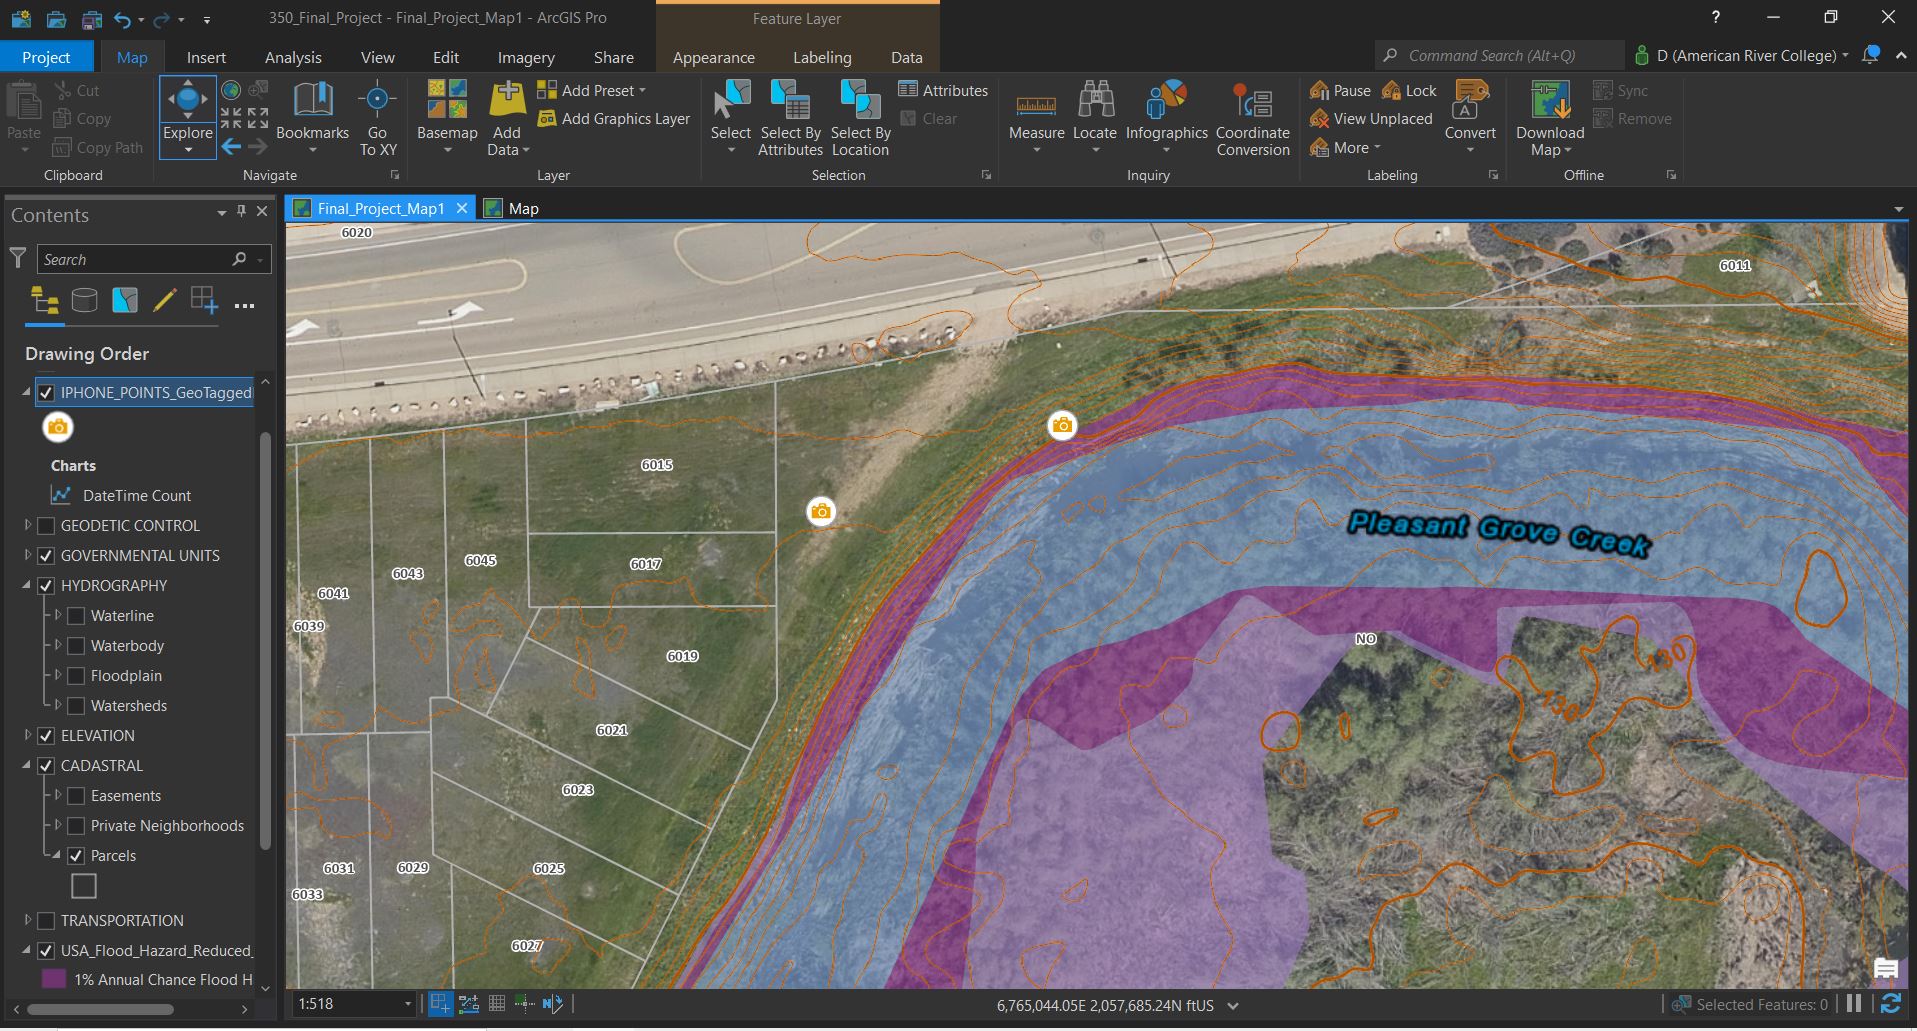 |
ArcGIS Pro screenshot showing Cadastral Layer, GPS Points, FEMA 100 Year Floodzone, and Ortho Basemap Manhole location is approximately just below the P of Pleasant Grove Creek label and where NO is labeled on the map. | ||||||||||||||||
|
Analysis The analysis of this particular dam location, although small in total data, did have a very representative example of what I was trying to accomplish and what could be used on future dam surveys. I had the dam height (highest point of pooled water), the cadastral height (lowest point of private property), the sewer manhole rim height (lowest point of city/utility infrastructure to be affected, and the FEMA 100 year flood zone layer (what does this height look like compared to all others). For one more infrastructure layer, I should have gotten height and distance to nearest road for city infrastructure that could be affected. My GPS unit was consistently 15' higher than the other datasets. I need to recalibrate it against a known elevation before I use it again in the field. That data was not used. My backup (iPhone) was used instead. A professional GPS unit would be ideal, but for citizen science, an iPhone (and a properly calibrated consumer GPS) are very worthy tools for elevation/location data gathering. I spoke with the Utility company and tried to get x/y/z data of manholes but they have yet to share that data. I spoke with the City of Rocklin GIS Dept. but I essentially had what I needed from ArcGIS online portal services. Visual survey for tree damage showed none on private property. A few trees in one section of the creek, all in public space, have wire mesh at base to discourage beaver damage. Those trees were approximately one mile from study area. | |||||||||||||||||
|
Conclusions Through assembling all this data in ArcGIS Pro, the results show that this particular beaver dam poses no threat to the city, private landowners, or the utility company. I believe with more data acquired in this manner, and with similar outcomes, one could argue that the beavers and their dams are a beneficial partner in beautifying the city and serve all wildlife in an urban environment. | |||||||||||||||||
|
References Literature researched on the topic of Urban Beavers in California. Cuellar, Carolina. “Beavers Can Help California’s Environment, But State Policy Doesn’t Help Them.” BayNature.Org, November 11, 2021 https://baynature.org/2021/11/11/beavers-can-help-californias-environment-but-state-policydoesnt- help-them/. Accessed November 15, 2021 | |||||||||||||||||
|
Appendices none | |||||||||||||||||