| Title Assessing the Reliability of Citizen Science Data Using iNaturalist 
| |||||||||||||
|
Author Seth Strumwasser American River College, Geography 350: Data Acquisition in GIS; Fall 2021 seth.strumwasser@gmail.com | |||||||||||||
|
Abstract Reliability of iNaturalist data on the northern shoveler (Spatula clypeata) is assessed as it relates to geographical bias. The data are found to contain severe bias towards established wildlife viewing areas and population centers. | |||||||||||||
|
Introduction In this project, I evaluate the spatial and temporal coverage of iNaturalist observations in California of the northern shoveler (Spatula clypeata), a common and widespread migratory duck. I attempt to produce evidence of spatial bias in these data by comparing the locations of observations with the locations of popular and accessible recreation areas in the form of California Department of Fish and Wildlife (CDFW) Wildlife Areas and National Wildlife Refuges. | |||||||||||||
|
Background Citizen science is a new and exciting method of data acquisition which has surged in popularity due to the proliferation of GPS and smartphone technology. One of the most popular and successful examples is iNaturalist, a platform built and managed by National Geographic and the California Academy of Sciences. iNaturalist allows users to upload photographs along with other details about an organism they saw in the wild. Thus, the site has amassed an enormous trove of spatial, ecological, and taxonomic data which has greatly benefited scientists. Scientists have recently discussed the potential for using this large-scale data for analysis of ecological phenomena (McKinley et al., 2016) One such phenomenon is seasonal migrations of waterfowl in the Pacific Flyway, during which millions of birds travel thousands of miles along the Pacific coasts of North and South America. Populations of waterfowl (ducks, geese, and others) within the flyway have decreased since the expansion of industrial agriculture and resulting land use changes (Fleskes et al., 2018). It is estimated that less than 5% of the wetland habitat these birds use remains in California (California Waterfowl, 2020). Meanwhile, observation of these animals by non-scientist bird enthusiasts has become more popular as a recreation activity. With the advent of tools like iNaturalist, these birders can contribute to scientific research by logging their observations across a large spatial and temporal scale. However, it remains up for debate whether these data are accurate and comprehensive enough to be used reliably by scientists. One potential bias in citizen science data is the concentration of observations in areas that are accessible and popular among amateur naturalists. On the other hand, these data are useful for capturing signals that would be very costly and unfeasible for scientists to seek out. For example, a sighting of an animal once thought extinct in an area would provide scientists with a potential system to study. Citizen science data can also compliment specialist data, allowing scientists to reach additional conclusions about ranges and biodiversity (Hochmair et al., 2020). Additionally, invasive species programs have successfully utilized citizen science platforms, such as California Weed Mapper, to monitor the presence of harmful organisms. | |||||||||||||
|
Methods After exploring the observation data available for download from iNaturalist, I decided to use only one species, the northern shoveler, for my project. The northern shoveler has the most observations across the state of any migratory waterfowl; I wanted to pick a dataset as comprehensive as possible. I started with several geoprocessing tasks in ArcGIS Pro. | |||||||||||||
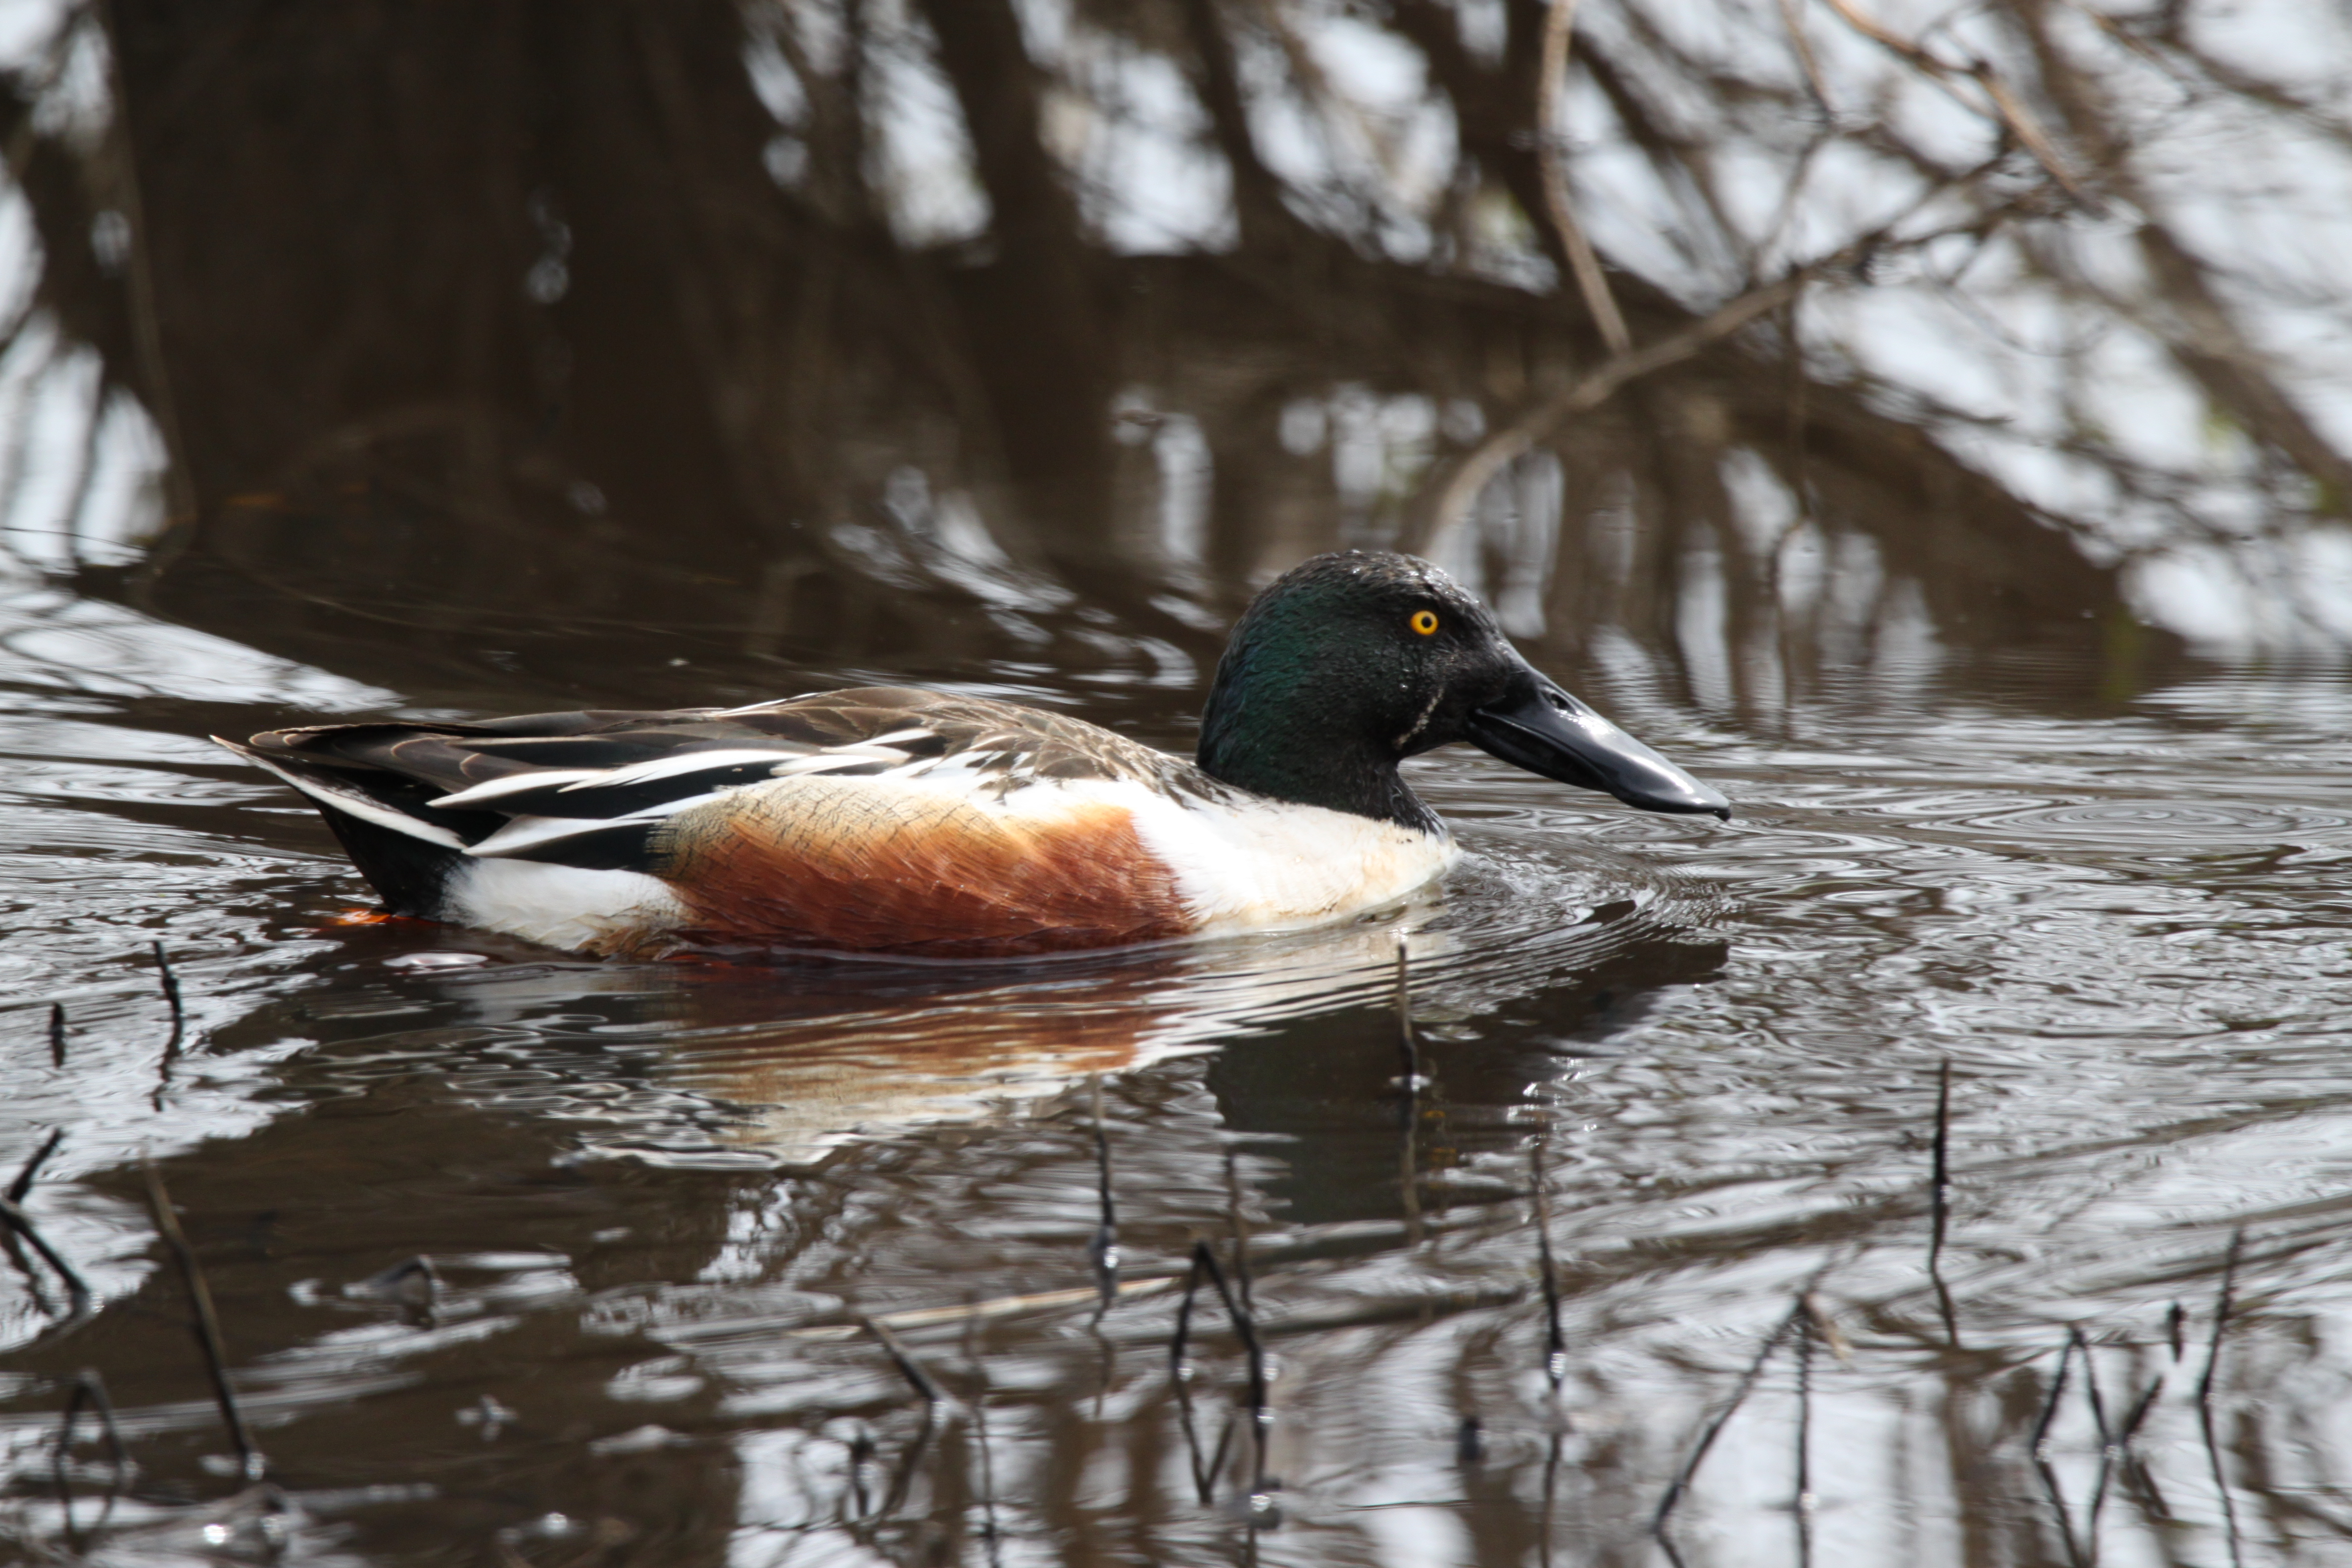 A male northern shoveler. A male northern shoveler.
|
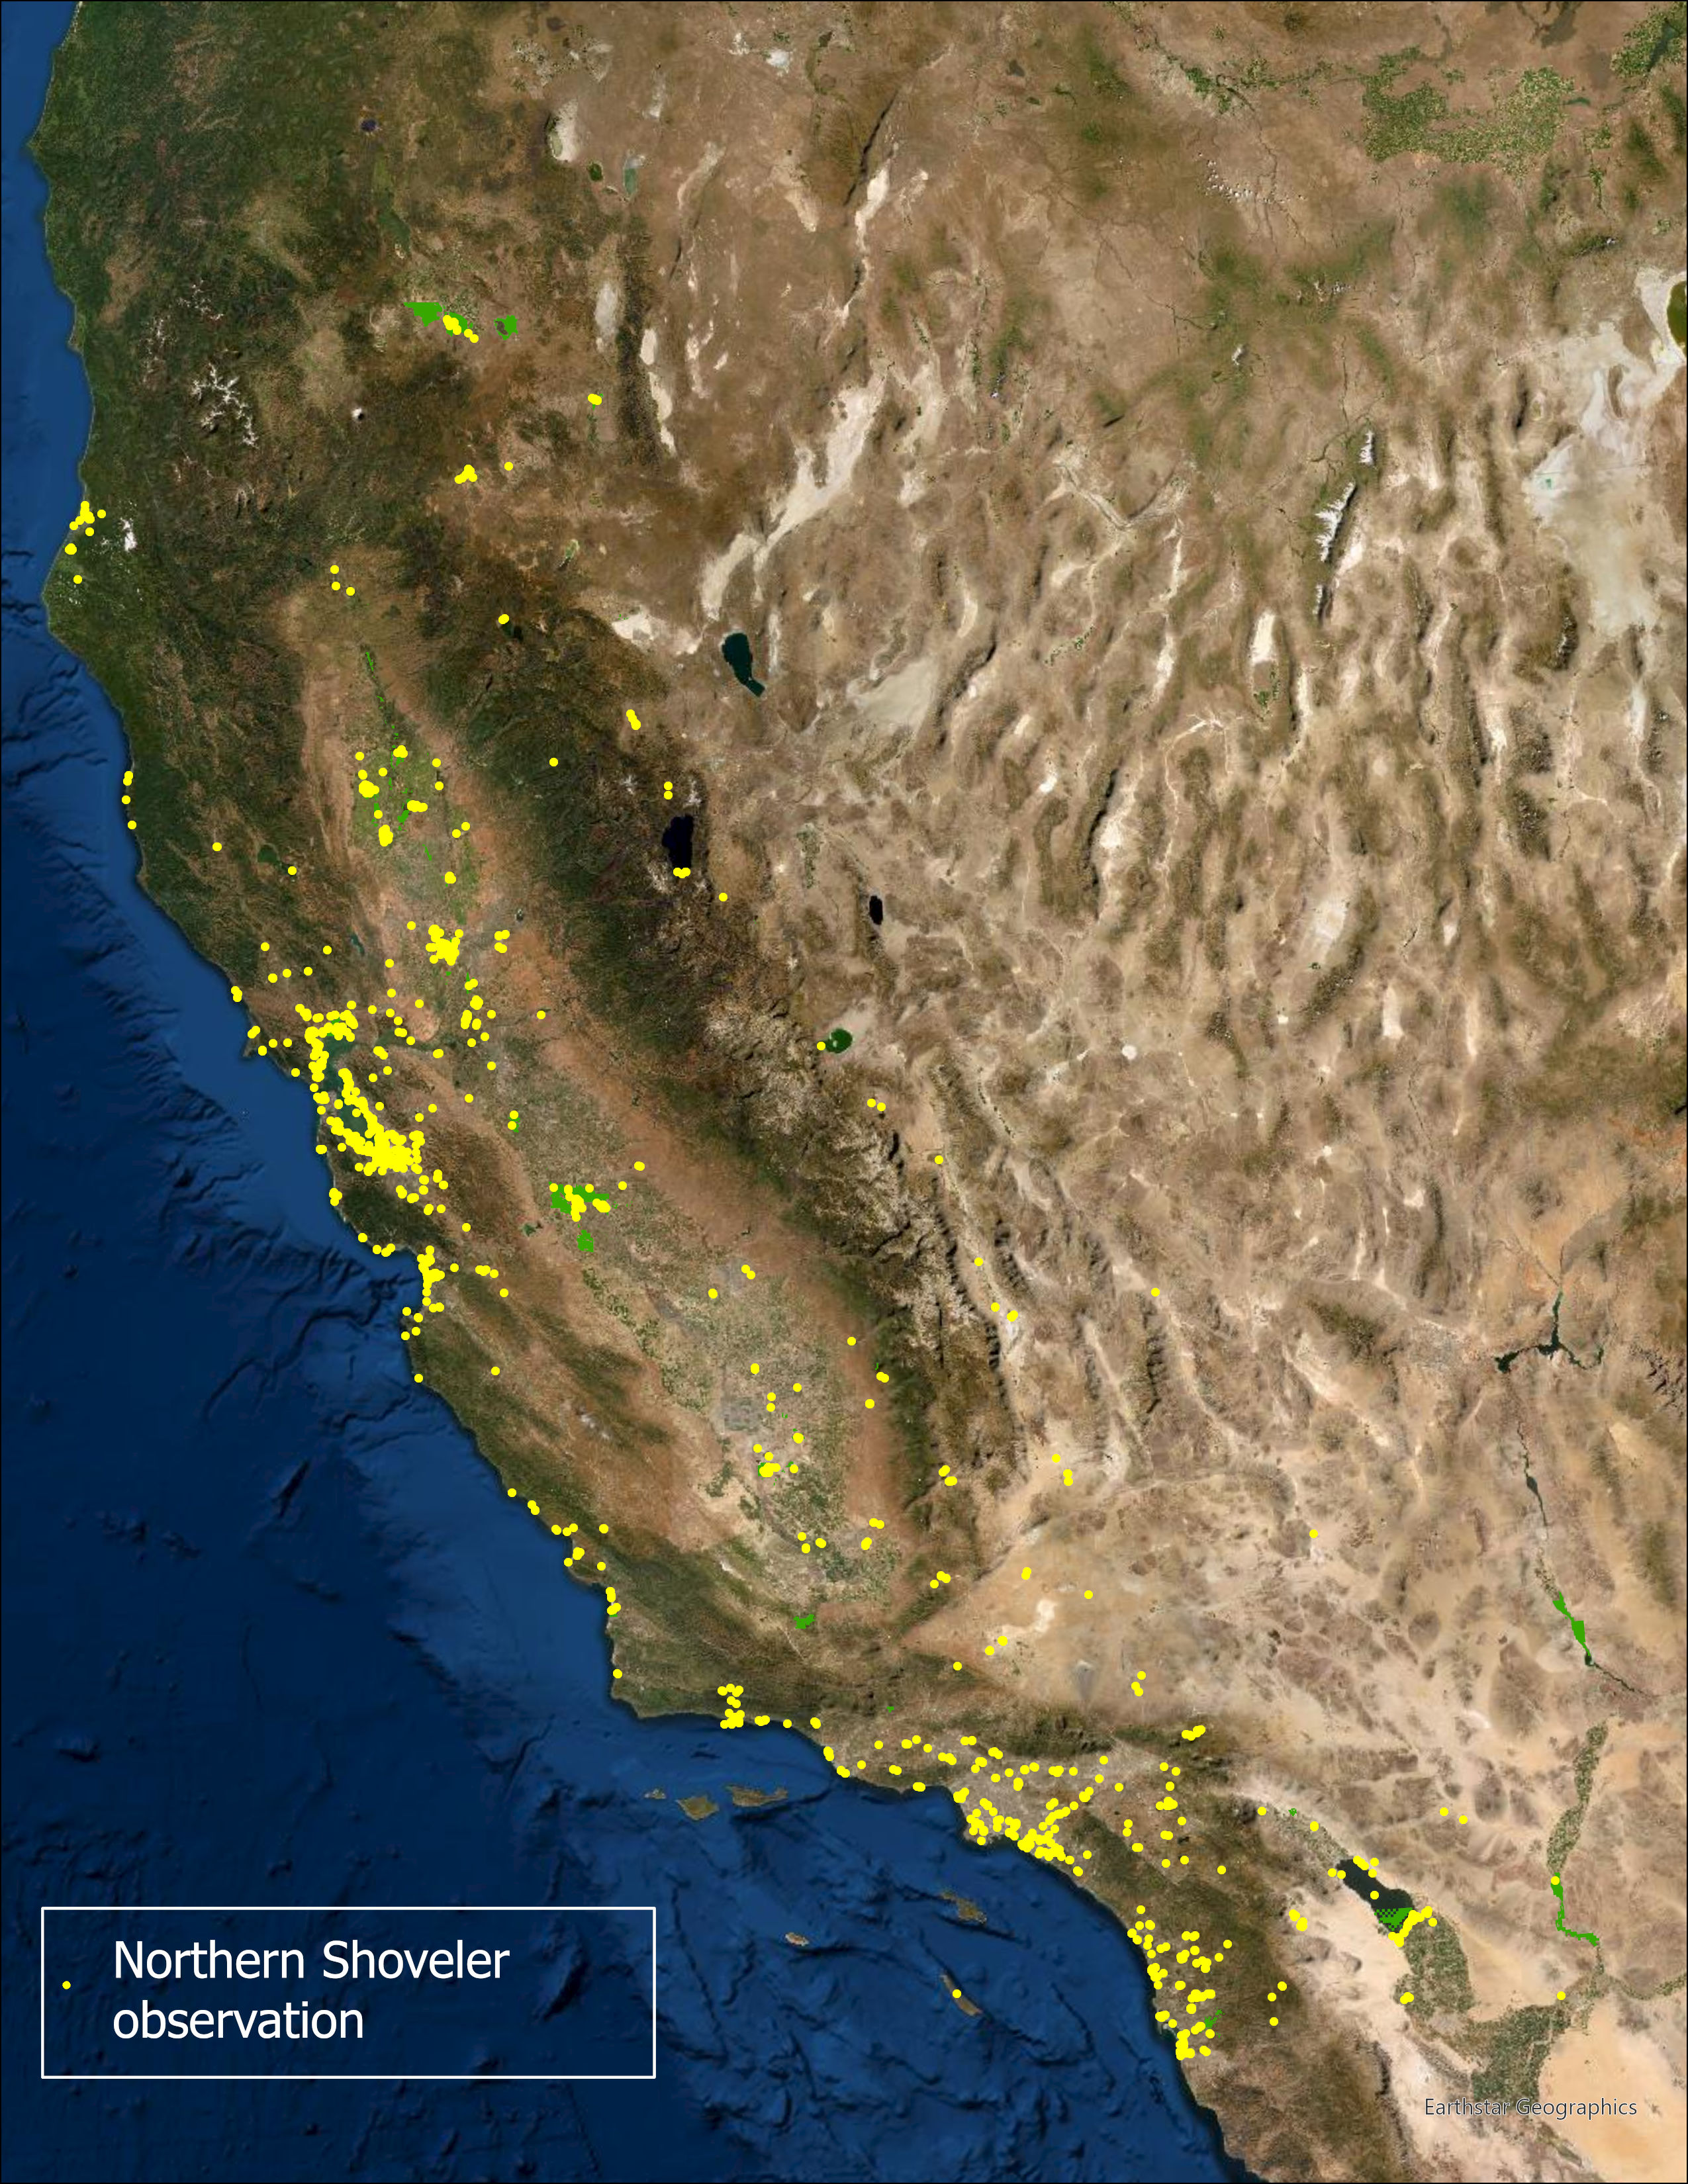 iNaturalist observations of northern shovelers in California. iNaturalist observations of northern shovelers in California.
| ||||||||||||
The first step was to make a feature class of the points using the Coordinate Table to Point tool. Next, I found feature classes of CDFW Wildlife Areas and National Refuges in California. Using the Summarize Within and Merge tools, I created a feature class of all these polygons with an attribute representing the number of shoveler observations within each one. | |||||||||||||
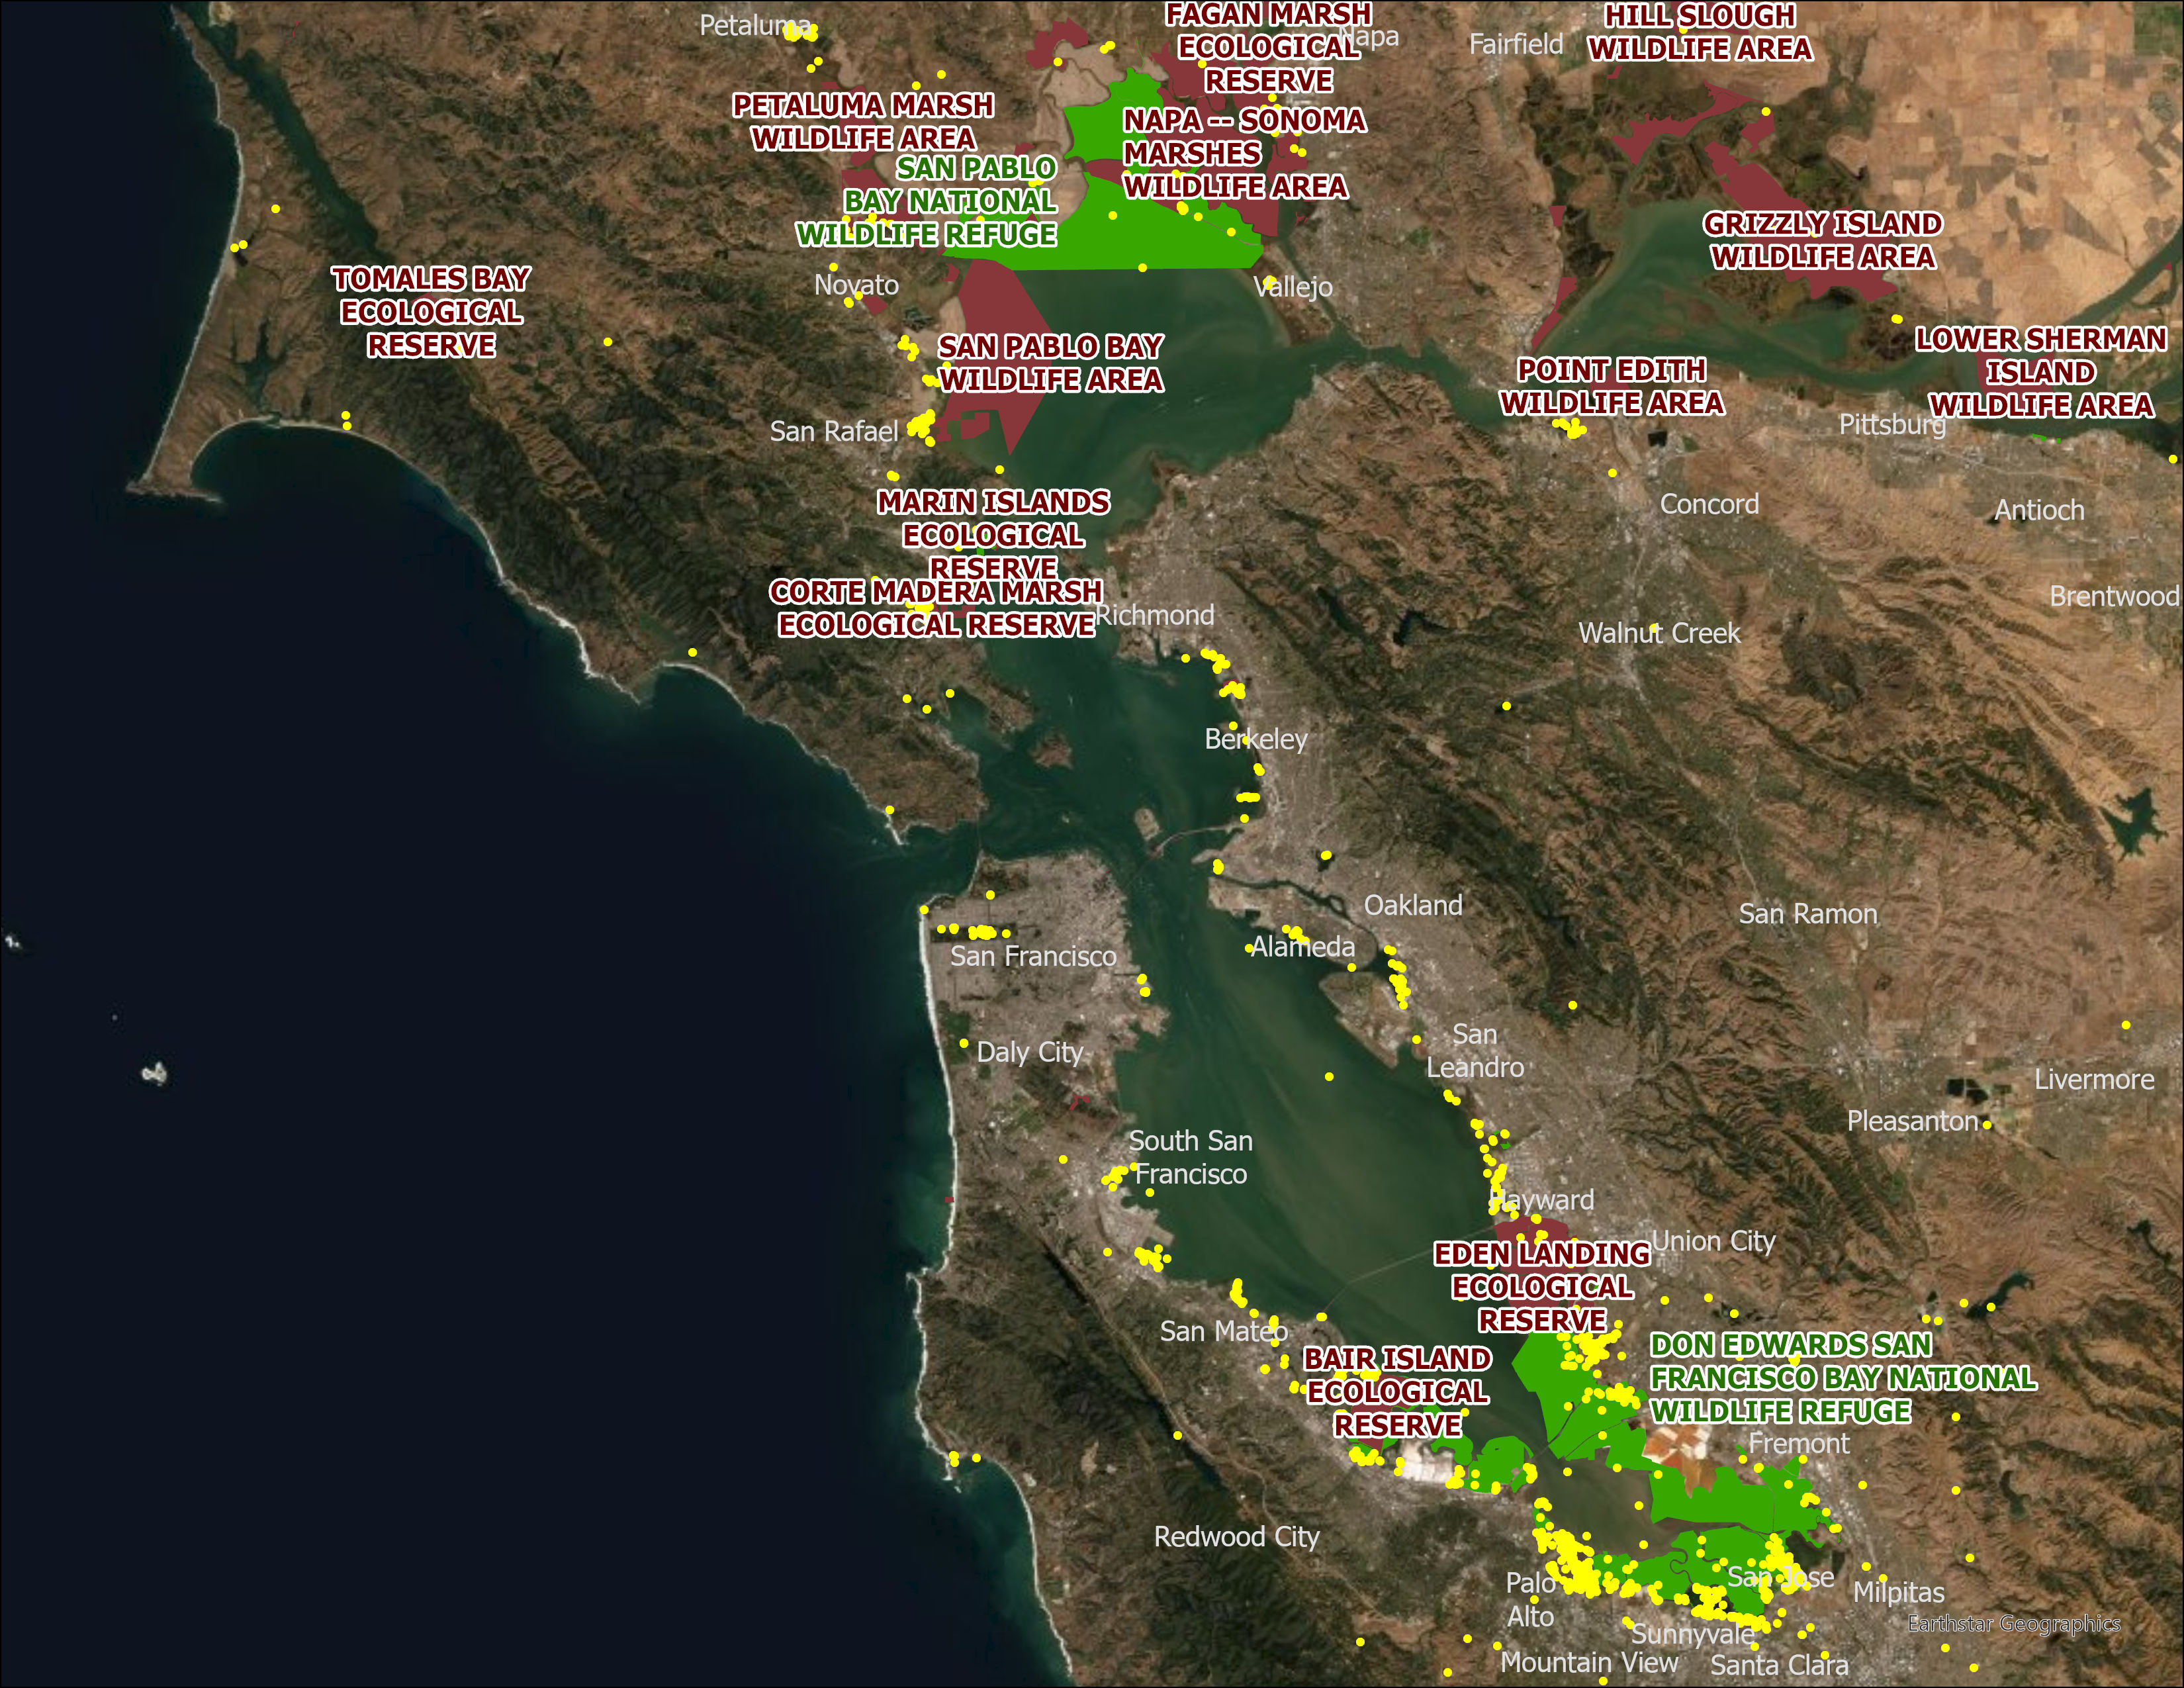 Shoveler observations and wildlife areas in the San Francisco Bay Area. |
|||||||||||||
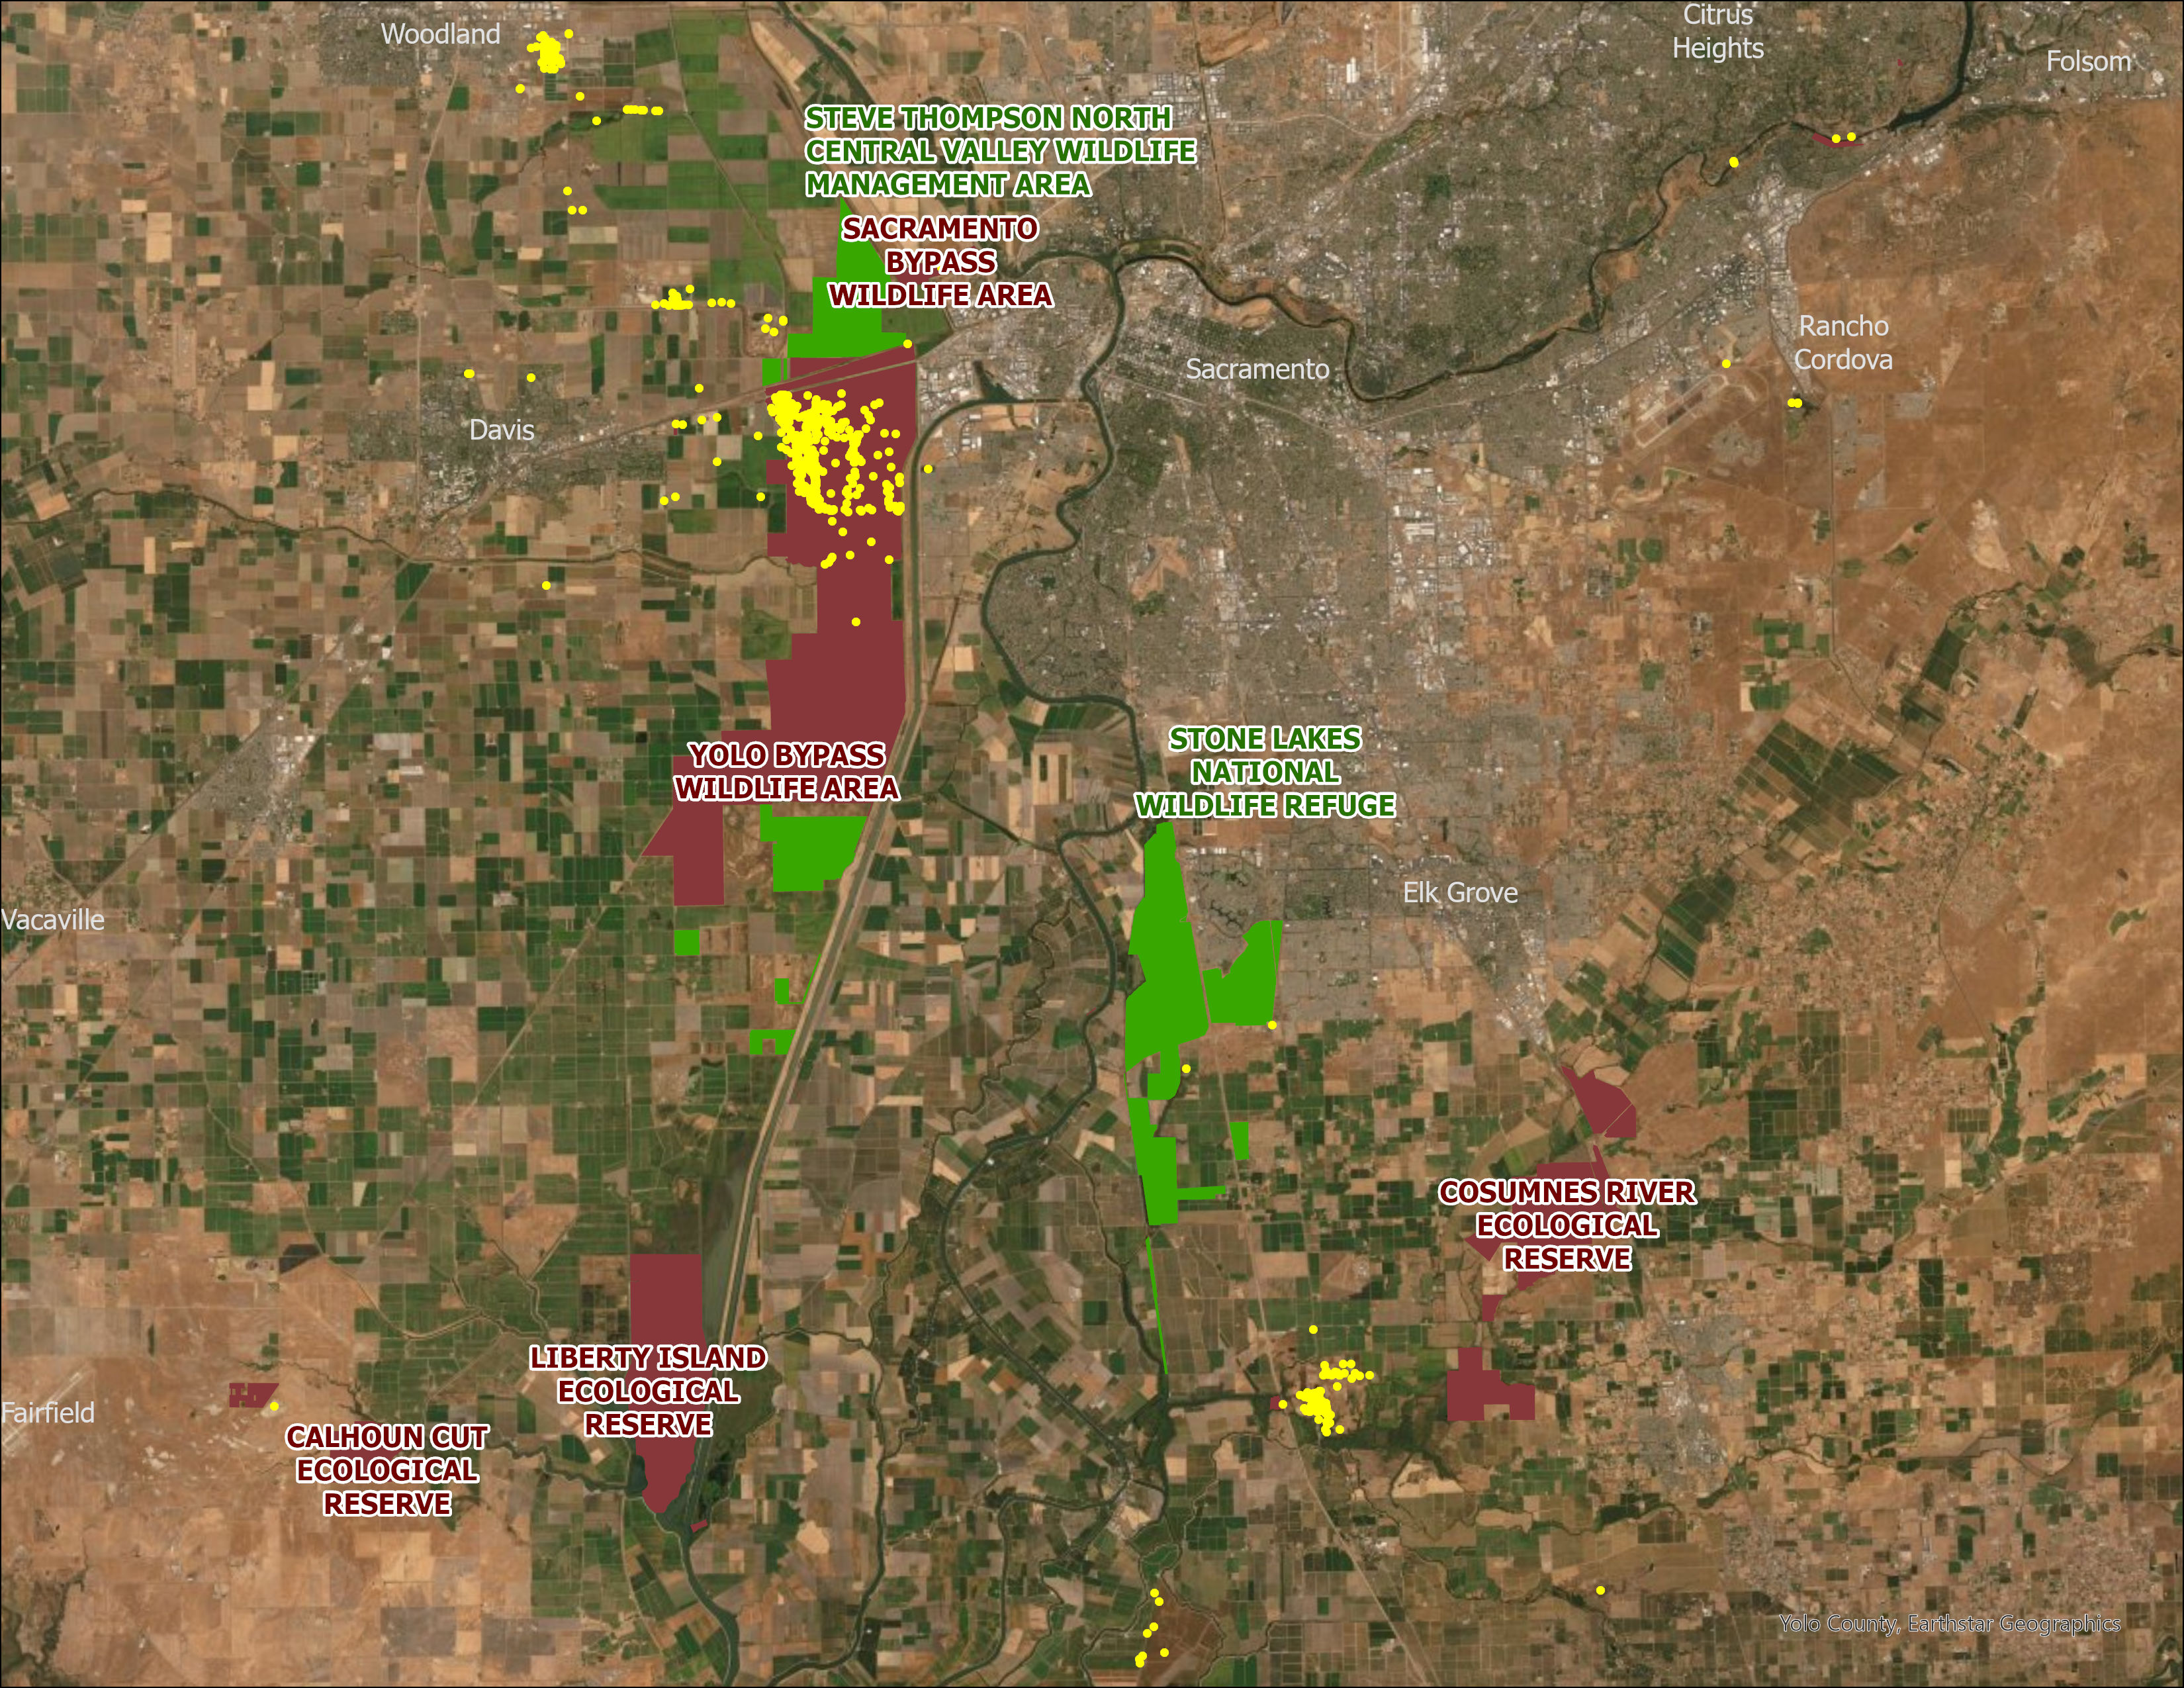 Shoveler observations and wildlife areas in the Sacramento region. |
|||||||||||||
|
Results Out of a total of 7,267 shoveler observations, 2,559, (35%), of them occurred within my areas of interest. To contextualize this result, I first noted that these areas cover just 0.4% of the area of California. But this is not a useful comparison, because much of the state is not suitable habitat for northern shovelers. Indeed, the range of shovelers (where they are reliably observed) covers only 75% of the state. So, a more relevant statistic would be that these areas of interest cover 0.53% of the range of the northern shoveler. | |||||||||||||
|
Furthermore, I discovered that 20% of the observations within wildlife areas were in the top 5 (10%) locations. As might be expected, most of the top locations are in the top half of the size distribution of wildlife areas. | ||||||||||||
|
Analysis My analyses provide useful insights into the reliability of citizen science data for answering ecological questions. The disparity between the coverage of spatially and temporally dense observations in the locations I focused on and the remainder of the shoveler’s range is striking. Bias this strong would certainly not produce any usable evidence for asserting a hypothesis. As we know, nature does not conform to the artificial boundaries we establish. Indeed, many of the wildlife areas I studied have adjacent portions of identical habitat that are closed to the public. iNaturalist data would indicate that the shoveler does not exist in these portions, but it is highly likely that it does. As for the discrepancy within the set of wildlife areas, this shows evidence of additional bias. Some areas see far more visitors for a variety of reasons: better facilities, easier access, or proximity to large cities. Indeed, the two areas with the most abundant observations (Yolo Bypass Wildlife Area and Don Edwards National Wildlife Refuge) are within 20 miles of major population centers. | |||||||||||||
|
Conclusions The data assessed here provide strong evidence that citizen science platforms are ill-suited to answer important ecological questions about geographic distribution. While there are certainly benefits to citizen science data collection, its utility for scientists is extremely limited. More sophisticated studies have shown this empirically, though there are studies that point to important roles for these data. | |||||||||||||
References California Waterfowl 2020. Wetland Restoration. Web. https://calwaterfowl.org/conservation-programs/wetland-restoration. Accessed 12/15/21. Fleskes J.P., Casazza M.L., Overton C.T., Matchett E.L., and Yee J.L. 2018. 018. Changes in the abundance and distribution of waterfowl wintering in the Central Valley of California, 1973–2000. Trends and traditions: Avifaunal change in western North America (W. D. Shuford, R. E. Gill Jr., and C. M. Handel, eds.), pp. 50–74. Studies of Western Birds 3. Hochmair H.H., Scheffrahn R.H., Basille M., and Boone M. 2020. Evaluating the quality of iNaturalist termite records. PLOS One. 15(5): e0226534. https://doi.org/10.1371/journal.pone.0226534 Mckinley et al. 2016. Citizen science can improve conservation science, natural resource management, and environmental protection. Biological Conservation. Volume 208, 2017. Pages 15-28. ISSN 0006-3207. https://doi.org/10.1016/j.biocon.2016.05.015. | |||||||||||||