| Title Get Outdoors Along the 50-Corridor The Creation of a Web Map App for Outdoor Recreation | |
|
Author Amy Wolpert American River College, Geography 350: Data Acquisition in GIS; FALL 2021 amylynnwolpert@gmail.com | |
|
Abstract Since Spring of 2020, the amount of people who just want to get out of their homes and be outside has risen. I developed a website experience for one stop information on recreation along the 50-corridor in El Dorado County. | |
|
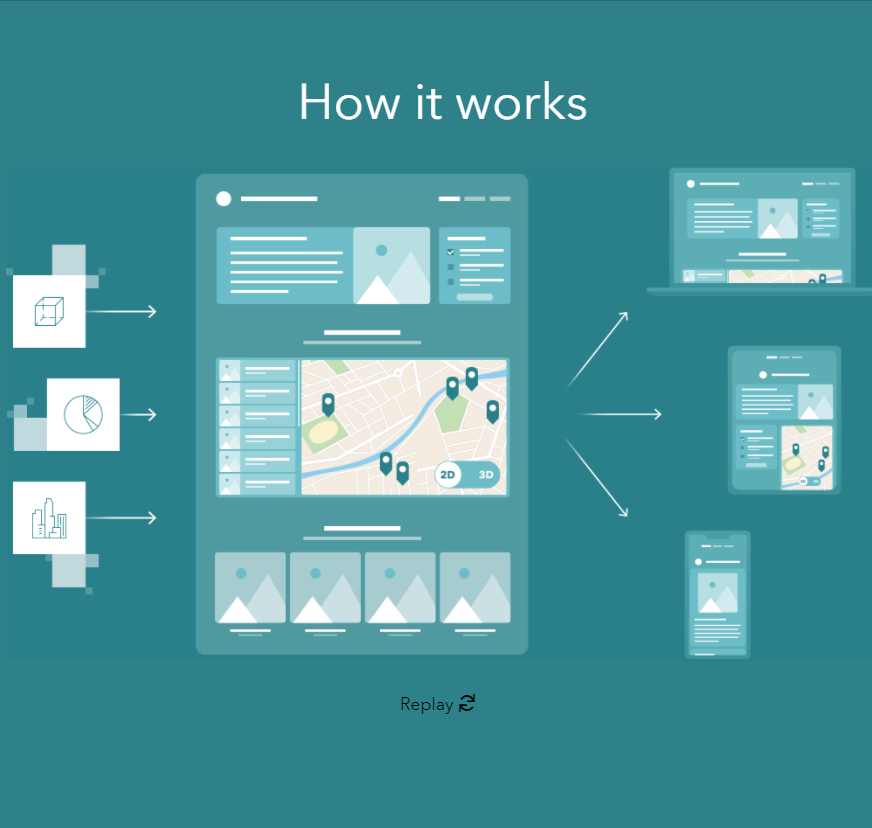
Introduction The purpose of this project is to provide necessary information for being outdoors in a single place, via links to other websites, and interactive surveys with results shown on a map, updated in real time. The web experience was created using ESRI’s Experience Builder (a type of web app) that allows users to operate seamlessly from a cell phone, tablet, or personal computer (with internet access). The web experience displays large, easy to tap tiles with various sets of information about the forest, permits, camping, safety, and much more. The interactive portion provides the user with surveys on plants, reviews, and safety concerns. After a survey is taken the user can see their results displayed on a map. This information is available to all users as long as they have a device that is connected to the internet. Overall, this web experience provides needed information in a simple, easy to use format. | |
|
Background Since the global pandemic began back in Spring 2020, people have felt the need to get outside in the fresh air, or to take up outdoor activities like hiking, camping, and backpacking. This may have been a way to escape the confines of one’s home, or even to be in the seclusion of the forest. No matter what the reason, people who have never been avid outdoors people are getting out there or they are rediscovering outdoor activities they used to enjoy (Rogers and Lindblom 2021). This global pandemic has given us all time. Time to think about what really matters; time to think about things we have not got around to do; time to think about things on our bucket lists. Time to do all these things. | |
| Because of COVID-19 there has been a great increase in activity outdoors. The Outdoor Industry Association (OIA) (2020) suggests, we have “flocked to outdoor recreation” during this unprecedented time. In fact, the OIA is not the only organization who thinks this. The Associated Press (AP) (2021) has reported that whether we are “locked down, shut in or just fearful of crowds, people took up hiking, biking, cross-country skiing, snowshoeing, camping,” and other activities in significant numbers. It is not only those who previously got outdoors, but city folk are participating in outdoor activities as well. The OIA (2020) state activities such as “running, bicycling, day hiking, bird watching and camping” have seen and clear rise among “urban” participants. This is great news for Americans because our inactivity levels for almost all age groups and income levels has declined, with outdoor participation growing a few percent over the last few years (OIA 2021). While a few percent does not seem like a tremendous amount, activities such as hiking, camping and fishing account for 19.4 million more Americans in 2020 getting outdoors over 2019 (AP 2021). With being outdoors, Americans need to be thinking about safety, especially during a global pandemic. Positive aspects about being outdoors that pertain to COVID-19, besides the overall physical benefits, are fresh air and the sun. The staff at the Mayo Clinic (2021) state, “When you're outside, fresh air is constantly moving, dispersing these droplets. So you're less likely to breathe in enough of the respiratory droplets containing the virus that causes COVID-19 to become infected if you haven’t had a COVID-19 vaccine.” The Mayo Clinic Staff (2021) also offer examples of activities that are low risk, whether you are vaccinated or not, such as camping, swimming, and going to the beach, boating, and fishing. Still more benefits from the outdoors are that it often boosts your mood, relieves stress, and the sun offers a good dose of vitamin D. |
|
|
Methods The approach taken for this project will be described in this section. Details on data acquisition, and development of the web map app, including the supplemental surveys and web map creation. | |
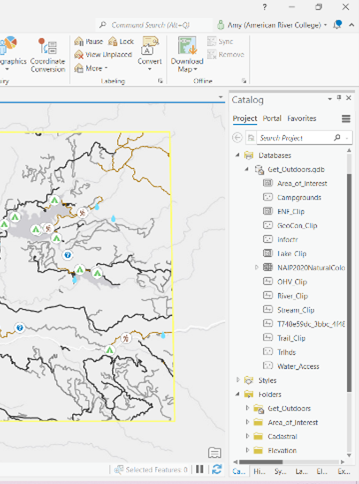
| Data Acquisition The data used for this project came from multiple sources. I was first inclined to use a dataset I created as part of a framework geodatabase with seven themes that focused on the same area of interest, a portion of the El Dorado National Forest. I assumed having done the leg work previously, such as locating datasets (on ArcGIS Online Portal, open-source data from the US Department of Fish and Wildlife, US Department of Agriculture, US Forest Service, US Geological Survey, and personally creating feature datasets), and clipping/exporting all datasets down to my area of interest, I would have enough information for this project. While I did not end up using the data mentioned above, I did use this information as a guide to help create an outline of what the experience includes. Once the outline was complete, I started by searching the internet for information relevant to the experience. Using a word document, I would type one line of information and copy the link to the page. This document kept my external links to websites organized. The word document became what my tiles (in the web experience) ultimately became. Three surveys were created in ESRI’s Survey123 to provide additional data (and part of the interactive experience) that is used in the web map on the web experience. Details regarding the survey are provided in the development section. |
|
|
Development Originally this project was imagined as being a simple web application but wanted something a little more interactive and informative while still using a web map. I took a chance on using ESRI’s Experience Builder to learn a new skill along with surveys created with ESRI’s Survey123, and a web map created on ArcGIS Online with the results of the survey. The result is a web experience that is easy to use. Here is how I achieved this: |
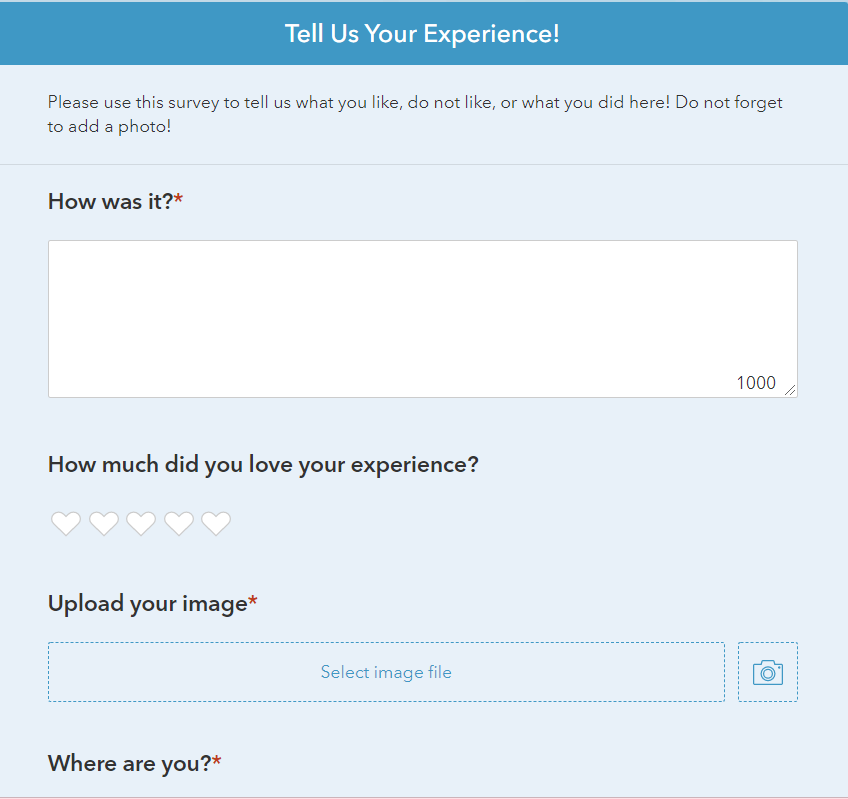
| Survey123 As part of the interaction on my web experience, I created three separate surveys using ESRI’s Survey123. Each survey collects different data. The surveys were created with the user in mind, asking simple questions, some with preloaded options, ability to upload a photo or take one within the survey, and location data is requested either by using the devices GPS or by entering the location manually. The location data is what allows the information to be displayed on the map (discussed in the following section). The surveys collect data on Wild Plant Identification, Recreation Experience, and reporting Safety or Maintenance issues. Please see the following three subsections with italicized title for surveys information. |

|
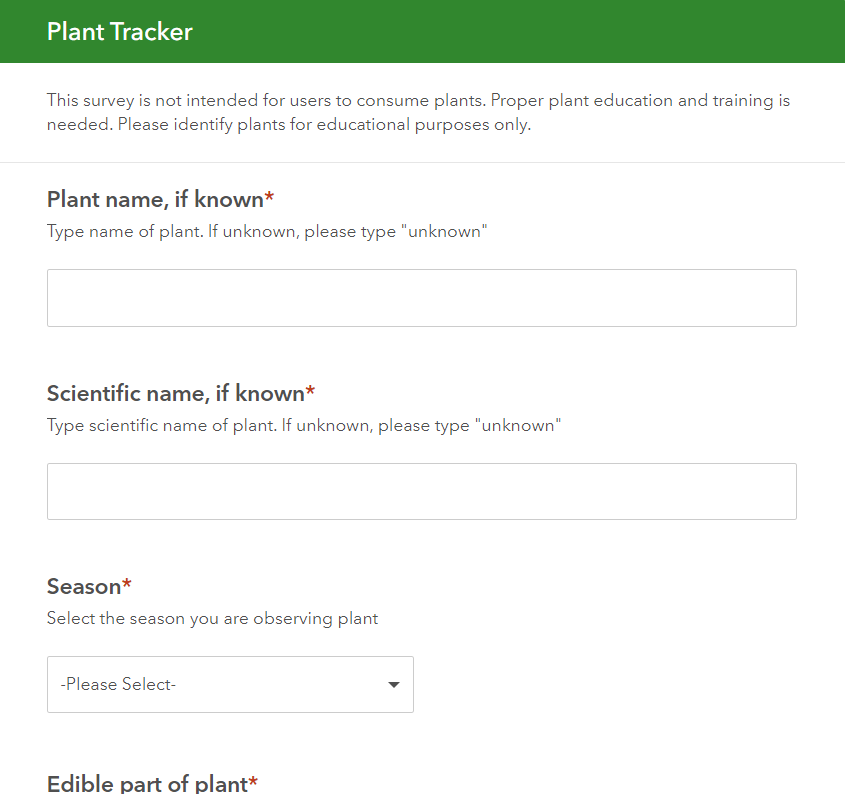
| Wild Plant Identification Survey This survey was created because I have an interest in wild edible plants. This survey was not created to tell people to eat wild plants, as the data can be created by any person. Rather, it was created so that people can be educated about the plants in their local landscape, or in this case the area in the El Dorado National Forest off Highway 50. Photographs can be uploaded to the survey which gives the opportunity to see plants at different stages and in different seasons. Some questions asked in the survey relate to: Plant name, Scientific Name, Season Observed, Known Uses, etc. When a user completes the survey, the results are displayed on the web map symbolized by a plant. |
|
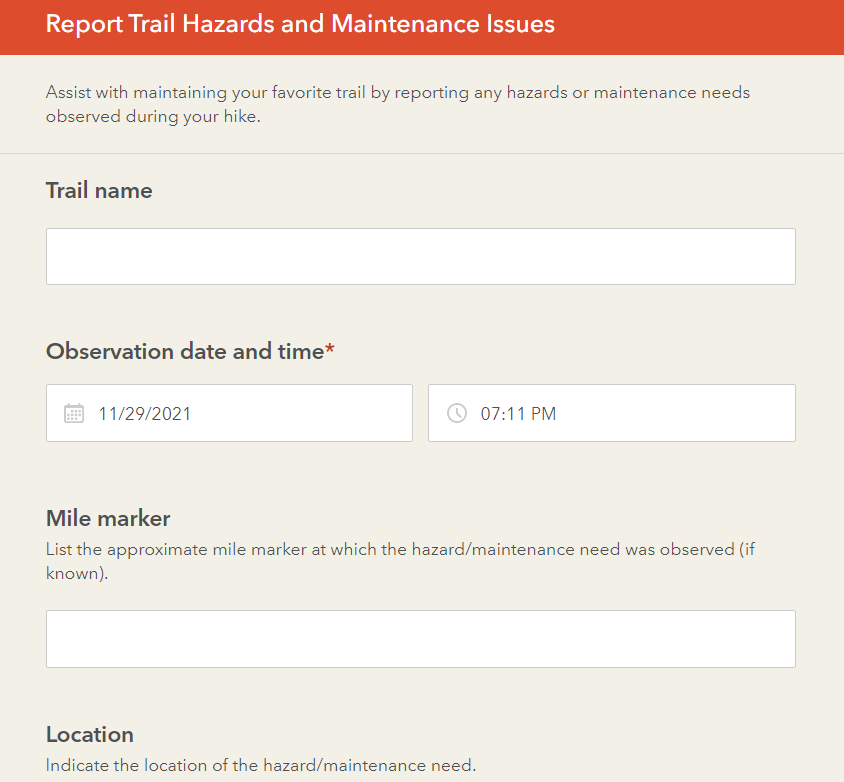
| Safety and Maintenance Issue Survey This survey was created to display information on maintenance or safety concern on and off trail. I have personally been on many hikes when a tree was down on a trail, or a patch of Poison Oak was creeping on to the trail. Reporting these issues can help other day hikers, backpackers, or Rangers of the safety concerns in the area. Photographs can be uploaded to show the concern and its severity. Some questions asked in the survey relate to: Trail Name, Severity of Issue, Safety Issue Observed, Follow-up Questions Regarding Issue, etc. When a user completes the survey, the results are displayed on the web map symbolized by a red flag. |
|
| Recreation Experience Survey This survey was created as a type of review process. Data collected from this survey can pertain to a campsite, trail, water feature, picnic area, etc. The user can rate the experience, add additional text, add photographs, etc. When a user completes the survey, the results are displayed on the web map symbolized by a dome tent. |
|

|
Web Map A project for a GIS course does not seem complete without some sort of map associated with it. To be able to display the data collected from the surveys created, I created a web map in ArcGIS Online with a layer for each survey: Wild Plants, Recreation Experience, Safety/Maintenance Issues. I changed the symbology from various colored dots to a green plant, grey tent, and red flag respectively to be able to visualize where there is a patch of wild plants, or perhaps multiple dangers on a specific trail. If you click on a point a pop-up will appear displaying data such as its ID, name (if known), location, and photographs as attachments. Once loaded into the Experience Builder, added a widget to filter the layers. The filter can show various things such as where restroom have been recorded, where a rattlesnake has been sited, or experiences that have been rated 4-hearts or higher, for example. The web map will show real time data if page is refreshed. |
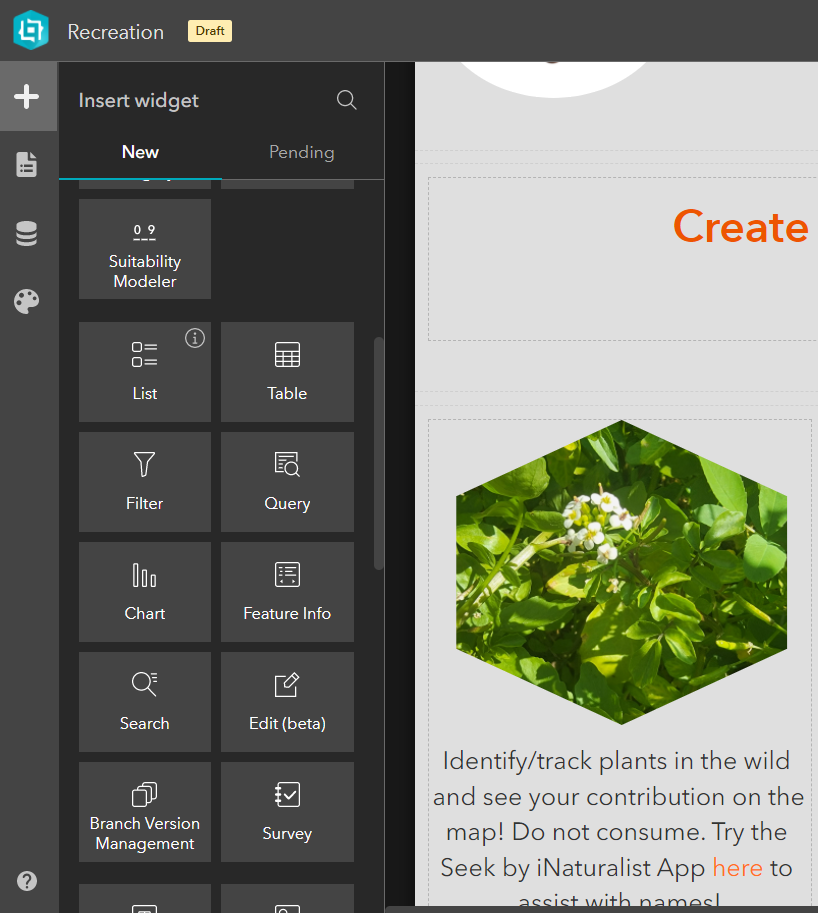
| Experience Builder The first step is to choose a template or create your own. There is a wide variety of templates available to choose from, ranging in capabilities and focus. If you are looking for a “webcentric” experience, there many templates to choose from where the map is the main focus. I was looking for an experience that was interactive, contained text and links, and had a map that was not necessarily in the spotlight. After previewing many templates, by using the magnifying glass icon on the lower right corner, I clicked the create button on the Gallery template. This takes you to the design page, where you can drag and drop information, upload items, and connect to URLs. Using my outline created during my data acquisition step, I was able to quickly place all the information into the experience builder, rearrange, change settings, add photographs, and links. The design page for the Experience builder also allows the designer to insert surveys created in Survey 123, and web maps. While you can create a web map in Experience Builder, I opted to insert a web map I already created but add filters to the map using the controls on the Experience Builder. See details above. |
|
|
Resulting Web Experience The resulting web experience is a sleek, user friendly web map app that functions as an informational map and as a data collecting app. | |
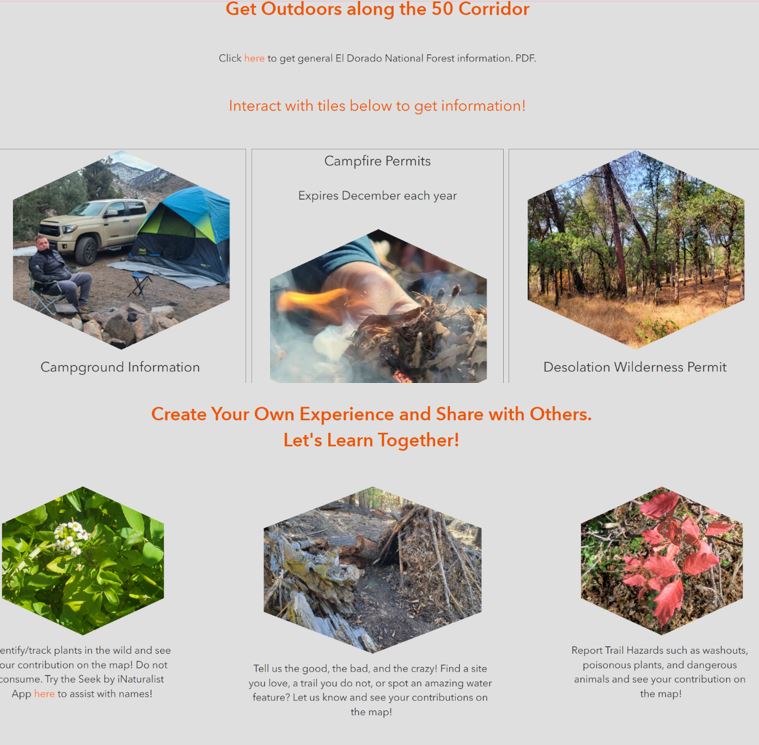 |
This app can be a great tool for all experience levels on the trail. Large tiles make the links easy to click on a mobile device. Result from survey can be seen in real time with a simple refresh of web experience. View all results, even from other people, to see where great places to visit are, where to stay away from because of hazard, or even to view some flora you have never seen before. |
|
Analysis My goal was to create a web experience using ESRI’s Experience Builder that is a placeholder for information on outdoor recreation, but also has a data collection component where users take surveys, and the information is used to populate a web map that will be useful to them and others. I believe I have been successful in creating this. The process, however, was not as seamless as the web map app is to use. Throughout the process of creating this project, I came into a few challenges. The fact that I had no experience using Experience Builder made creating this a learning experience. I spent many hours watching tutorials, reading FAQs, and experienced a fair amount of trial and error. This was not a bad challenge to have, as I learned a lot and the product exceeded my expectations. In my original plan for this I wanted to use another “mapcentric” experience in place of a map to insert into my experience. During design, I found out that this is not possible or at least I could not figure out exactly how to do what I wanted. I hoped to include layers I created in ArcGIS Pro displaying hiking trails, OHV trails, campgrounds, ranger stations, and water features, all including attribute tables and complete with pop-ups. I also wanted to have my surveys attached to the map as widgets instead of separate links. While I was able to make a widget with the survey, the result was less than stellar. The survey was difficult to fill out and often would not let the user scroll through the survey. I ditched this idea (which could have been my project by itself and moved on to just having a map with the survey results. Creating a map in the Experience Builder app was not as intuitive as I had hoped with the survey results being the data for the layers included. | |
|
Conclusions/Results The end result ended up being an aesthetically pleasing web experience that is easy to use and provides the user with up to date and relevant information for outdoor recreation in a small section of the El Dorado National Forest in El Dorado County, California. I can see my “Get Outdoors Along the 50-Corridor” app being utilized by both beginning day hikers to experienced backpackers. In the future, I would like to add an additional survey to help with improvements on the web experience, including what is working well and what needs to be improved or taken away. I would also like to give users the opportunity to update other people’s surveys, such as reporting that a safety or maintenance concern has been resolved. This project has allowed me to explore interests of my own, design what I would look for in a web map application and bring that design to fruition. | |
|
References Associated Press. March 13, 2021. Outdoor activities boom in US amid COVID-19 pandemic. Retrieved from: https://www.dailysabah.com/life/health/outdoor-activities-boom-in-us-amid-covid-19-pandemic. | |
|
Mayo Clinic Staff. August 27, 2021. Safe outdoor activities during the COVID-19 pandemic. Retrieved from: https://www.mayoclinic.org/diseases-conditions/coronavirus/in-depth/safe-activities-during-covid19/art-20489385 | |
|
Outdoor Industry Foundation. August 13, 2020. Increase In Outdoor Activities Due to Covid-19. Retrieved from: https://outdoorindustry.org/article/increase-outdoor-activities-due-covid-19 | |
|
Outdoor Industry Foundation. February 10, 2021. Forthcoming Reports from Outdoor Foundation and Outdoor Industry Association to Provide Unprecedented Insight into Trends in Outdoor Participation. Retrieved from: https://outdoorindustry.org/press-release/forthcoming-reports-outdoor-foundation-outdoor-industry-association-provide-unprecedented-insight-trends-outdoor-participation | |
|
Rogers, Shannon and Jada Lindblom. April 6, 2021. Outdoor Recreation Impacts on Community and Economy during COVID-19. Retrieved from: https://extension.unh.edu/blog/2021/04/outdoor-recreation-impacts-community-economy-during-covid-19 | |