Title
Severe Wildfire Perimeters Greater than 10,000 Acres 2015-2021
Author Information
Sau Xu
American River College, GIS 350: Data Acquisition in GIS; Fall 2021
Abstract
Wildfires have grown in intensity and occurrence in recent history. This study will consolidate data from various relevant wildfire GIS maps to visually show the wildfire activity from 2015 to 2021 for wildfires greater than 10,000 acres. Specifically, the maps will show the burn areas from major wildfires greater than 10,000 acres based on the year of the incident.
Introduction
California wildfires have been major news lately due to the scale and severity of recent wildfires. In this year alone, based on data up to July 2021, the acreage increase is 257% higher compared to the same time in 2020 (Insurance Information Institute). After each wildfire season, statistics on the wildfires are collected by numerous agencies such as the California Department of Forestry and Fire Protection (CalFire) and United States Forest Service (USFS). Data collected includes comprehensive statistics and multi-purpose GIS maps. Wildfire perimeters were reviewed from 2015 to 2021 to compare the occurrences and severity of recent wildfires greater than 10,000 acres.
Background
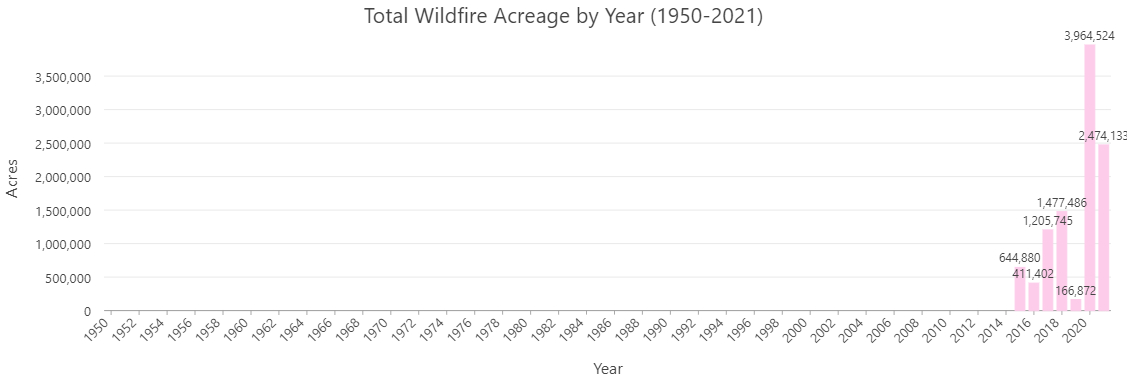
CalFire's Fire and Resource Assessment Program (FRAP) has streamlined the fire perimeter acquisition process and consolidated fire perimeter data. The program works in conjunction with USFS Region 5, Bureau of Land Management (BLM), and the National Park Service (NPS). The project has also captued prescribed fire perimeters and fuel reduction projects. CaliFire's GIS layer spans 1950-1999 for wildfires greater than 300 acres. USFS, BLM, and NPS has records of wildfire perimeters that are 10 acres and greater. Respectively, the records date back to 1878, 2002, and 1921. This dataset did not include wildfire perimeter data for 2021.
The GIS data layer for 2021 was queries from https://gis.data.ca.gov/. This website appears to be a framework webpage for GIS data related to California. The 2021 wildfire perimeter was provided by CalFire and the Wildland Fire Interagency Geospatial Services (WFIGS) Group. The GIS data authorized by WFIGS is hosted on the National Interagency Fire Center ArcGIS Online Organization (The NIFC Org).
Methods
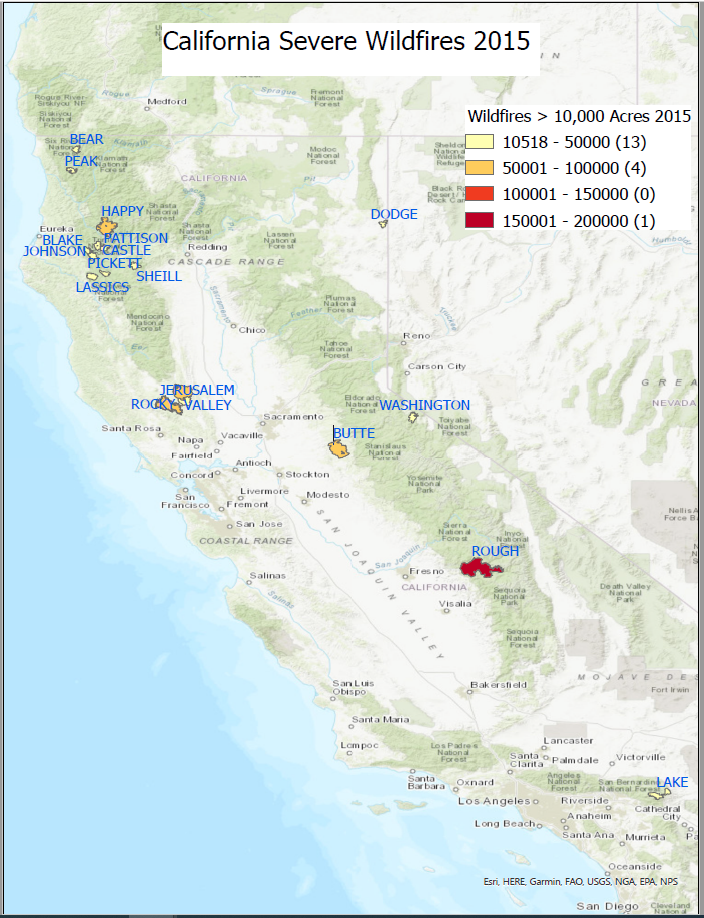
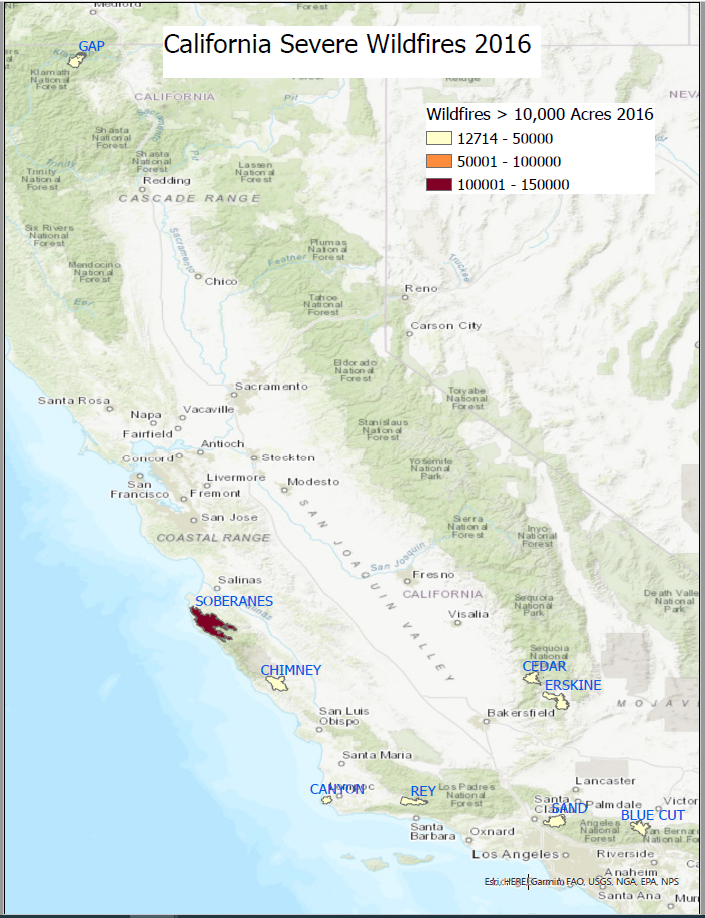
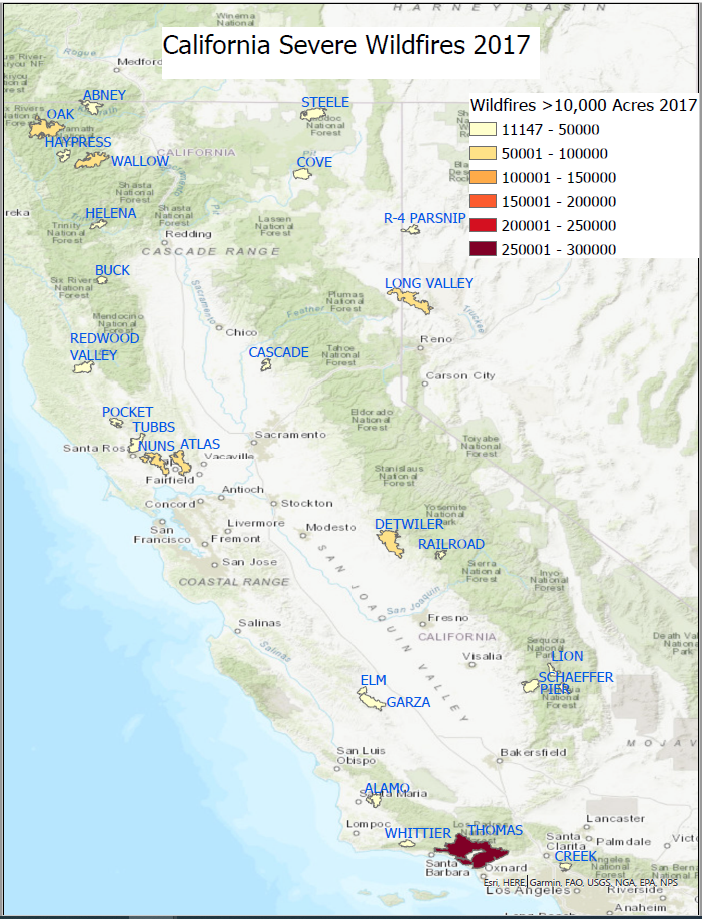
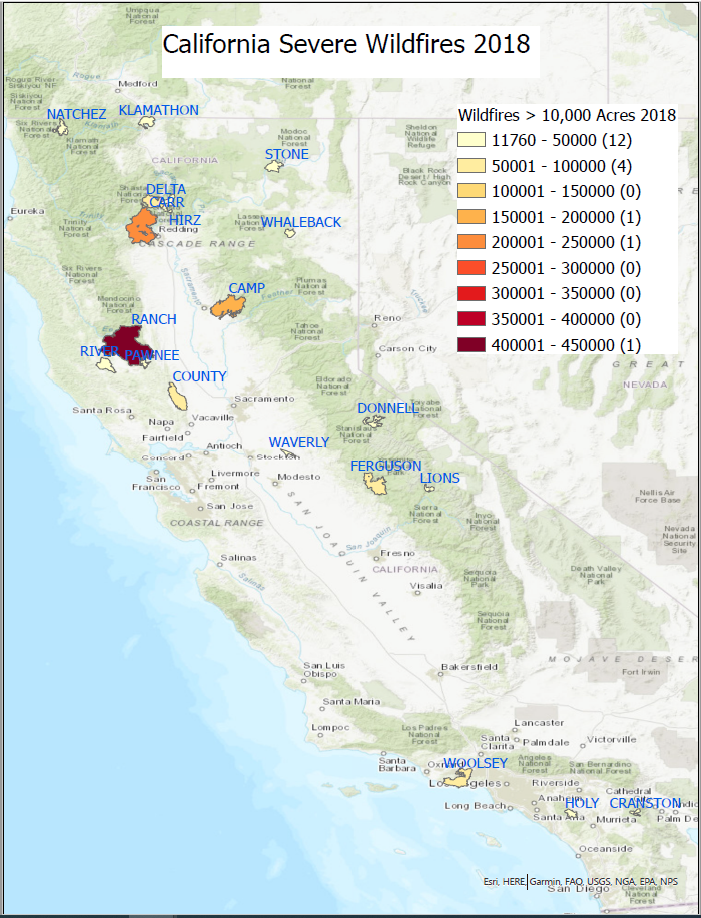
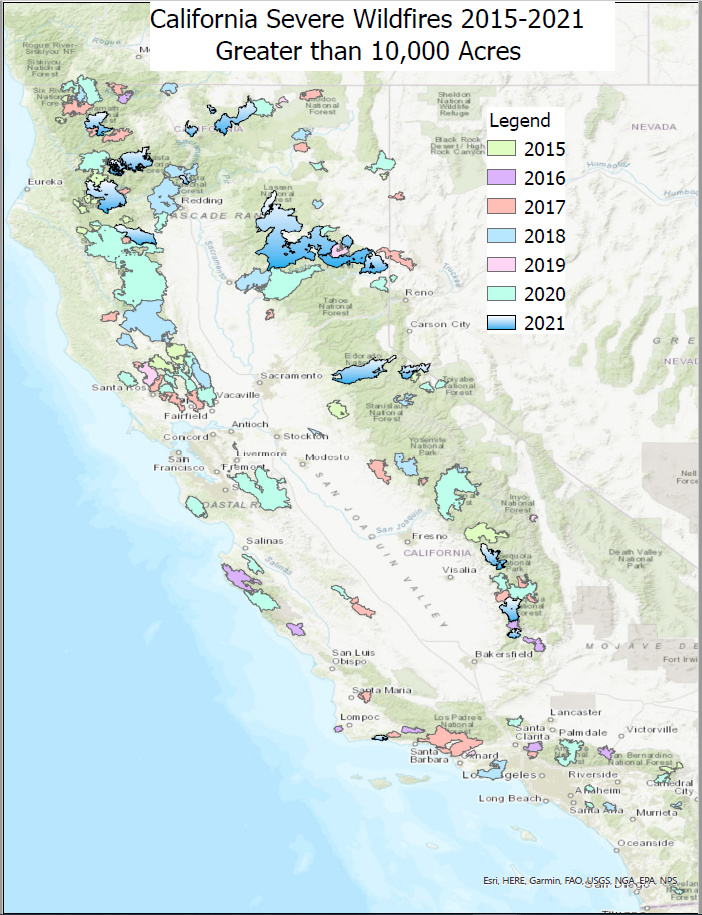
ArcGIS Pro was used to separated the records for each year wildfire from 2015 to 2020 into separate layers. A map was created of each layer for comparison. The yellow-orange-red continuous color scheme was used for all maps. A summary table was created to represent the comparison.
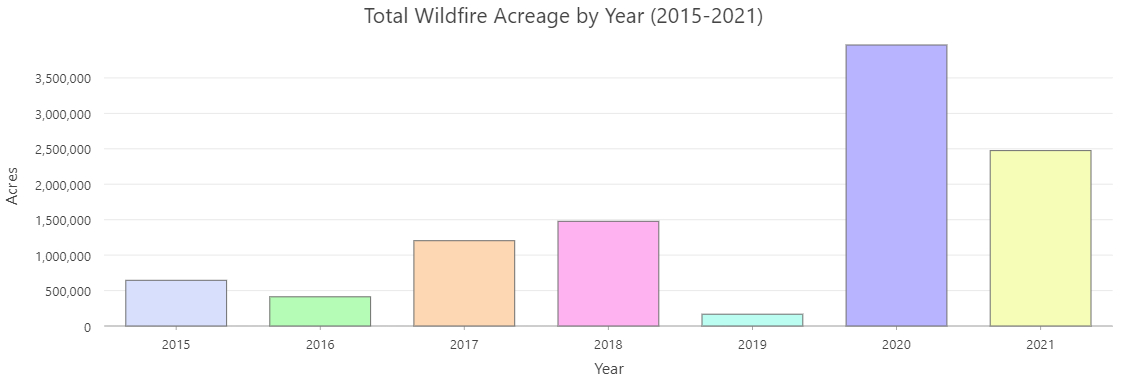
Each layer was symboloized based on graduated colors using defined intervals of 50,000 acres. A new field called GIS_Acres_Int was calculated from the GIS_Acres field to turn the value to integer for comparison. A new field called Year_Int was calculated to allow for use as a field in symbology. A bar chart was generated to see total severe wildfire acreages for each year.
Results
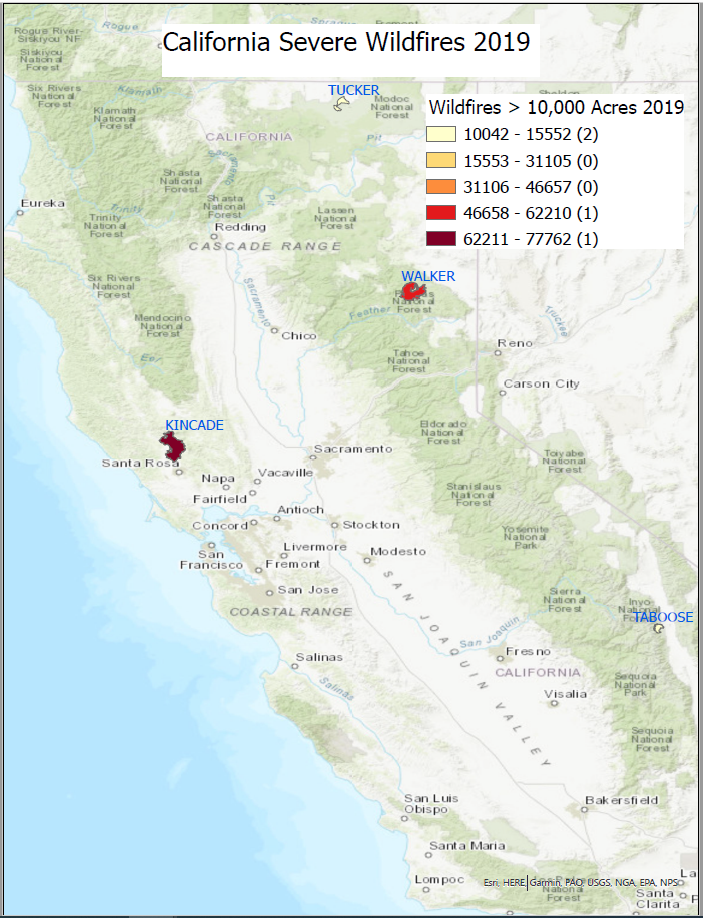
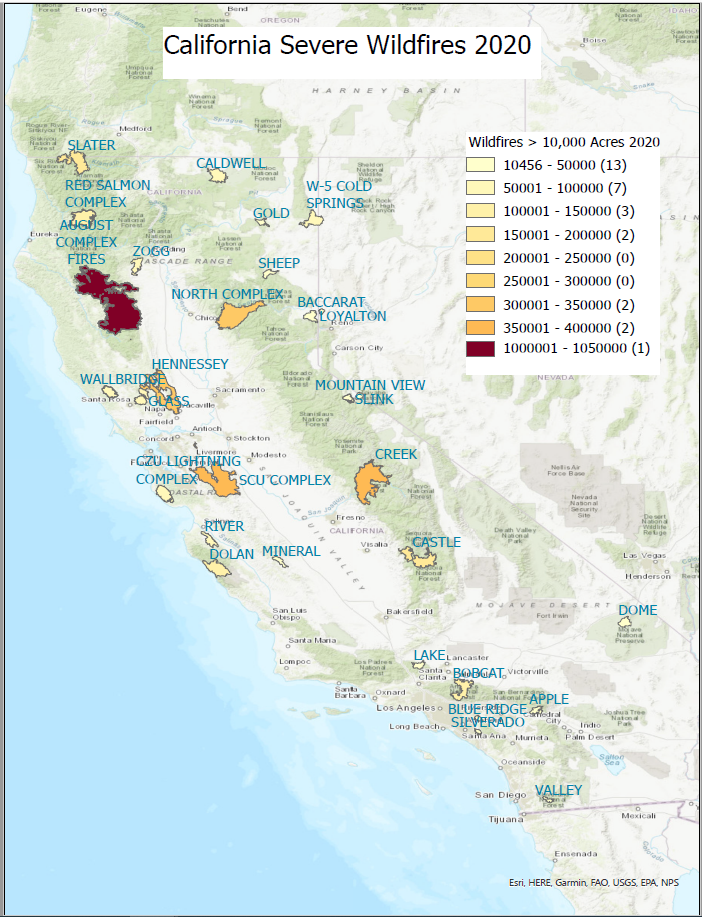
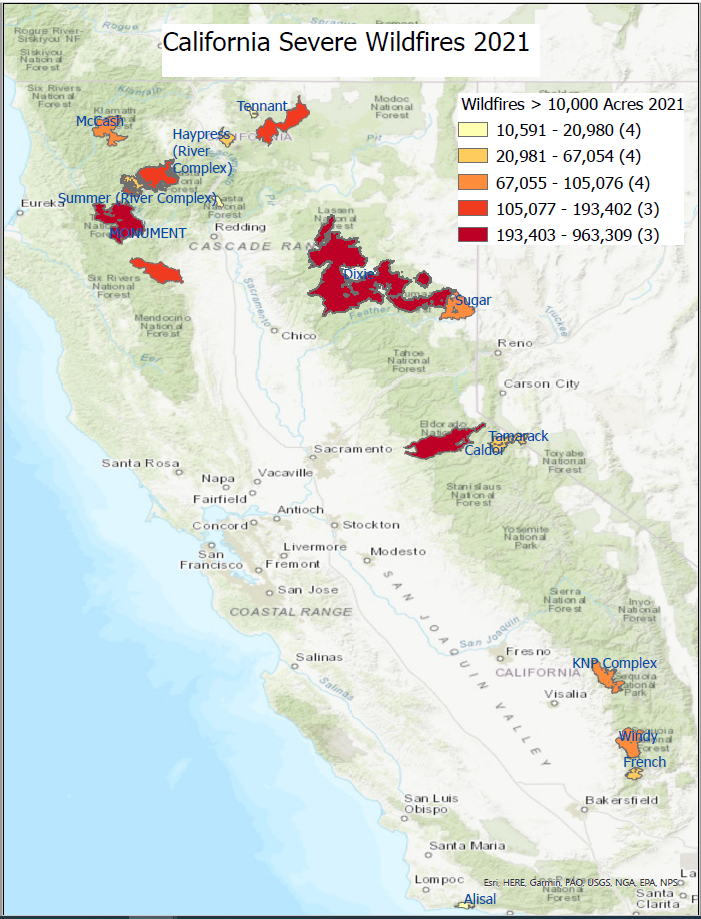
Data shows that there is a trend that severe wildfires greater than 10,000 acres is increasing from year to year, since 2015. 2019 appears to be an outlier due to small wildfire acreages compared to recent years. It is hard to draw a conclusion from this small sample size and looking at general wildfire data in California shows wildfire severity has increased exponentially relatively recently. We would need to more data to draw conclusions, but it appears severe wildfires are increasing based on this analysis.