Title
American River Bike Trail and River Access
Author
Daniel Desrosiers
American River College, Geography 350: Data Acquisition in GIS; Fall 2022
Contact Information: (email: w1233698@apps.losrios.edu)
Abstract
When I first got going on this project I had grand things in mind. I planned to use my GIS skills to fuse together topics of interest that were both helpful and useful. I soon found that my original project scope was a bit too ambitious. I needed to trim down my thoughts and ideas toa more useful and concise data set. What started out as an idea to show how people use the American Bike Trail and for what became an access to the trail project. There simply wasn't that much data to be pulled regarding trail use or activity on the trail. I suppose those ideas and foci can be investigated further later. This project ended up being focused on the American River Bike Trail itself. How to access it and where, along with points of interest and some polygon features were what my project ended up running its course as. I ended up staying forcused on a small section of Fair Oaks, Gold River and Rancho Cordova for the project.
Introduction
The project is focused on and around the American River bike trail and river access points. This projects main objective is to show how the American River is accessed in the areas
around Rancho Cordova, Fair Oaks and Gold River. Entrances and points of interest are recorded through point, line and polygon feature sets to add context and weight to data.
Also included are bike trail improvements in Rancho Cordova both in progress and completed.
Getting Started
I started in earnest with the thought that I could show how and by whokm the American River Bike Trail is used. This proved to be difficult, so I shifted my focus to what you could do on the trail which lead me to a fascinating article about birding by (The Sacramento Audubon Society). This proved fascinating but not too applicable overall, so I abandoned that path. I settled on a much more user and visually friendly approach.
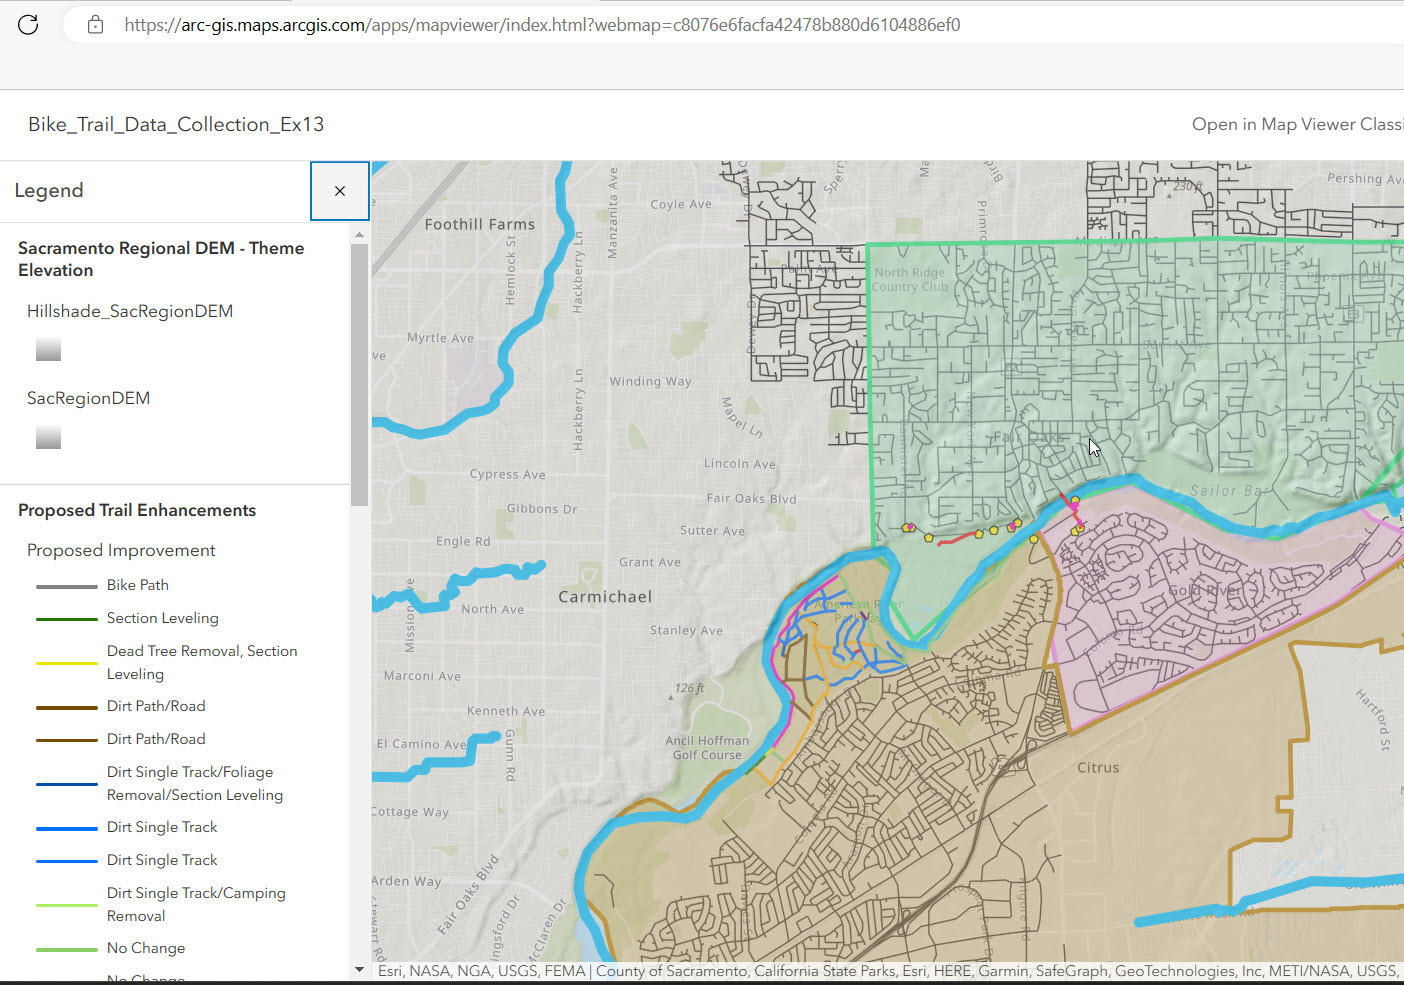
Here is an example screenshot from my web map on the trail system:
I created a web map application through ESRI's online platform called ARCGIS Online. A link to the webmap can be found here. Bike Trail Data Collection Ex13.
The web map can be manipulated to show different areas of interest or different layers of interest. Some layers are left off of the initial map for map readability and overall clean look. The layers can be toggled on or off to view the map contents. You can also zoom in or out and use the mouse to click and pan around to different areas of interest within the map.
Methods
This project began with the idea that the American River Bike Trail is used daily and by many different types of people for many different reasons and activities.
I wanted to take the approach of how the trails were used, but quickly pivoted to how to access the trails. The reason for the pivot, in method, was because the trails uses are so varied that they could hardly be adequately covered by one paper, so I instead wanted to show how and where the trail could be accessed at various locations within Fair Oaks, Gold River and Rancho Cordova. I started by layering the three different municipalities (Fair Oaks, Gold River and Rancho Crodova) for reference within the map. I then added point, line and polygon data acquired via Field Maps to show access points, points of interest and actual sections of the American River Bike trail. Lastly I incorporated trail improvements that the city of Rancho Cordova has in the works to round out the trail's current and near future.
Results
Data points collected to show river access along with trail data and points of interest. Listed below are values for each data type collected in the web map.
| Data Collected |
Points |
Lines |
Polygons |
| Unique IDs |
11 |
05 |
07 |
| Photos |
11 |
09 |
06 |
| Comments |
15 |
07 |
07 |
Here I just want to show a quick count of the data that I collected through Field Maps. I have a visual representation of the data collected in the section above under the method area. I wanted to include this data to show how more photos were added for some layer data and more information for others. The end result is legible data that is easily interpreted.
Figures and Maps
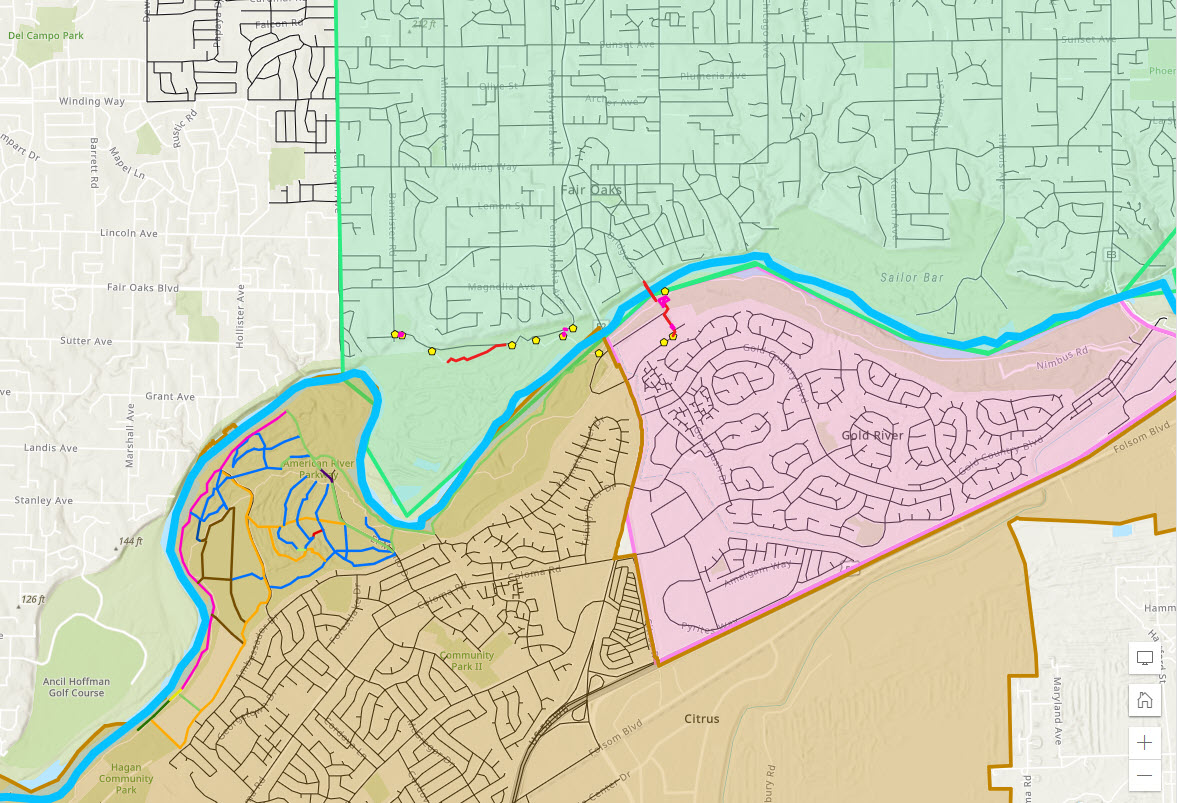
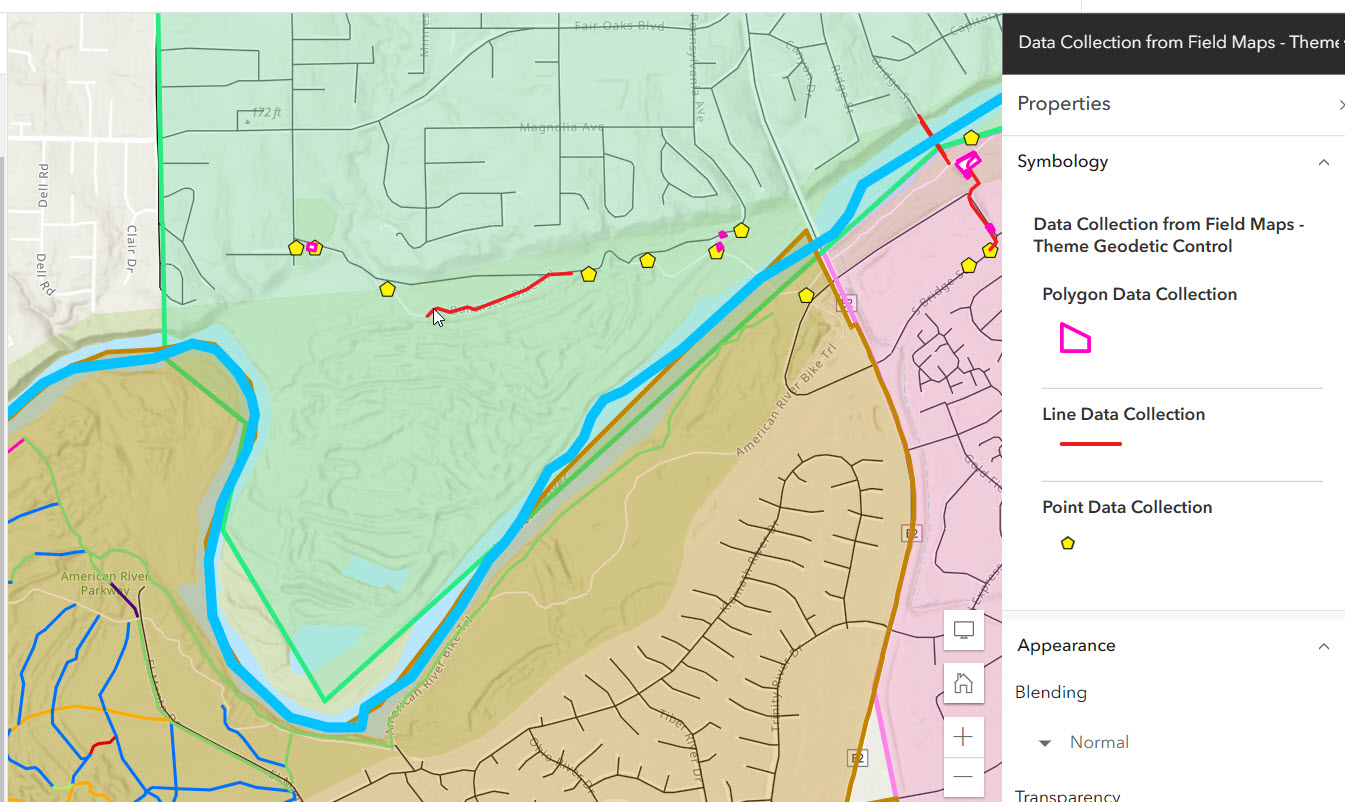
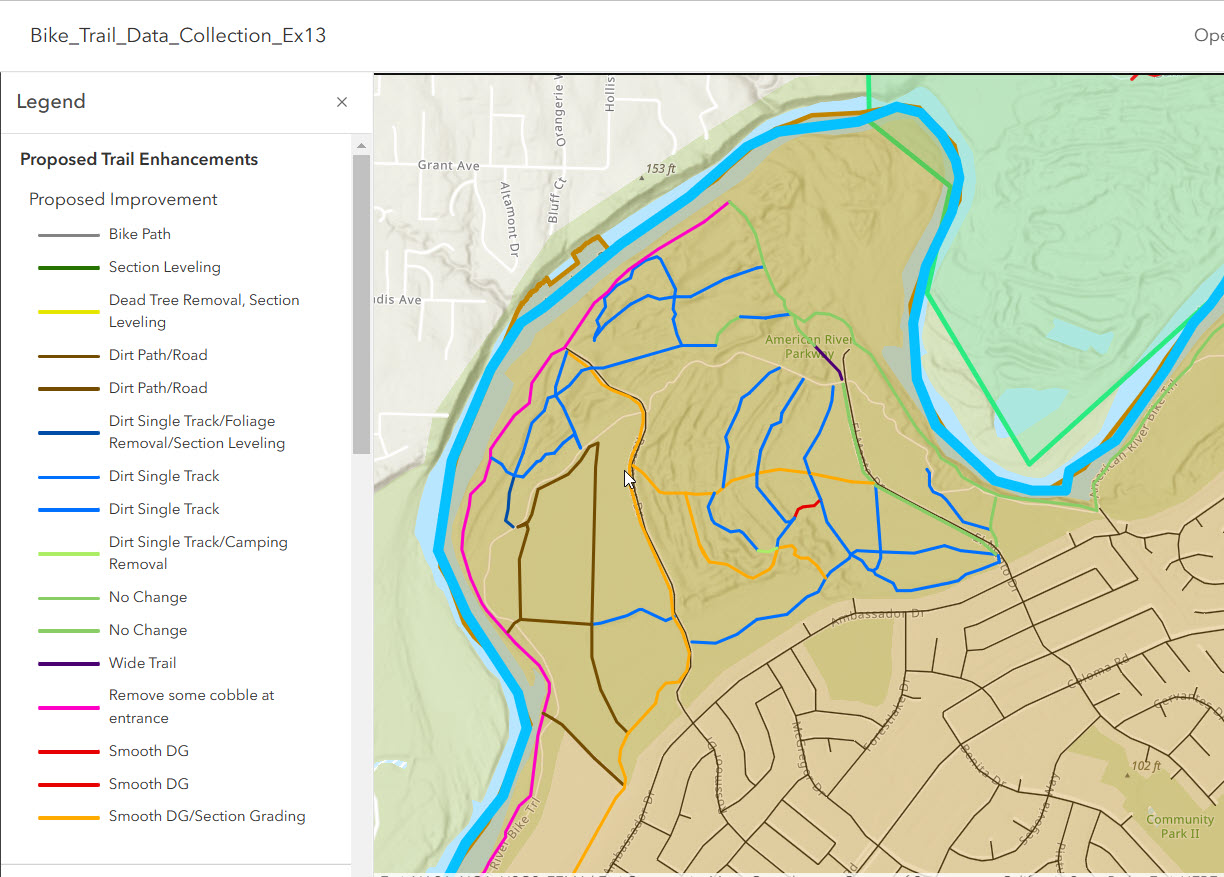
Pictured Below: (Left) All of the data points from Field Maps in Point, Line and Polygon form. (Right) All proposed American River Parkway trail developments in Rancho Cordova.
Analysis
Throughout the project I was fascinated by just how accurate our handheld devices could be. I was no more than 11 feet off from my data values using just my cell phone for data collection. I did notice how some of my polygon data was mis-clicked at times leading to incorrect shapes and area dimensions.
Conclusions
My final thoughts are how important it is to have good data. I also realize, after doing this project, how important it is to stick to a scope that is attainable and makes sense for the project. I started too large scale and had to pull it back. Also what information you tie to the data collected makes all the difference. If you have bad information associated with the data, then the data becomes much less valuable.
References
City of Rancho Cordova Bicycle Master Plan.The City of Rancho Cordova, April 4, 2016,https://www.cityofranchocordova.org/home/showpublisheddocument/11416/635996042085130000. Accessed November 26, 2022.
American River Parkway. Sacramento Audubon Society, 2021, https://www.sacramentoaudubon.org/american-river-parkway-birding-locations. Accessed November 8, 2022.
/* "G350_Desrosiers_Project.html" design and implementation by Daniel Desrosiers, Student, Geog 350, Fall 2022; code upgrades and annotations by Ian Skinner, Student, Geog 350, Fall, 2021. */