Title
Water Quality in Rancho Cordova Parks
Author
Cyd Jaghory
American River College, Geography 350: Data Acquisition in GIS; Fall 2022
Contact Information: cydskow@yahoo.com
Abstract
Effective water quality controls benefits everyone. However, the way in which water quality data is collected results in dire impacts the burden of which frequently falls disproportionately on the shoulders of lower income
populations and populations with a higher percentage of people of color. The purpose of this project was to look at water quality in Rancho Cordova, CA to answer three questions:
(1) Is there a difference in water quality in
different areas of the city?
(2) If there is a difference, does this correlate to income or race?
(3) How well do tests match provers' reported water quality?
Introduction
In 2012, with the passage of Assembly Bill 685, the California State Assembly acknowledged the basic human "right to safe, clean affordable, and accessible water adequate for human consumption, cooking, and sanitary purposes." Since that time, crises like those in Flint, Michigan have highlighted the urgent need for improved water infrastructure and a holistic approach to testing and monitoring this resource. This project explores whether there are differences in drinking water quality between parks located in Rancho Cordova, CA and to determine whether any differences between sites' water quality correlate with demographics in the area (specifically race and income). Of secondary interest was whether water testing on-site matches levels reported by local water providers.
Background
In determining how to design the project, two articles were particularly helpful: “Inequities in Drinking Water Quality Among Domestic Well Communities and Community Water Systems, California, 2011-2019” (Pace et al, 2021) and “Identifying schools at high-risk for elevated lead in drinking water using only publicly available data” (Lobo et al,2022) . Pace et al (2021) used annual water quality reporting data to look at disparities in California between large and small Community Water Systems and private wells. While acknowledging some gaps in the reporting, they were able to establish a strong correlation between water quality and race.
Lobo et al (2022) validated the use of three key features (water chemistry, socio-economic data, and proximity) in predictive modeling
for risk levels for elevated lead levels in public school drinking water as well as the use of machine learning models to predict
lead leaching in schools at a state-wide level. Lobo also looked briefly at best practices for water testing at school sites to achieve best results and highlighted multiple issues with current reporting standards.
Between the four parks at which testing occurred, water was provided by three different vendors: California American Water Company,
Golden State Water Company, and
Sacramento County Water Agency. Comparisons were made between test results and reported levels.
Methods
I acquired a statewide dataset for water districts from the California Department of Water Resources (California Open Data portal). I clipped this dataset to Rancho Cordova's city boundaries using a
shapefile from the City of Rancho Cordova's GIS Data Hub.
I created a layer to capture rough park boundaries using ArcGIS Pro, comparing boundaries to Esri's topographic base map and orthoimagery from the City of Rancho Cordova (acquired via ArcGIS Online). I then created a
buffer zone of 1/2 mile around each park, roughly representing the walkable distance from each park location. The assumption was made that neighborhood parks are used most frequently by this group. I acquired American
Community Survey datasets for average income and race by census tract from ArcGIS online. These layers were clipped using the park buffers layer.
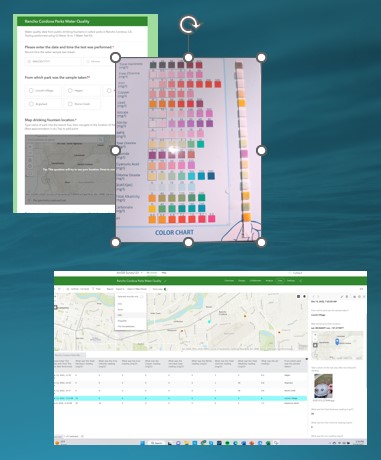
To gauge water quality, I tested one water sample from each park location using home 16-in-1 water quality test kits from SJ Wave. Data was collected using the Survey 1-2-3 app. After collection, the data was exported
as a geodatabase and as an Excel spreadsheet. I added information from each water provider's most recent accessible annual water quality report
into the Excel document, imported the spreadhseet into ArcGIS Pro and
Joined it to it's spatial layer (added from a geodatabase connection). I symbolized the water survey information based on chlorine levels, since this was the only noticeable difference between the parks'
water quality tests.
I then visually compared the differences between income/ race and higher levels of Chlorine to determine whether any correlation may be present.
Results
All water tests fell well within established Maximum Contaminant Levels AND Public Health Goals (as applicable). Variation between parks was noted in chlorine only. Two of the parks, which receive water from the same
provider, has similarly higher levels than the other parks tested. No clear correlation was detected between higher chlorine levels and either race or average income.
Tests performed matched levels reported by water providers.
| |
Argonaut |
Hagen/
Stone Creek |
Lincoln Village |
| Cl Test (ppm) |
1 |
3 |
0 |
| Provider (ppm) |
1.13 |
1 |
.72 |
As noted, chlorine levels were the only contaminant that registered on the tests. All parks' levels fell within established Maximum Contaminant Levels (4ppm) and Public Health Goals (4ppm). Hagen and Stone Creek, who both receive water from
the Golden State Water Company, registered the highest levels.
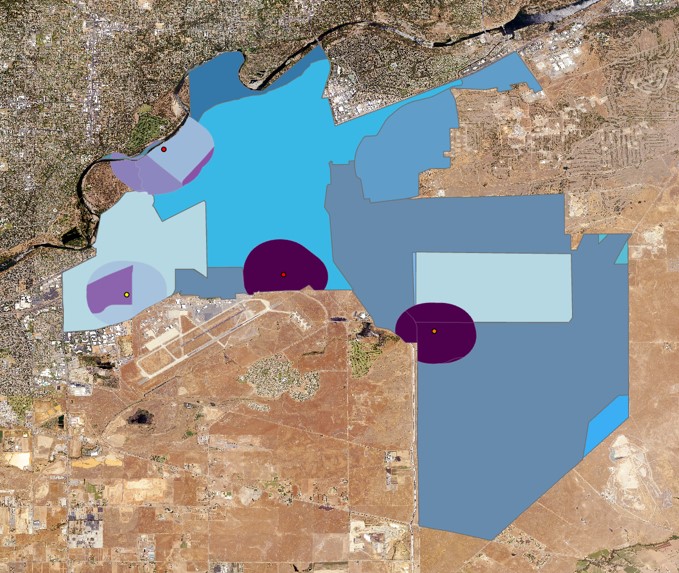
No clear correlation was observed between race and water quality. More of the parks buffers fell within areas which are predominantly white (orange colored areas), though Argonaut's walkable population buffer contained areas with a large
Hispanic population as well (green area north of the park). (Note that Argonaut's Chlorine levels were the second lowest detected.)
No clear correlation between average income levels and water quality was observed. Darker purple within the buffer aras denote higher income areas, lighter purples denote areas of lower average income.
Liconln Village Park, which had the lowest recorded chlorine level, includes areas of much lower income than some of the other parks which recorded much higher chlorine levels.
As noted earlier, water results remained consistent between parks served by the same provider. (Note: Stone Creek and Hagen Park are both served by Golden State Water Company.)
Analysis
Due to a number of factors, some predicted and others not, the project's application is fairly limited. The accuracy of at-home water kits has been demonstrated to be patchy at best. To support any decision-making would require higher quality (lab) testing.
Due to time constraints, each park's water was tested only once; 3-4 collections over a period of time averaged would have been preferable.As an exercise in public data collection, I believe this projecct was a success.
The Survey 1-2-3 data collection tool made collecting test results, including location data and photos, really simple. Exporting the data in usable format presented a problem, but with easy workarounds in ArcGIS Pro. The project originally
included five parks, but one park was removed as I was unable to locate information from its water provider for comparison.
Conclusions
It would be interesting, and worthwhile, for the City of Rancho Cordova to consider performing targeted water quality testing on a regular basis in its parks using higher quality tests. In addition to the contaminants measured by
at home kits (lead, copper, chlorine, nitrates, and such), testing could include bacterial levels. As a public good, ensuring our most vulnerable populations have access to safe, clean drinking water would seem to justify this
fairly minimal expense.
References
California American Water. "2021 Annual Water Quality Report." https://www.amwater.com/caaw/resources/PDF/CCR-reports/suburbanrosemont_2021.pdf. Accessed 2022-12-12.
EPA Fact Sheet: "Lead and Copper - Suggested Directions for Homeowner Tap Sample Collection Procedures" 2019-05-29, updated: 2022-04-12. https://www.epa.gov/sites/default/files/documents/LCR_Sample_Form.pdf. Accesseed 2022-11.
EPA Fact Sheet: "Stronger Protections from Lead in Drinking Water: Next Steps for the Lead and Copper Rule" 2021-12.https://www.epa.gov/system/files/documents/2021-12/lcrr-review-fact-sheet_0.pdf. Accessed 2022-11.
Golden State Water Company. Cordova Water System: Consumer Confidence Report on Water Quality for 2021. 2022. https://www.gswater.com/sites/main/files/file-attachments/water-quality-cordova.pdf?1654034039. Accessed 2022-12-12.
Lobo, G.P. et al."Identifying schools at high-risk for elevated lead in drinking water using only publicly available data." Science of the Total Environment, vol. 803. 2022-01-10. https://www.sciencedirect.com/science/article/pii/S0048969721051214. Accessed 2022-11-07.
Pace, Clare et al. "Inequities in Drink Water Quality Among Domestic Well Communities & Community Water Systems, California 2011-2019." American Journal of Public Health. 2021-12-22. https://ajph.aphapublications.org/doi/10.2105/AJPH.2021.306561. Accessed 2022-09-24.
Sacramento County Water Agency: "2021 Annual Water Quality Report - North Service Area." https://www.gswater.com/sites/main/files/file-attachments/water-quality-cordova.pdf?1654034039. Accessed 2022-12-12.