Title

Humboldt Bay: Eelgrass Decline and the Impact of Aquaculture

Author

Lily Johnson
American River College, Geography 350: Data Acquisition in GIS; Fall 2022
Contact Information: w1945609@apps.losrios.edu

Abstract

This project explores changes in eelgrass (Zostera marina) distribution in Humboldt Bay, California from the year 2009 to 2018. I also examine and map the location of aquaculture beds from Coast Seafood, an oyster farming business. I found that there appears to be a decrease in total area of eelgrass in the Humboldt Bay region between 2009 and 2018. By accounting for the total area of aquaculture polygons that appear to be missing from the 2018 data, there is even more of a decrease in eelgrass distribution. Further research on different threats to eelgrass could attempt to explain this decrease.

Introduction

Humboldt Bay located in Northern California is a prominent and vital stop along the Pacific Flyway, a major migratory pathway for Northern Hemisphere bird species. This area contains 30-45% of California’s remaining eelgrass (California Audubon, 2018), an important food and habitat resource for many of the migratory birds that come through the area. For that reason, eelgrass conservation in Humboldt Bay is of concern to many environmental organizations. One of the many threats to eelgrass in Humboldt Bay is oyster farming, a type of aquaculture. In this project, I wanted to evaluate and analyze if there has been changes in eelgrass distribution over time. I also wanted to examine and uncover any impacts of oyster farming to the eelgrass distribution of Humboldt Bay. .

Background

Eelgrass is an important resource for many different species, and has been thoroughly studied. Moore et al (2003) highlight how eelgrass in particular is important for migratory bird species along the pacific flyway. In this article, researchers are trying to see if there is a spatial relationship between eelgrass and black brant geese along multiple stops on the Pacific migratory flyway. Researchers used a multiple regression analysis of historical brant data and abundance of eelgrass at peak brant sites and their isolation from other areas to determine if there was indeed a strong spatial relationship. They concluded that such a relationship exists, therefore it is important to protect large eelgrass populations, especially those in larger bays that are more isolated along the Pacific flyway. Given the proven importance of eelgrass in Humboldt Bay, I thought it would be interesting to see if there were any visible changes in eelgrass distribution to the bay, and explore any causes for this potential decline.

Methods

To see if there have been any changes in eelgrass distribution in Humboldt Bay over time, I obtained two different eelgrass datasets. The first eelgrass dataset came from the California Department of Fish and Wildlife, and the data was from 2009. The second dataset came from Pacific Marine and Estuarine Fish Habitat Partnership (PMEP) from 2018. Both datasets were downloaded and the uploaded to ArcGIS Pro. To prepare the data for analysis in ArcGIS Pro, I performed a location query to remove unneeded eelgrass data (both datasets contained eelgrass distribution along the West Coast), , I utilized the Raster to Polygon geoprocessing tool, and made symbology changes to clearly reflect the eelgrass distribution of Humboldt Bay. I obtained a spreadsheet from Coast Seafood, a business that participates in aquaculture in Humboldt Bay California, that shows the geographic coordinates of each corner point of the various aquaculture beds they have located in the bay. I copied and parsed this data in excel using the text to column feature, uploaded into ArcGIS Pro, and then utilized the XY Table to Point tool to display the XY coordinates as points in ArcGIS Pro. I created a polygon feature class, and used the points to create polygons for the aquaculture beds. I used ArcGIS Pro to calculate the total shape area of all the polygons of the datasets.

Results

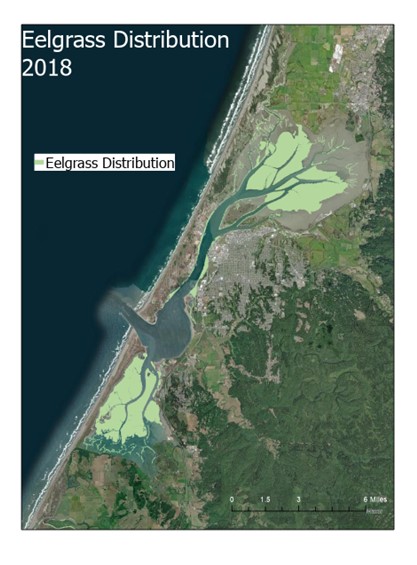
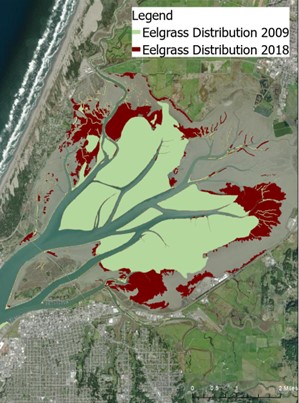
Using the methods above, I produced the following images. The third map highlights the highlights the difference in distribution between 2009 and 2018.

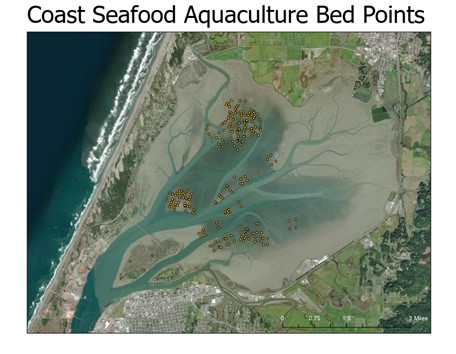
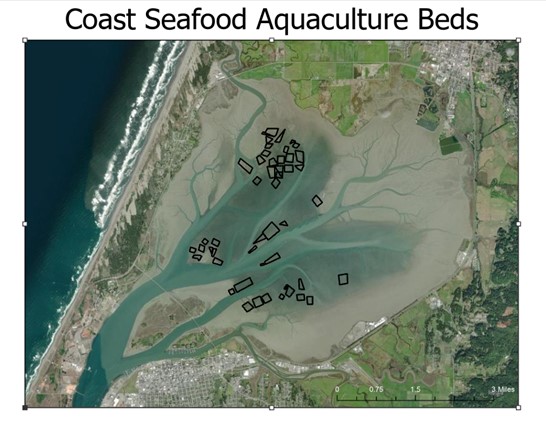
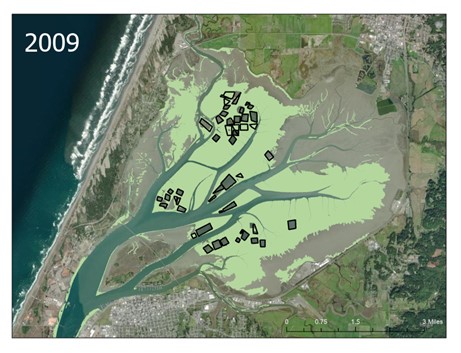
The two images below show Coast Seafood aquaculture points and Coast Seafood aquaculture polygons.

The table below shows the total area of eelgrass for each year. In 2009, the total area of eelgrass was approximately 9.924 acres. In 2018, the total area decreased to approximately 8,902 acres.
Eelgrass Distribution YearTotal Area (square meters)Total Area (Acres)
200940,160,5199,924
201836,026,0648,902
2018 Adjusted34,160,5348,441

Analysis

According to available data, between 2009 and 2018 eelgrass decreased by 1,022 acres, which is a 10% decrease. However, it appears that that the data collected in 2009 clearly accounted for the aquaculture beds within the bay while the culture beds seem to not be represented in the eelgrass distribution from 2018.. Operating under the assumption that the aquaculture beds still are present in 2018, I then removed the total area of the aquaculture bed polygons within the 2018 extent (461 acres) from the total area from 2018. The new total area is reflected in the table in the results section. Between 2009 and 2018 (accounting for culture beds), eelgrass decreased by 1,483 acres, which is a 15% decrease.

Conclusions

It appears that between 2009 and 2018, eelgrass did decline in Humboldt Bay. However, it is beyond the scope of this data and my own personal skillset to determine the cause of the decline. While oyster farming aquaculture is a known threat to eelgrass, based on the changes in distribution it is not clear that oyster farming caused the observed decline. I think an interesting potential future project could include examining other threats to eelgrass and attempt to uncover a correlation or pattern.

References

Audubon California, 2018. Protecting Humboldt Bay. https://ca.audubon.org/conservation/conservation/seas-shores/humboldt-bay

California Department of Fish and Wildlife Eelgrass Dataset:https://map.dfg.ca.gov/metadata/ds1503.html

Coast Seafoods Company Geographic Coordinates: http://humboldtbay.org/sites/humboldtbay2.org/files/Bed%20Marking%20Corners_2pgs.pdf

Moore, Jeffery E., et al. 2003. “Staging of Pacific flyway brant in relation to eelgrass abundance and site isolation, with special consideration of Humboldt Bay, California” Biological Conservation, vol. 21, no. 3, 2004. Science Direct, https://www-sciencedirect-com.ezproxy.losrios.edu/science/article/pii/S0006320703001642 ; Accessed 2022.11.08

Pacific Marine and Estuarine Fish Habitat Partnership West Coast USA Eelgrass Habitat Dataset: https://www.pacificfishhabitat.org/data/west-coast-usa-eelgrass-habitat/

/* "G350_Template1_Project_Advanced.html" design and implementation by Anne Millington, Student, Geog 26, Fall 1999; code upgrades and annotations by Ian Skinner, Student, Geog 350, Fall, 2021. */