Wildfires and Soil Erosion in the Upper Feather River Watershed
Author Information
Nick Long-Rinehart
American River College, GIS 350: Data Acquisition in GIS
Fall 2022
Abstract
Wildfire patterns are becoming an increasingly influential factor that influences local hydrological cycles. Fires disrupt vegetative adaptations that retain water in forest ecosystems and have a correlation with higher levels of soil erosion. This study uses ArcGIS Pro to analyze the environmental impacts that wildfires have had on the wetlands and topsoils of the Upper Feather River Watershed in the last six years. Spatial analysis of the distribution of fire perimeters, wetlands, and soil erosion will provide insights into the relationships that each environmental factor has on each other, and may be used as a rudimentary risk assessment of areas at higher risk.
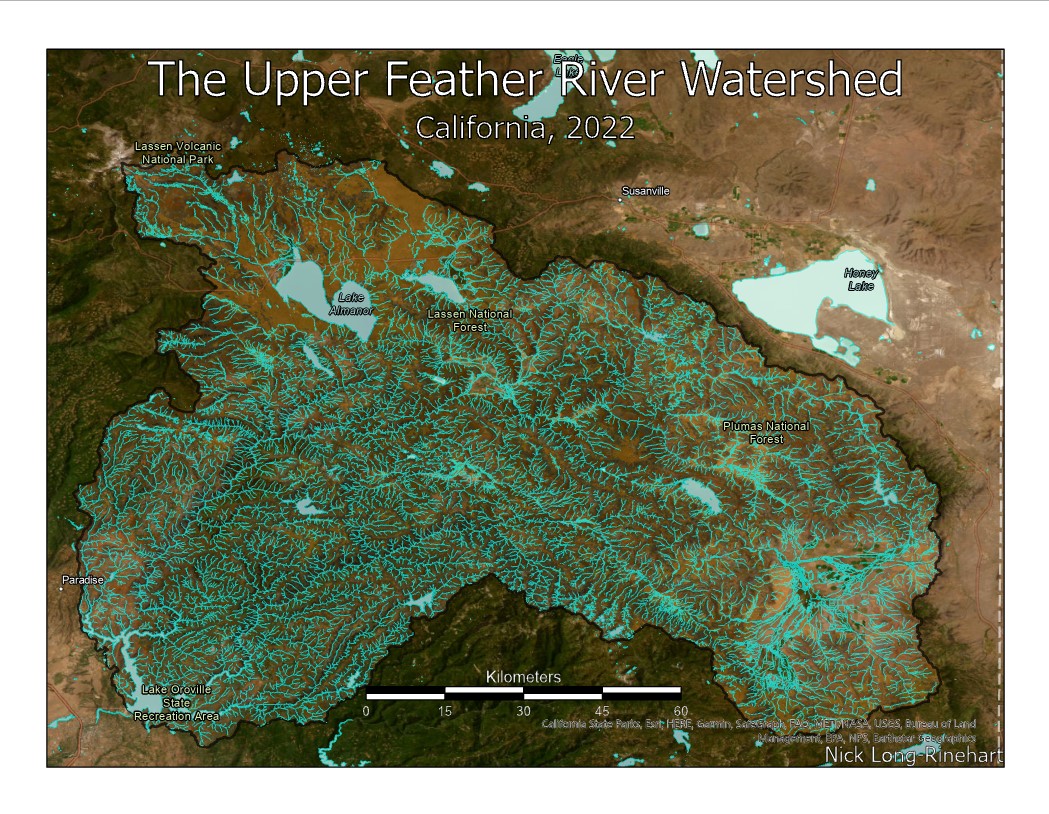
The Upper Feather River Watershed (UFRW) flows into the Lake Oroville Reservoir and the Oroville Dam, which is the largest reservoir in the California State Water Project (which manages the distribution of significant amounts of water and hydroelectric resources to CA residents). In February 2017 the main and emergency spillways of the Oroville Dam suffered extensive erosion damage after heavy rainfall in the region significantly increased the water level in Lake Oroville Reservoir. The Oroville Dam spillways are at risk of collapse if further buildup of sediment occurs in the reservoir or elevated water levels compromise the reservoir's capacity.
The potential for increased erosion and streamflow during another heavy rainfall event in the spillways of the Oroville Dam may have increased due to the wildfires that have recently occurred in the Upper Feather River Watershed. In the last six years there have been 47 wildfires within the perimeter of the watershed, including the Dixie Fire and the North Complex Fire. High-severity wildfires that impact forests are more likely to increase streamflow, flooding, soil erosion and the buildup of sediment in watersheds and water reservoirs due to the significant loss of vegetation that reduces overland water flow.
This research project used ArcGIS Pro 3.0.1 and spatial data analysis to determine where recent fires have impacted the watershed, assess the scale at which those fires have impacted the local wetlands, and determine if there is any correlation between fire perimeters and soil erosion levels within the watershed.
The Upper Feather River Watershed has had 47 wildfires within the last six years that have burned a significant amount of the forested area within the basin. Since the Oroville Dam has already had damage from a collapse in the floodgates in 2017, it may be susceptible to further high-risk events if flooding conditions persist within the watershed. Williams et al. (2022) measured the change of hydrological streamflow in 29 different basins throughout the Western United States that had at least 20% of their forested areas burn within the last six years, and found that streamflow increased by an average of 30% in the first six years after fires occurred in the measured basins (in comparison to 107 control basins that experienced negligible fire damage). This significant increase in hydrological streamflow in the burned basins was most acute immediately after the fire, and eventually the loss of water retention in the burned forests became more evident in Spring and Autumn seasons. These kinds of wildfire patterns are becoming an increasingly significant factor in California’s hydrological cycle as a loss of water retention in forested soils often leads to more arid ecosystems that replace the previously wet forested areas.
Although riparian areas are less likely to burn in a wildfire than other forested areas (due to moisture content in the vegetation), understanding fire regime characteristics in these essential environments is critical as climate change continues to increase the frequency and intensity of wildfire regimes (Bendix and Commons, 2017). After a wildfire, forests tend to lose more water retention capability than other vegetative ecosystems due to the elevated precipitation levels in the environments where forests tend to grow, the loss of moisture retention in the canopy and soils of vegetative species, and heat and ash give post-fire soils water-repellent properties that increase the rainwater lost to overland flow. The fire-induced increases in streamflow often reduce water quality through the accumulation of sediment and plant debris in waterways due to the increased erosion levels in the area. The Revised Universal Soil Loss Equation (RUSLE) model has been commonly used by CAL FIRE FRAP to determine a best-estimate of post-fire soil erosion levels by incorporating multiple influential factors into a comprehensive formula (Wishmeier & Smith, 1978). The risk of enhanced flooding and landslides, combined with the reduction of storage capacities in affected watersheds and reservoirs will continually require the investment of resources towards dam/reservoir maintenance and environmental hazard assessment.
There were four framework themes that contributed to the spatial analysis of the watershed:
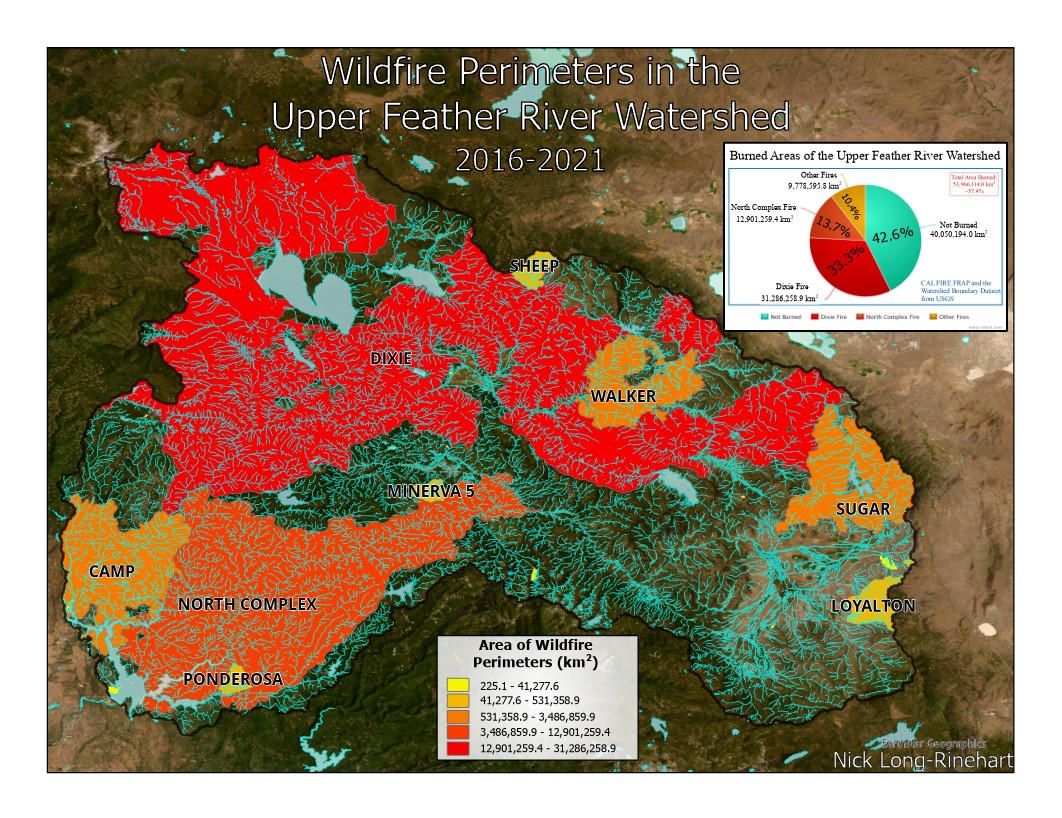
To assess the extent of area that has burned in the Upper Feather River Watershed within the last six years, the Fire Perimeters feature class was clipped (using the Watershed Boundary feature class) to exclude the many fires that have occurred outside of the watershed. Then, an attribute query was used to select all of the fires that have occurred in the watershed since 2016. The selected features were exported as a feature class to represent all of the recent fire perimeters within the target watershed. A field statistics chart was used to analyze the Shape_Area field, and the relative areas of the two biggest fires (Dixie and North Complex) were collected alongside the total area of fire perimeters within the watershed. A Union was then performed between the Fire Perimeters feature layer and the Watershed Boundary feature layer. The area of the Fire Perimeters layer and the area of the Union feature layer were used to determine the proportion of the total area of the watershed that is within the CAL FIRE FRAP Fire Perimeters. The values were calculated and a pie chart was produced to represent the data. Finally, the Fire Perimeter layer was symbolized using Graduated Colors for the Shape_Area field, the biggest fires were labeled, and a thematic map was developed to illustrate the extent of fire damage the watershed has experienced since 2016.
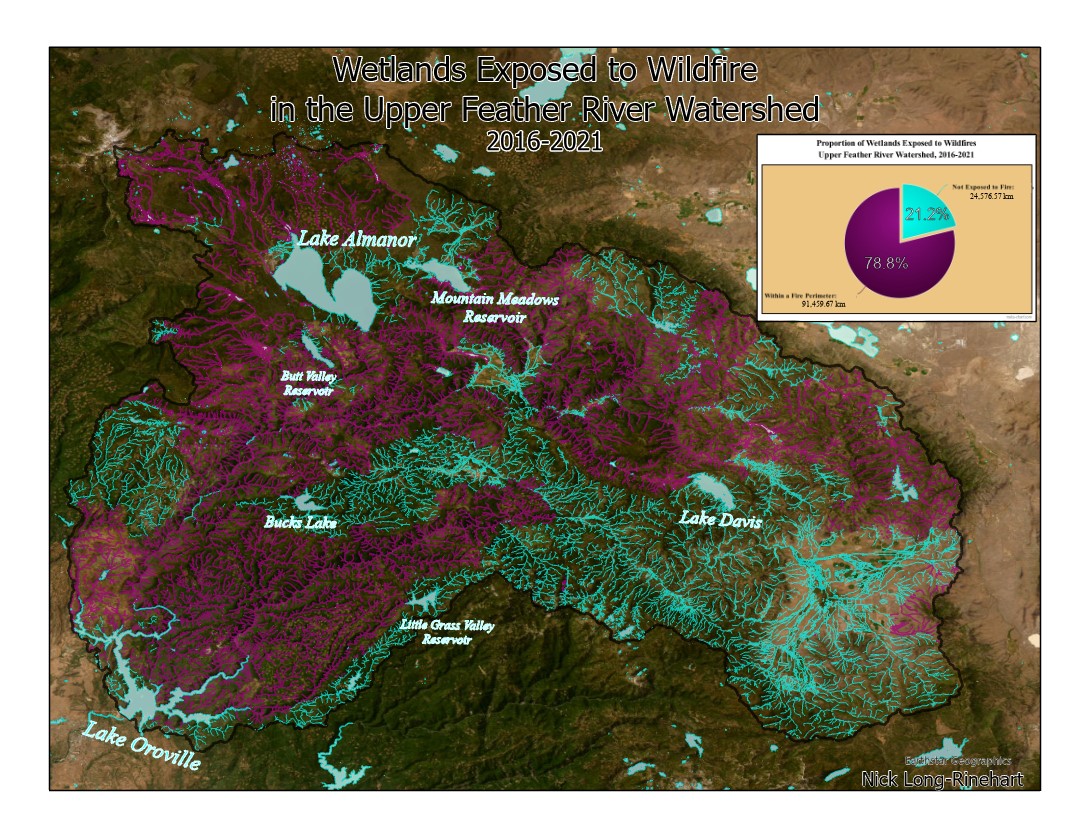
The assessment of the impacts that fire had on local Wetlands began with a clip of the Wetlands layer (using the Watershed Boundary feature class) to isolate data from the study area. Then a spatial query was performed to select all of the Wetland features that had portions of their perimeters within any of the Fire Perimeters in the watershed. A field statistics chart was produced for the Shape_Length field in the Wetlands feature layer, as the Shape_Length represents the extent of the transitional riparian zones that have flammable vegetation and will be where the soil sediment is more likely to enter the waterways. A proportional analysis was performed between the selection set and the total Shape_Length value, and a pie chart was produced to represent the data. The Wetlands layer was symbolized to demonstrate the areas within Fire Perimeters and the areas outside of Fire Perimeters, and the biggest Lakes in the reservoir were annotated to produce a thematic map representing Wetlands within the watershed.
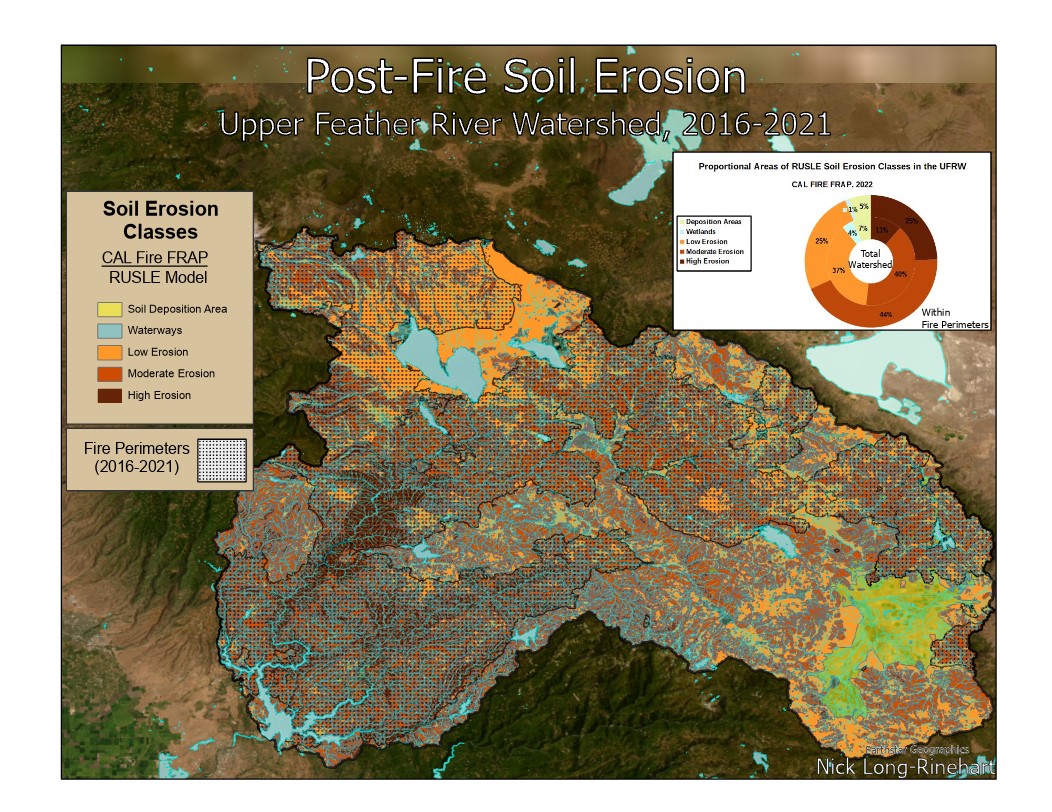
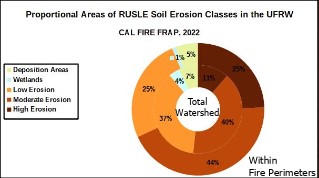
To perform spatial analysis for the Soil Erosion framework theme, it was necessary to convert the CAL FIRE FRAP Postfire Soil Erosion raster TIFF file into a vector feature layer file, and then change the symbology to Graduated Colors using the gridcode field (which represents the RUSLE model Soil Erosion Classes from CAL FIRE FRAP). A clip was then performed (using the Watershed Boundary layer) to limit the Soil Erosion feature layer to the Upper Feather River Watershed. The relationship between Soil Erosion and Fire Perimeters was investigated by performing multiple attribute queries to select groups of features by their gridcode values/Soil Erosion Classes. Then, each selection set (representing a whole set of gridcode values/Soil Erosion Classes) was subjected to a spatial query to determine which of the selected features exist within any of the Fire Perimeters. The Shape_Area value of each Soil Erosion Class was recorded, as well as the Shape_Area of the whole watershed. Multiple analyses were performed on the data, but the change in proportional area of each different Soil Erosion Class between the Fire Perimeters and the total watershed was determined to demonstrate the strongest statistical significance. Two graphs were produced from the data (Relative Total_Area of each Soil Erosion Class and Proportional Total_Area of each Soil Erosion Class), as well as one symbolized and edited thematic map.
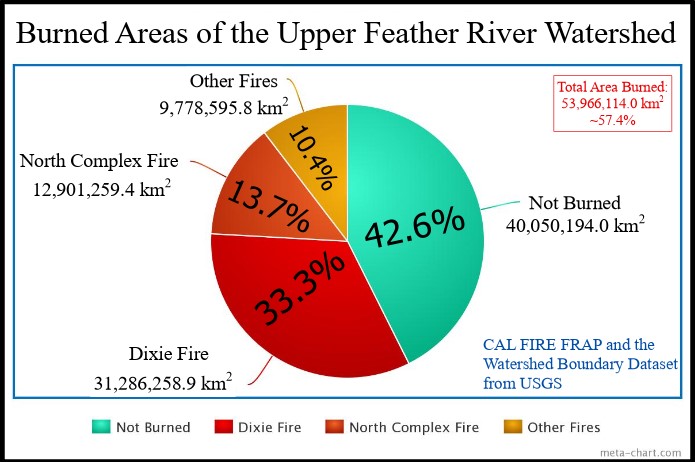
The value of each Fire Perimeter area was calculated in the Chart Properties tab and proportions were determined using the sum of the Shape_Area field as a denominator for all calculated values:
53,966,114.043 km2 (Area of all fire perimeters) / 94,016,308.042 km2 (Total area of watershed) = 57.4% (Proportion of Upper Feather River Watershed that has burned from 2016-2021)
Further calculations were performed to produce the data in the following chart and map:
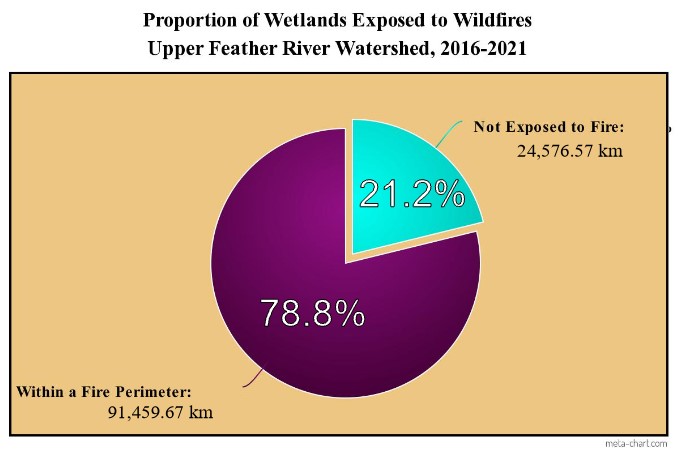
The proportion of Wetlands exposed to Fires was calculated by determining the difference between the total length of wetlands in the Upper Feather River Watershed and the length of all of the wetlands within Fire Perimeters:
116,036.24 km (Shape_Length of Wetlands in the UFRW) - 91,459.67 km (Shape_Length of Wetlands within Fire Perimeters) = 24,576.57 km (Shape_Length of Wetlands not exposed to fire)
Then, the percentage of each respective group of wetlands was calculated using the total Shape_Length of Wetlands in the UFRW:
24,576.57 km (Shape_Length of Wetlands not exposed to fire) / 116,036.24 km (Shape_Length of Wetlands in the UFRW) = 21.2 % (Proportion of Wetlands in the UFRW that are have not been exposed to wildfires since 2016)
91,459.67 km (Shape_Length of Wetlands within Fire Perimeters) / 116,036.24 km (Shape_Length of Wetlands in the UFRW) = 78.8 % (Proportion of Wetlands in the UFRW that are within Fire Perimeters)
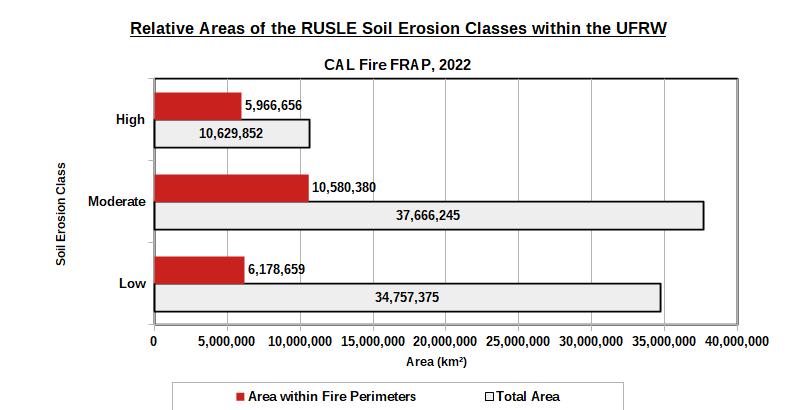
The relationship between Soil Erosion and Fire Perimeters was measured by calculating the area of each RUSLE Soil Erosion Class in the entire watershed and comparing those values to the area of the same RUSLE Soil Erosion Classes within the Fire Perimeters:
These relative areas are then converted into proportional percentages using the total area as the denominator again and the same formulas that were used with the Fire Perimeters and the Wetlands.
Fires that occurred in the Upper Feather River Watershed from 2016-2021 impacted ~57.4% of the area of the entire watershed. This is a significantly higher portion of the watershed than the 20% threshold that Williams et al. (2022) linked with a 30% increase in streamflow throughout watersheds that had burned in the previous 6 years. This suggests that the streamflow of many waterways in the Upper Feather River Watershed may increase significantly during heavy rainfall events in the near future.
Furthermore, 78.8% of the wetlands in the UFRW have been exposed to wildfires between 2016-2021. Although the Fire Perimeters feature class does not illustrate the severity of the fire and the damage it causes to local plant communities, the immense area that has been recently altered by fires in the watershed is surely influencing local ecosystems.
Although the High Soil Erosion Class category has a relatively small area throughout the Upper Feather River Watershed, there was a strong correlation between Fire Perimeters and higher levels of erosion. The High and Moderate Soil Erosion Classes had significantly higher representation in the Fire Perimeters, which noticeably increased the proportional area of the High and Moderate Soil Erosion Class values among the other Soil Erosion Classes within Fire Perimeter boundaries. High Erosion Class values accounted for 25% of the total area within Fire Perimeters, compared to only 11% of the total area of the UFRW, and seem to be most prevalent along the North Fork of the Feather River (where there has been significant fire damage from the Dixie and North Complex fires. Low Soil Erosion Areas and Waterways had significantly smaller areas within the boundaries of the Fire Perimeters when compared to the entire watershed.
It is becoming critically important to gain more of an understanding of the dynamics between wildfires and watersheds as climate change increases the frequency of extreme weather events that may threaten our critical reservoirs and water resources. Wildfires have had a significant influence in the Upper Feather River Watershed in the last six years. In that small span of time more than half of the watershed has burned, 78% of wetlands/riparian areas have been exposed to wildfires, and higher levels of erosion frequently occur in areas that have recently burned (most evidently in the North Fork of Feather River). Lake Oroville and the Oroville Dam will likely continue to experience rainfall events where the integrity of the dam and spillways is put at risk due to dangerously high water levels and good soil pulled downstream. Precision replanting in burn areas/riparian zones, dredging Lake Oroville, and a fire regime that involves frequent controlled burns could avert further damages to the dam. Either way, risk assessments such as this project will continue to be important contributions to the effective management of our natural resources.
Bendix, J., & Commons, M. G. (2017). Distribution and frequency of wildfire in California riparian ecosystems. Environmental Research Letters, 12(7), 075008. Accessed September 22, 2022. Available: https://iopscience.iop.org/article/10.1088/1748-9326/aa7087/pdf
MacDonald, L. H., & Larsen, I. J. (2009). Runoff and erosion from wildfires and roads: effects and mitigation. Land restoration to combat desertification: Innovative approaches, quality control and project evaluation. Accessed October 24, 2022. Available: https://www.geo.umass.edu/geomorphology/sites/www.geo.umass.edu.geomorphology/files/MacDonald-and-Larsen-2009-Land-Restoration.pdf
Mathews, D. (2021). Trees in Trouble: Wildfires, Infestations, and Climate Change. Counterpoint.
Rogers, B. M., Balch, J. K., Goetz, S. J., Lehmann, C. E., & Turetsky, M. (2020). Focus on changing fire regimes: interactions with climate, ecosystems, and society. Environmental Research Letters, 15(3), 030201. Accessed September 24, 2022. Available: https://iopscience.iop.org/article/10.1088/1748-9326/ab6d3a/pdf
Williams, A. P., Livneh, B., McKinnon, K. A., Hansen, W. D., Mankin, J. S., Cook, B. I., Smerdon, J.E., Varuolo-Clarke, A.M., Bjarke, N.R., Juang, C.S., & Lettenmaier, D. P. (2022). Growing impact of wildfire on western US water supply. Proceedings of the National Academy of Sciences, 119(10), e2114069119. Accessed November 3, 2022. Available: https://www.pnas.org/doi/full/10.1073/pnas.2114069119
Wishmeier, W. H. & Smith, D. D. (1978). Predicting rainfall erosion losses–a guide to conservation planning. Agricultural Handbook, 537. Washington DC: U.S. Department of Agriculture.