-
Utilizing Geographic Information Systems for Mental Health: Exploring Community Environment Stressors
American River College, Geography 350: Data Acquisition in GIS; Fall 2022
LisaMarie P. Miramontes, Ph.D. rosamundlm@hotmail.com
Abstract
Utilizing GIS in public health has existed for decades yet using GIS for mental health is just emerging. The purpose of this project was the explore potential use of GIS for mental health services. Participants from a school-based program in the Bay Area were mapped with stressors such as poverty and housing burdens made available from the Disadvantaged Communities Report.
Intended findings included understanding the participant environment and using findings for grants/funders and agency reports. Discovered findings included training use and changing the narrative in grants and reports for funders and the agency.
Introduction
The use of maps for public health concerns dates back to at least the 1850. Physician John Snow, who is considered one of the founders of modern epidemiology, traced the source of a cholera outbreak in London to a water source by mapping patient locations. While GIS is frequently used in most public health sectors, GIS use for mental health is far behind but slowly developing.
The project analyst (PA) of this report works in both behavioral health and mental health and has used previous skills along with taking Geography 350 to develop further skills and map data relevant for an agency serving participants with mental health symptoms.
Project Description
The purpose of this project was to explore potential use of GIS with a mental health services agency. Below is an introduction to the agency followed by the intended outcomes of this exploratory project.
Fred Finch Youth & Family Services (FFYC*) provide mental health services to children and young adults aged 0-25. Twenty-five programs offer a range of services, including residential, homeless young adult, school-based counseling, and in-home services. Established in 1891, a founding principle was "that no one--regardless of their background, financial status, or personal challenges--should be neglected or forgotten."
The Senior Director who oversees the Data Department for FFYC made the decision to support the internal data evaluator to bring their GIS experience to explore how GIS might be utilized for the agency. Intended findings included the following:
-
• Expanding services
• Use of GIS for grants/development
• Understand our participants environment
• Agency reports--include participant challenges in their community
• Acuity and trauma patterns (acuity is based on need for action with assessment of factors such as anxiety, living situation, and family strength)
This project focused community stressors, such as poverty and housing burdens. Although acuity was mapped, it was not included in the final report. Similarly, data was obtained for mapping areas lacking mental health services was not included but will be utilized for the agency. )
*The FFYC acronym is still used, based on the agency original name Fred Finch Youth Center)
-
Methods
The datasets used for this project included two that were prepared for use: Disadvantaged Communities Reports 3.0 (1) and alcohol outlets prepared by the Prevention Research Center (originally accessed from Alcohol and Beverage Control), both last updated in 2018. For the disadvantaged communities tracks were used to define percentiles to small locations to show more variability. Data was isolated for both Alameda County and Oakland. Attributes selected for percentiles (e.g., 70 and higher) for the variables listed below were converted to a separate shapefile to map the highest disadvantaged communities:
- • High poverty
• Housing burdens
• High unemployment
• Education attainment
For alcohol outlets, off-sale alcohol outlets (for consumption at another location) were selected and isolated for both Alameda County and Oakland in California.
One moderate sized program was chosen for this project. Participants have ranging acuity and most reside in Oakland, California. Unprepared data from an electronic health record was downloaded for participant data. Steps for cleaning the participant data included adding columns for program name and acuity. Acuity percents were then used to create a column for acuity type: low, moderate, high, and very high and labeled using a formula in Excel. A spatial join was created for acuity to show as a polygon as well as a point. However, acuity was not used for this project but will be explored in future projects. The join was also used to show the areas participants are served, as their actual locations could not be mapped for sharing. It also does not show the number of participants, and it can be stated that most of the participants were located in the areas with the highest burdens and those that are not only had one participant served in that area.
The most prevalent step in data cleaning was participant locations which were downloaded from the an electronic health record. While common issues were found, such as tying "Ave" or "ave.", or zip codes such as "12345", "12345 6789" and "123456789", other tasks were needed. Another inconsistency was whether or not a space was entered after typing a field, in some cases many spaces were found in a cell. The solution was to do a "find" for all two spaces and replace with one space. This task was repeated (15-20 times) until none were found.
Primary Analysis Tools Used
- • Select by attributes - Export features
• Buffer
- o Point layer - participant locations
o Polygon layer - buffer around areas with highest needs
• Join - points to polygon (participant locations)
Results
The maps presented will demonstrate that most of the participants selected for this project live in or near areas with the highest needs, such as high unemployment, in state. It was noted, as the data was from statewide, sometimes the range selected varied, such as poverty which had a highest percentile of 97 in the city of Oakland.
Map A: Shows the areas that represent participants served and areas with the highest poverty. Poverty from the Disadvantaged Communities Report was defined as the households living below two-times the federal poverty level (5-year estimate, 2011-2015). It was noted that the areas with the highest poverty in Alameda County were mostly in Oakland.

Map B: population
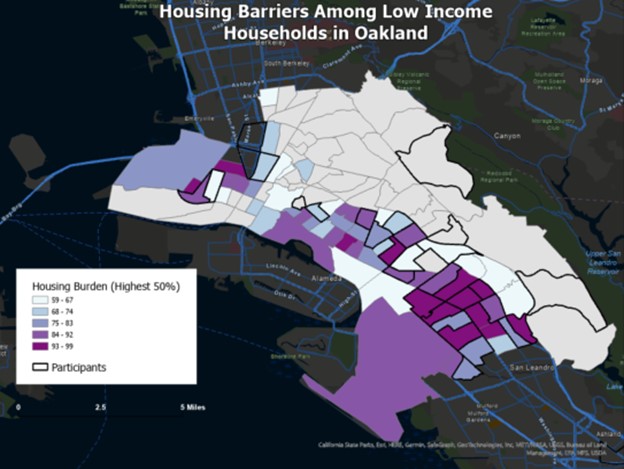
Map B: Shows the areas that represent participants served and areas with the highest housing burdens. Housing burdens from the Disadvantaged Communities Report was defined as households that are both low income and severely burdened by housing costs; where housing costs were more than 50% of total income (5-year estimate, 2011-2015).

Map C: Shows the areas that represent participants served and areas with the highest unemployment. Unemployment from the Disadvantaged Communities Report was defined as the highest percent of unemployment for residents who are over the age of 16 and eligible to work (5-year estimate, 2011-2015).

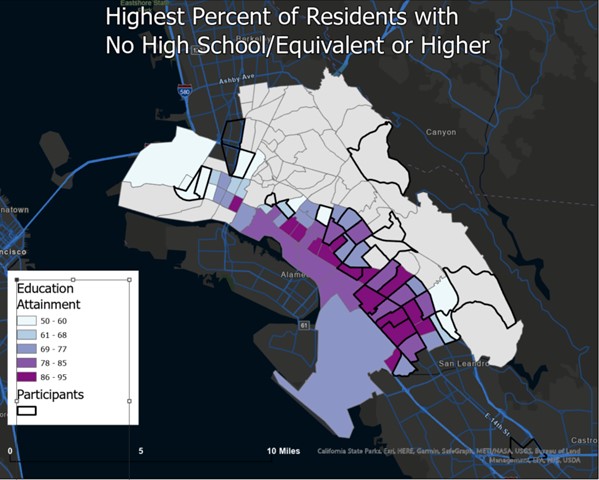
Map D: Shows the areas that represent participants served and areas with low education attainment. Education attainment from the Disadvantaged Communities Report is defined as the highest percent of residents over the age of 25 with less than a high school education (diploma or equivalent).

Maps A & E: The next two maps look at poverty (Map A) and the location of alcohol outs. Buffers around the participants locations were created but not shown due to HIPAA. Buffers allow a "summarize within" to count the number of alcohol outlets within 1,000 of where participants live.

Conclusion
The project was successful in demonstrating that select participants live in areas with the highest burdens relating to education attainment, poverty, housing, and unemployment. Additionally, as studies have shown in behavioral health, the area most burdened has a high number of alcohol outlets. This knowledge alone can help when describing the challenges participants face on a daily base with can impact their mental health and treatment.
The intended findings were found in the project exploration. The maps created showed potential for use in each one identified in the Project Description section. Additional findings found were:
- • Cost for different GIS plans; address credit introduction
• Most of the program participants live in the areas with the highest needs
• Map displays can be used to train new staff
• Change in narrative
• Academic research on GIS and mental health
• Participant participation (qualitative)
During the preparation of the project, map data was shared with a project director who worked with the program for many years. She noted that the maps could be used to train staff, particularly those who are not familiar with life in the areas our participants reside in. When presenting data to the agency Data Advisory Committee, members discussed the potential of academic grants to further pursue use of GIS in mental health. Participant participation was also mentioned, and the project analyst was especially intrigued as a qualitative researcher. Participants’ participation might mostly be with staff, but perhaps select participants as well. Finally, when preparing the data buffers were made around the areas where participants are served. The "summarize within" analysis tool helped identify the count of points within and provided exact data. The project analysis then realized how the narrative can change when describing participants to funders, in grant applications, and in agency reports. For example, before this project it was logically assumed:
- "Most of the participants come from low-income neighborhoods."
Using the summarize within tool, the narrative changes to:
- "Most (84%) of our participants live in or within 1,000 feet of neighborhoods with the highest poverty rates in California."
Going Forward
Our exploration with GIS and mental health will continue for at least one more semester. Focus will include the data presented here and explore additional variables. For example, is it possible to determine access to healthy foods? This may include identifying alcohol outlets that are not supermarkets and may have more alcohol and other unhealthy options. If possible, determine if ratio of alcohol to food is available to classify where the unhealthy retailers are located. Other areas of exploration include predictive analysis and participant participation.
References
1. California Disadvantaged Communities Report 3.0