Title
Landslide Risk in Berkeley, California
Author
Nina Valder
American River College
Geography 350: Data Acquisition in GIS, Fall 2022
Abstract
An ArcGIS Pro project of background information about landslides in Berkeley, California. Attempt to find relevant information that would be needed to ascertain which areas are vulnerable to landslides.
Introduction
Predicting landslides is a complicated process of compiling a great amount of varied data into mathematical models. Often the models over-predict landslides: that is, they predict more landslides than actually occur. Newer proposed models indicate that taking the spatial structure of the hillslope material into account greatly increases the accuracy of the models. It also narrows the number of landslides predicted. This is helpful for residential and business owners: the more accurate the predictions, the fewer number of properties need to be yellow-tagged. When a property is yellow-tagged by a government agency, the owners cannot occupy the property.
Background
In 2004 I worked for Los Angeles County as a residential appraiser. That year, there had been fires during the summer, followed by heavy rain. Many properties were damaged by landslides or were yellow-tagged, indicating that they were in danger of sliding. When a property was yellow-tagged, the owners were not allowed to enter the property. Many owners complained that the government was overly-aggressive in yellow-tagging their properties. When I saw the online map of areas in danger of landslide in California, I was surprised to see that Berkeley, California had so much landslide area that had been built upon. I wanted to do this project to find out more about it.
Datasets and Sources
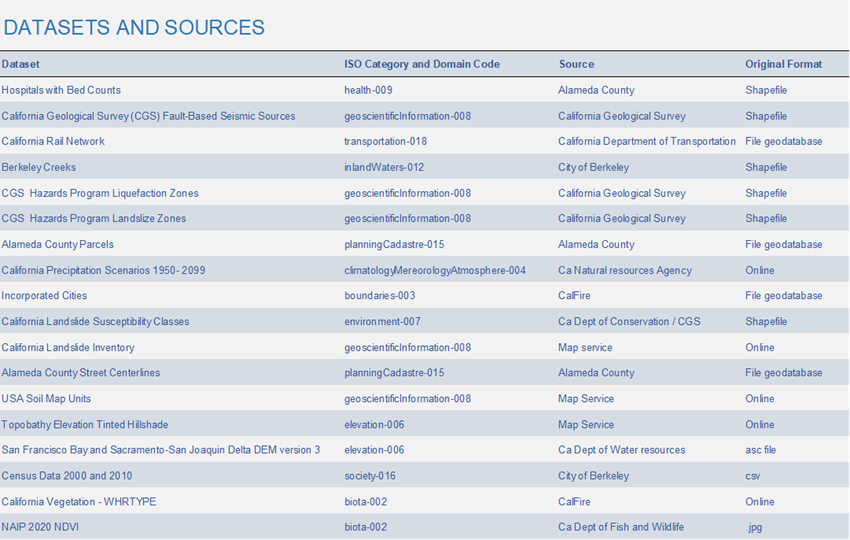
Methods
Below is a breakdown of the procedures and steps I followed to prepare and perform the analysis of the data.
Gathering Data
I tried to gather data at the local level, starting with the City of Berkeley's Open Data Portal. I found no data on landslides. I found data on local creeks, which I knew would be relevant since water saturation in the soil contributes to landslides. However, there was no Metadata with the creek dataset. I also found census data that had been modified for the City of Berkeley, but again, there was no Metadata with it.
Next, I checked with the County of Alameda's Open Data Portal. Again, no landslide data, but all of the data that I pulled on this portal was in a file geodatabase format, and the Metadata was well-documented. From the open data portal I pulled three sets of data: (1) hospitals with bed counts, (2) parcel data in Alameda County and (3) Alameda County Street Centerlines. In part, I pulled these datasets to have more ISO Categories represented in my map. However, I also noticed that the hospital information did not look right. The dataset indicates only one hospital with beds in Berkeley. When I did a simple google map search of hospitals in the Berkely area, several showed up. Due to time constraints, I did not research the discrepancy, but realizing that I will have to make time to analyze even the seemingly simplest data layer is something that I have learned from this project.
Next, I looked at the State of California's Open Data Portal. Even typing in landslides introduced me to a wide-range of datasets. Often, it required my reading and rereading the dataset descriptions to really understand what the data is representing. For example, one dataset was predicting landslides if they Hayward fault experienced ahigh magnitude earthquake at a time where the soil was also at a very high level of saturation due to unusually high precipitation. Although I understand the need for this type of projection, I was looking more for data that could be fed into a landslide modelto predict landslides--not a worst-case scenario projection.
A lot of the datasets also had an emphasis on data contributing to landsides, for example liquefaction and earthquake data. I had to do some online research to find out what liquefaction really is, and how great a contributor earthquakes are to landslides. For me, this is the intriguing parts of GIS as a user: the maps pique my curiosity and understanding them demands further research. It is a wonderful way to learn more about a topic that is outside my daily interaction.
Downloading the maps from the State portal made me realize how little I still really understand about Data Acquisition and GIS. I found file geodatabase formats to be rare…in fact, I could only find one, which was the California Rail Networks. Is this because the file geodatabase format is not generally available, or it is because I donot know how to download it? I am not sure at this point, but I am determined to find out. Another important learning moment in this project.
The other thing that I realize that I don't understand still is the Metadata. Before this class I did not realize that the Metadata was not downloading automatically with every dataset…I thought that the authors of the datasets were just lazy about filling out the Metadata information. Now I realize that the Metadata information has to be saved separately and reinserted into the dataset once they are downloaded. I did save the Metadata information for all of my datasets, but at the time of this writing, still do not know how to add them properly into the dataset. Another thing I learned from this project. Another thing I am determined to master.
Creating the Map
I did not do much map manipulation, since gathering the data took so much time. At first, I clipped the data to the area of Berkeley, but then when I was looking at the earthquake data, it made me realize how intertwined all of these events might be. There are other earthquake faults nearby. If there is an earthquake at one of these faults, it might trigger a landslide in Berkeley. Similarly, landslides outside the city limits of Berkeley might trigger landslides within Berkeley.
I did change some of the symbology so that I could see the data in a better way: the earthquake fault layer and the landslide zones layer were both modified from single value to unique values. The symbology on almost all of the point and polygon layers were changed to make them more visible.
Another thing that I learned is that I have a hard time knowing what to do with raster layers. The DEM layer and the precipitation layer seemed useless to me. Maybe they are not nuanced enough? Maybe they need to be manipulated in a way that I have not thought of. It was mentioned in this class that raster layers are the future: I know that I need to be able to utilize them in a better way, and it is another aspect of GIS on my list of things to learn.
I did change all the names of the layers to indicate the ISO category they belonged to.
Analysis and Conclusion
There is very little analysis with this map. The topic might have been too wide for me. Now that the data is gathered for the map, I think that a good topic for analysis might have been an estimate of miles of major road and rail damage if a severe liquefaction event happened in Berkeley.
But this map project did for me what I think is best for me: it made me do new things in GIS, it helped me see areas in GIS that I really need to learn, it introduced me to a topic, it introduced me to how I might create a project for myself in an area outside of my expertise. It made me realize in a new way how much careful data acquisition there needs to be done in order to have a really informative map.
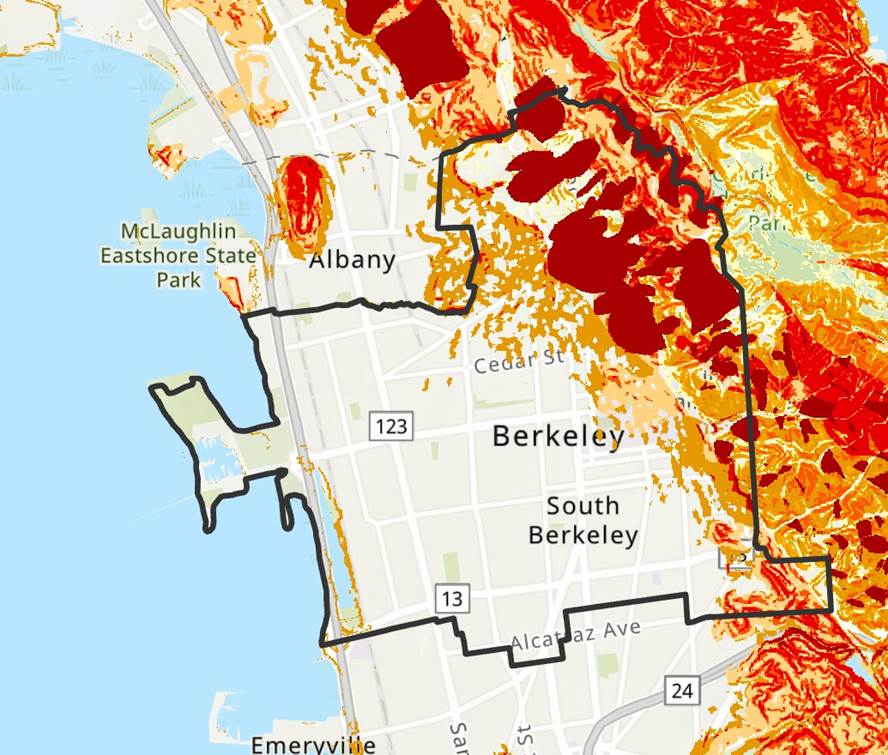
Map: Susceptibility to Deep-Seated Landslides in California. California Geological Survey.