Title
The Decrease in the Walnut Crop of Yolo County-
Crop Years 2009 and 2022
Author
Rebecca Adamson
American River College, Geography 350: Data Acquisition in GIS; Fall 2023
Contact Information: rebeadamson9@gmail.com
Abstract
This project explores the decline of the walnut crop in Yolo County, California. Data for this project includes the County Crop Reports crop years 2009 and 2022 as well as feature layers supplied by the county through their GIS Open Data Geohub. This data shows an increase in the overall crop acreage of walnuts but a decrease in the percentage of walnut acreage based on the total crop acreage for the county.
Introduction
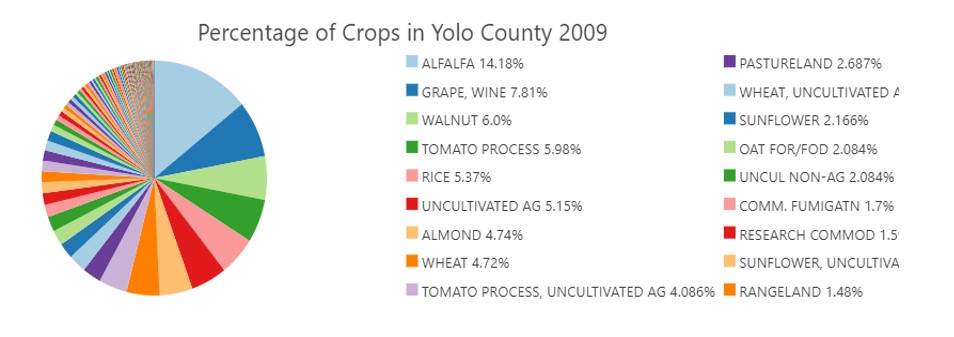
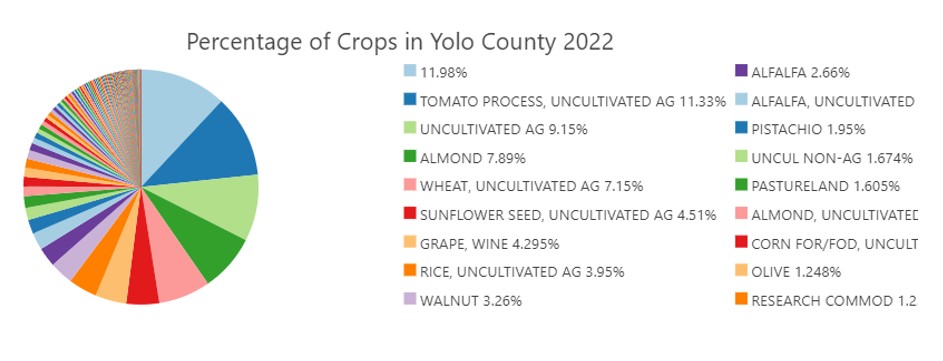
Walnut orchards are being taken out in Yolo County. This county is located in the Sacramento Valley which along with the San Joaquin Valley make up the Great Central Valley of California, one of the most productive agricultural areas in the world. The Central Valley of California produces 99% of the walnut crop grown in the United States. (Walnuts.org) Historically Walnuts have been a preferred crop for Yolo County, in 2009 walnuts were the third most popular crop grown, and walnut crop permits made up 6% of the crop permits granted by the county. (Yolo County, 2023) This percentage dropped to 3.26% by 2022. (Yolo County, 2023) The goal of this project was to collect data on how much walnuts have declined as a preferred crop in the county.
Pie Charts Created With Statistics Summarized in the Attribute Table
Background
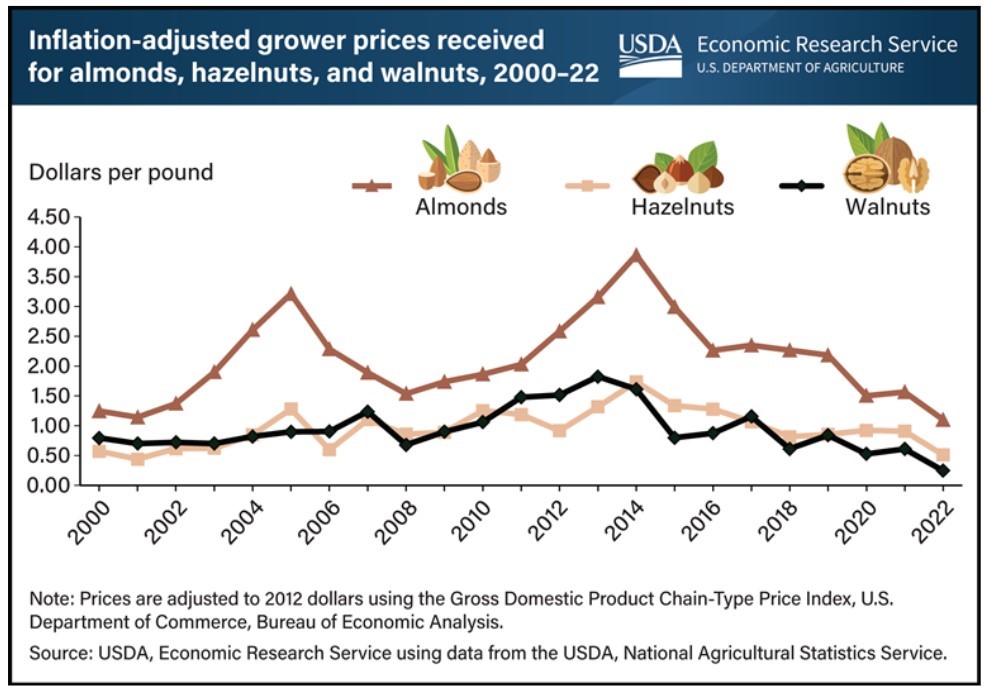
The Great Central Valley of California is a place where communities are built around the crops that are grown there. Walnuts have historically been a crop that promised a profit to farmers. According to the USDA, the price of walnuts has dropped markedly in the last few years. (USDA, 2023) Because of this farmers have chosen to take out their orchards in favor of crops that the current market has better predictions for. Evidence for this change in the decrease in the price of walnuts as a commodity can be found in the yearly crop reports released by Yolo County. These reports have records of the amounts of acres that have been planted with walnuts along with the current market prices for walnuts. (Yolo County, 2023) Reasons for the current low market prices include increased growth of the walnut industry in Chile and China along with the loss of foreign customers of California walnuts as a result of tariffs imposed by Trump. (Walnuts.org, 2023)(Farmprogress, 2023)
Methods
In order to examine the change in walnut crop acreage I utilized the crop data available through the Yolo County Website. Through the Yolo County GIS Open Data portal, I was able to obtain access to feature layers that represent the crop permits granted for each year from 2009 to 20022. These feature layers have polygons that represent the boundaries of each permitted area. The information included in the attribute tables for these feature layers includes the type of crop, the name of the permittee, and the number of acres for the permitted land among other information. The Yolo County website also has available to the public the Annual Crop Reports of the county from each year going back to 1937. The GIS feature layers along with the crop reports were my primary sources for this project. The feature layers were downloaded and then uploaded to ArcGIS Pro. To prepare the data for analysis in ArcGIS Pro, I performed a definition query to isolate the polygons that were of the crop type of walnut, I then created layers that represented the walnut crops from the years 2009 and 2022. These years were chosen because they were the first and last years available as GIS Data from the county. I created pie charts based on the number of walnut permits divided by the total number of crop permits to find the percentage of walnut crops for each of the two years studied. I created maps using these layers along with the layers representing the full set of crop polygons for the county to display the growth of total crop acreage and the change in walnut acreage. I summarized the statistics for the layers using the field for the number of acres to determine just how the acreage has changed between these two years. I used the data from the crop reports to find the prices for walnuts for each of these years to find evidence for the decrease in walnut acreage as part of the total crop acreage for the county of Yolo.
Results
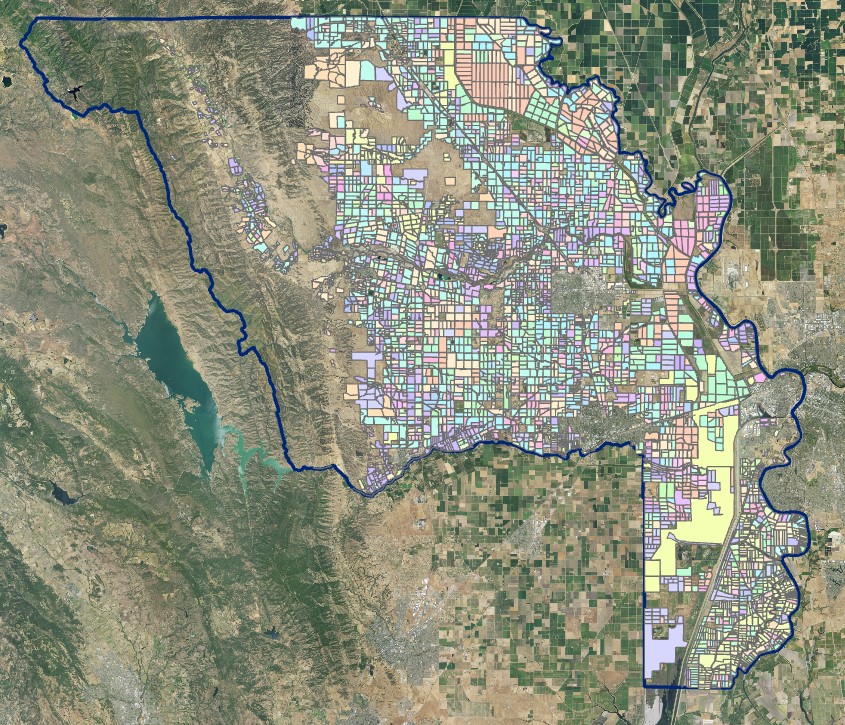
The results showed that even though the total acreage of cropland and the number of acres for the walnut crop in Yolo County have increased from the year 2009 to 2022, walnuts have become a smaller percentage of the total cropland. This is evidence of the decline of walnuts as a preferred crop for farmers. According to the Yolo County Crop Reports from the years 2009 and 2022, the reason for this decline can be found in the current market prices for walnuts. In 2009 one ton of walnuts was sold for $1,484.00 while in 2022 one ton of walnuts was sold for $652.00. (Yolo County, 2023) Based upon the dramatic decline in walnut prices it can be seen why walnuts have lost their preferred status among farmers.
This table shows that walnut crop acreage has become a smaller percentage of the total acreage of the county's cropland.
| Crop Year |
Walnut Acres |
Total Crop Acres |
Percent of Total |
| 2009 |
9,348 |
227,460 |
= 4.1% |
| 2022 |
28,081 |
1,097,953 |
= 2.5% |
Maps
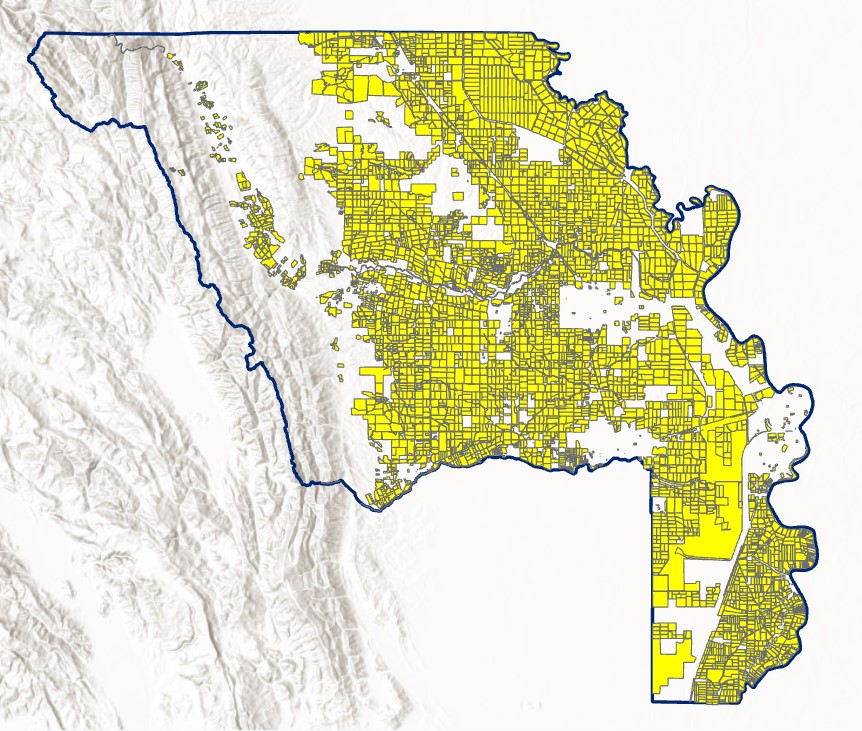
Total Crop Acreage in Yolo County, 2009
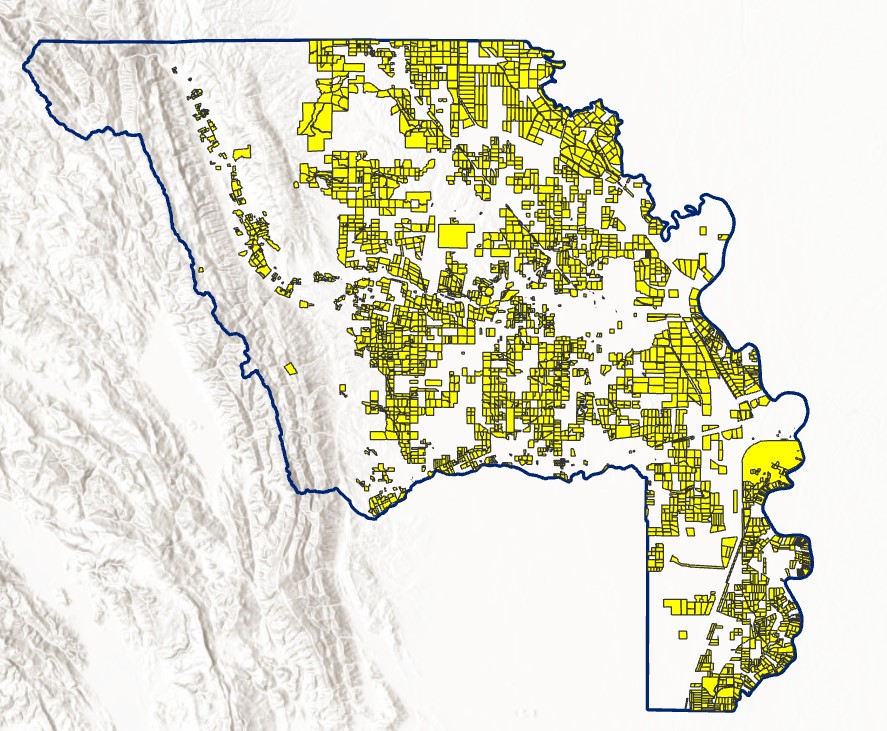 Total Crop Acreage in Yolo County, 2022
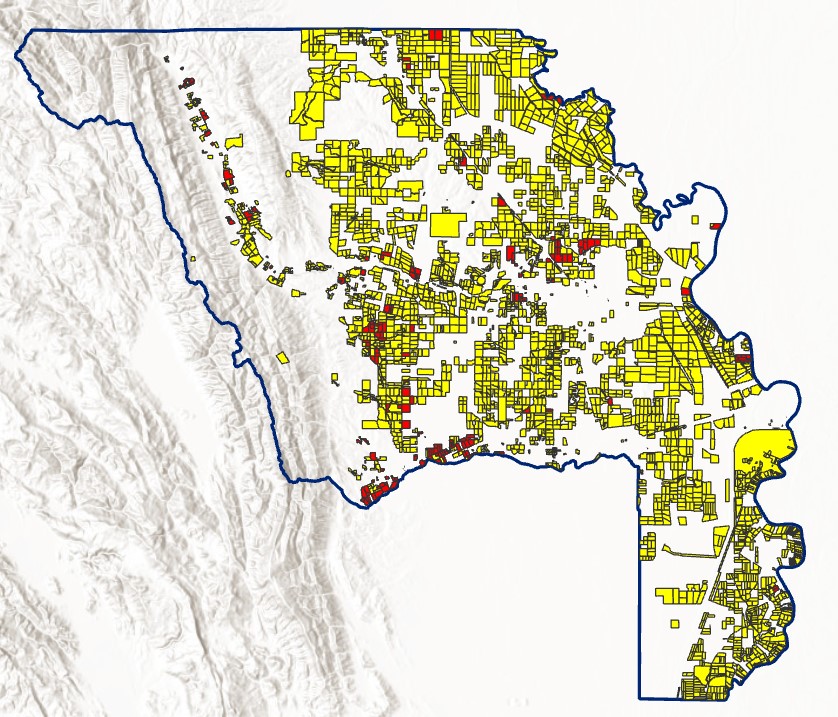
 Walnut Crop Acreage (Shown in Red), 2009
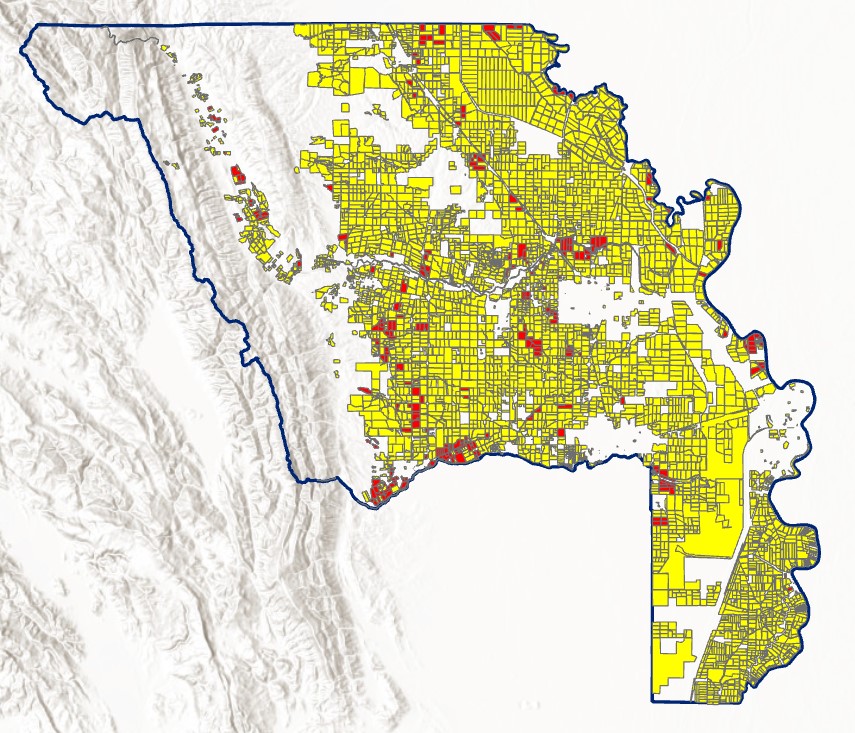
 Walnut Crop Acreage (Shown in Red), 2022
Total Crops Shown With Unique Values, 2009
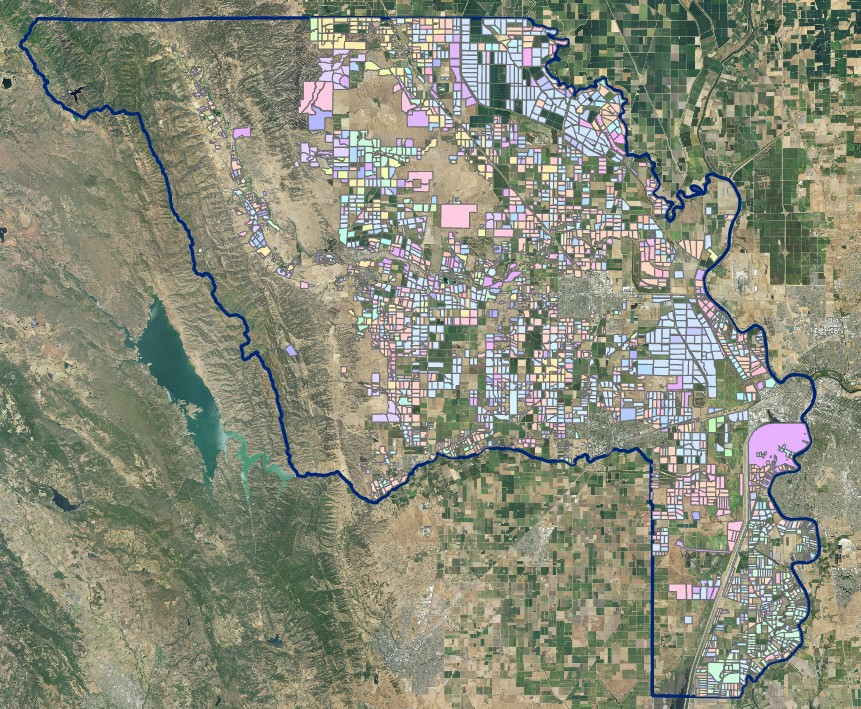 Total Crops Shown With Unique Values, 2022
Analysis
According to the data, between 2009 and 2022 the number of acres that were permitted for walnut orchards in Yolo County, California decreased as part of the overall percentage of crops that were granted permits by the county. In 2009 there were 9,348 acres of walnuts which made up 4.1% of the total cropland in the county (227,460 acres). By 2022 the acreage had increased to 28,081 acres for walnuts but with the increase of total cropland to 1,097,953 acres, the percentage of acres used for walnuts had decreased to 2.5% of the total cropland. This decrease in walnut acreage as part of the total acreage in the county could be seen to be directly related to the decrease in the market value of walnuts as a commodity. In 2009 one ton of walnuts was sold for $1,484.00 while in 2022 one ton of walnuts was sold for $652.00. It can be assumed that if the market price for walnuts continues to decline, then the number of permits granted by the county for growing walnuts and the number of acres dedicated to the walnut crop will decrease.
Conclusions
Between 2009 and 2022, walnut acreage declined in Yolo County, California. The reasons for this decline are complex, and the results of politics and trade on a global scale. It is beyond the scope of this data and my skillset to determine all the causes of the decline or to possibly offer a solution to return the acreage to what it once was. I can only hope that the farmers are resilient and able to make it through any hardships that a changing market might bring them. .
References
About Walnuts - California Walnuts. (2023, April 28). California Walnuts. https://walnuts.org/about-walnuts/
Almond, hazelnut, and walnut prices fall to lowest levels in decades. (n.d.). https://www.ers.usda.gov/data-products/chart-gallery/gallery/chart-detail/?chartId=107823#:~:text=Acreage%20in%20California%2C%20the%20country's,prices%20have%20decreased%20since%202014.
Fitchette, T. (2023, August 2). U.S. walnuts face stiff competition from Chile, China. https://www.farmprogress.com/tree-nuts/u-s-walnuts-face-stiff-competition-from-chile-china
India will eliminate twenty percent retaliatory tariff on walnuts - California Walnuts. (2023, June 24). California Walnuts. https://walnuts.org/walnut-industry/india-will-eliminate-twenty-percent-retaliatory-tariff-on-walnuts/
Maria. (2023, July 25). The crash of the walnut market. Dirt and Sky Farm. https://dirtandskyfarm.com/2023/07/25/the-crash-of-the-walnut-market/
Yolo County Open Data GeoHub. (n.d.). https://yodata-yolo.opendata.arcgis.com/search?groupIds=8880e638e44f4fab8b2aaca6633f2ced


