Taking
a deep dive into the Unique Bathymetry of California’s Coast
Author
Theodore
Gryn
American
River College | Geography 350 | Fall 2023
Abstract
The purpose
of this project was to explore the different types of bathymetric data sets and
products that are available to the public from the government and private institutions
that physically collect this type of data.
Introduction
The
beauty of the Pacific Coast and its otherworldly underwater landscape has long
been a source of fascination and wonder. The unique seafloor topography,
combined with the upwelling of nutrient rich water, supports a diverse
ecosystem of kelp forests, and the many different species of sea life that call
the rocky coves, and sandy beaches, home. The study of the ocean floor provides
us with a unique opportunity to peer into a world that is otherwise unseen by
human eyes, and it is though this sort of exploration that we can gain insight
into the geologic processes that form the physical world around us, and the
rich ecosystems that support many communities around the planet.
Background
According
to NOAA, bathymetry can be defined as the study of the "beds" or
"floors" of water bodies, including the ocean, rivers, streams, and
lakes. This is often facilitated by the collection of data using specialized
equipment that utilizes Sonar, Lidar, and other remote sensing technologies.
These efforts conducted by government agencies and privately funded research
institutions have provided us with a wealth of information regarding what lies
below the ocean’s surface, yet only 10 percent of the Planet’s seafloors are
mapped today. Much of the data that has been collected over the decades is
publicly available through online resources such as NOAA’s National Centers for
Environmental Information Bathymetric Data Viewer.
Methods
The bathymetry
data sets were acquired from NOAA’s National Centers for Environmental Information
Bathymetric Data Viewer and consist of two Multibeam Bathymetry Mosaic’s and one
Coastal Lidar dataset. The datasets were selected for three unique locations
along California’s coast.
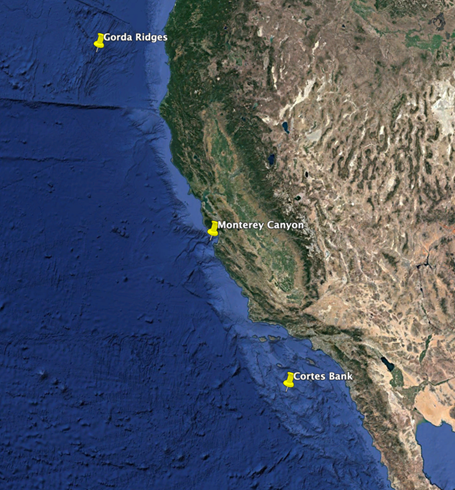
Figure 1. Project Locations
Results
The
first data set is a Multibeam Bathymetry Mosaic for an area that is adjacent to
the California/Oregon border. The Gorda Ridges are an oceanic spreading center
which is the result of the unique plate dynamics that are occurring at this
location. The are experiences frequent seismic unrest
and has several areas of submarine volcanic activity.
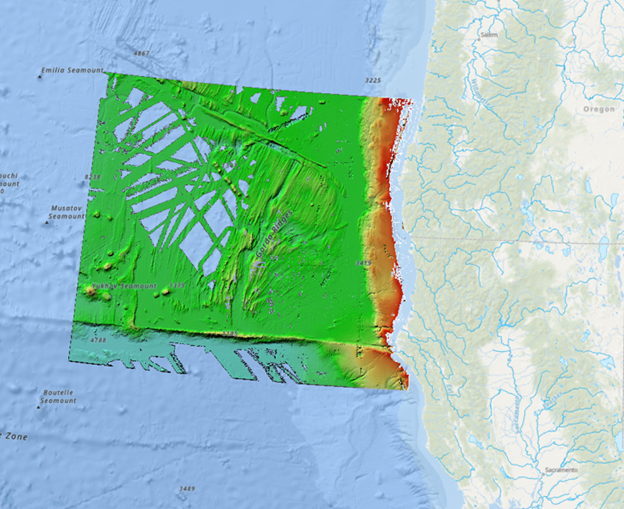
Figure 2. Gorda Ridges and surrounding area
Several
submarine canyons were evident to the east of the ridges. A few of the
submarine canyons were obviously related to rivers of today, such as the Eel
River and Eel Submarine Canyon. Yet, several submarine canyons were missing a
modern associated river, a reminder that rivers are meandering bodies.
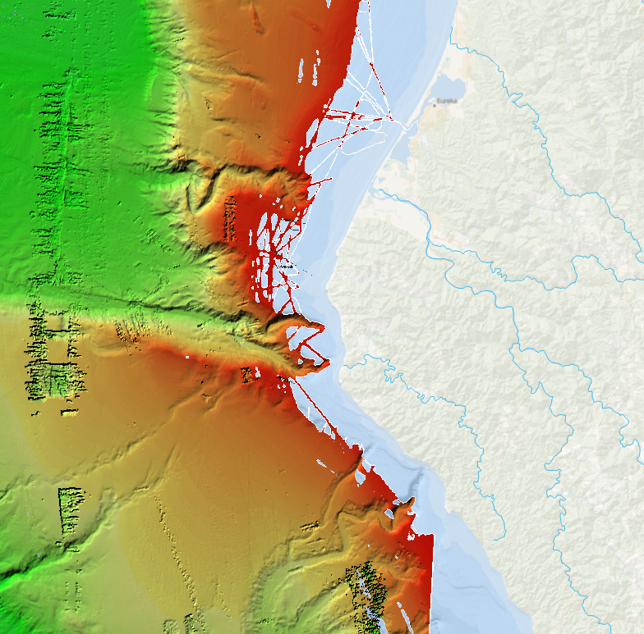
Figure 3. Submarine canyons south of Eureka, CA
Another
feature that stood out from the data were a number of
seamounts, rising from the sea floor and scattered throughout the area.
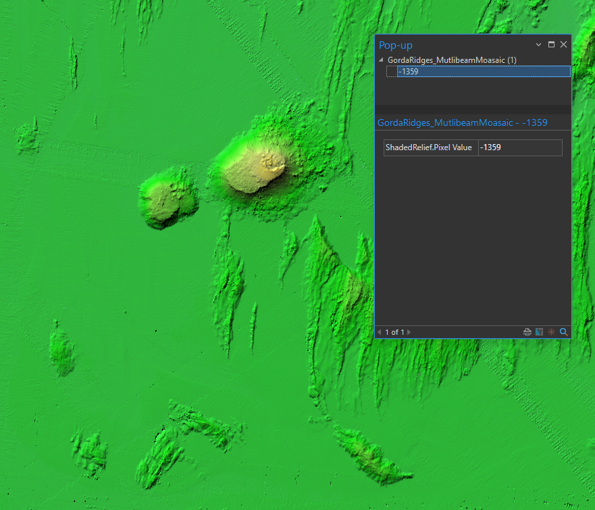
Figure 4. Seamount and depth in meters
The next
location was the Monterey Canyon located on the outskirts of Monterey Bay. The submarine
canyon is the largest on the West Coast, its main channel is over 292 miles
long and it is 12 miles wide at its widest point. The exact origin of the canyon
is still debated but several theories have been offered. The canyon, combined
with currents of the Pacific Ocean are the main drivers in the upwelling of
nutrient rich seawater that supports the diverse ecosystem that is present in
Monterey Bay. The data set is a Coastal Lidar Mosaic and represents only a
small portion of the canyon due to limitations with Lidar technology and the waters
depths.
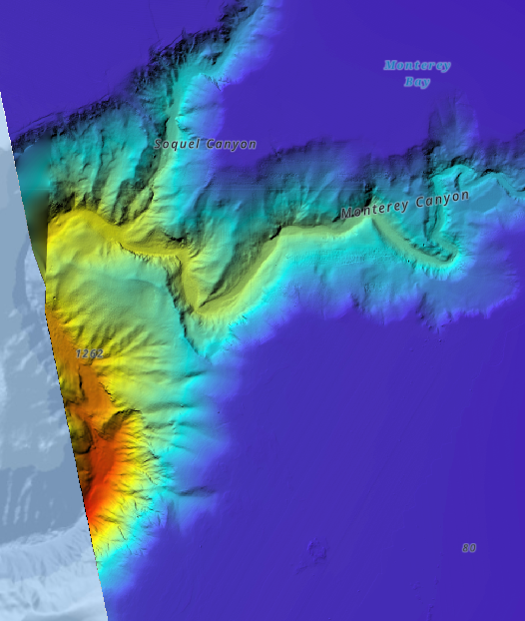
Figure 5. Monterey Canyon Coastal Lidar
The final
location was Cortes Bank, a shallow seamount located approximately 110 miles
from San Diego, CA in an area that is notoriously dangerous for maritime
navigation due to numerous shallow shoals and the occurrence of rogue waves. The
site is also home of the “Ghost Wave” which is a large open water breaking wave
that can
approach 80 to 100 feet in height and is surfed by a select few elite big wave
surfers.
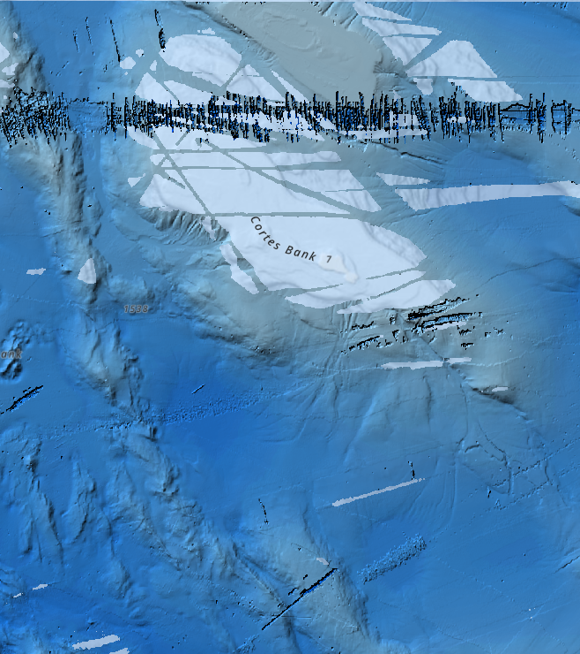
Figure 6. Cortes Bank Multibeam Bathymetry Mosaic
Analysis
Overall,
the data sets were extremely easy to work with and interpret. The mosaic data
sets can be easily downloaded from the Bathymetric Data Viewer and opened with
ArcGIS Pro. I made slight adjustments to the shaded relief and selected appropriate
color schemes to display the data sets in a way that the unique terrain features
of the seafloor are easily distinguishable.
Conclusion
In
conclusion, the bathymetric data sets that are available for free to the public
are insightful and fun to look at. They represent a form of exploration that
can be undertaken from the safety and comfort of your home because a bunch of fairly adventurous and intelligent scientists have dedicated
the time and effort to head out to sea and collect this type of data. But much
of the work remains to be done. Today, only 10 percent of the world’s seafloors
have been mapped, as humanity continues to advance technologically, the opportunity
to finally uncover what awaits below may finally become a reality.
Resources
Meldahl,
Keith. Southern California’s Biggest Waves— The Story of Cortes Bank.
“Cortes
Bank: The Phantom Wave of the Pacific Ocean.” Surfer Today, 7 May 2022,
https://www.surfertoday.com/surfing/the-mechanics-and-history-of-cortes-bank.
NOAA.
“What Is Bathymetry .” NOAA,
https://oceanservice.noaa.gov/facts/bathymetry.html.
UK
Hydrographic Office. “A Guide to Bathymetry .” UK
Hydrographic Office, 2020.
California
Gorda Ridge Photo Album.
https://plate-tectonic.narod.ru/californiamargingordaridgephotoalbum.html.
Clague,
David, et al. “MBARI’s 2000 Expedition to the Gorda Ridge.” Ridge Events,
Oct. 2001
“Monterey
Canyon: A Grand Canyon beneath the Waves.” Monterey Bay Aquarium Research Institute , 18 Aug. 2020,
https://www.youtube.com/watch?v=xDbKaQOrgPo.