Title
Mapping Homelessness in Sacramento
Author
Alex Roselle, MSW
American River College, GEOG 350: Data Acquisition in GIS, Fall 2023
Abstract
To demonstrate the utility of GIS applications to the complex challenge of urban homelessness in the United States, the prevalence and geographic distribution of unsheltered homeless populations in the City of Sacramento during the years 2016-2023 was analyzed using public data from official sources. Specific data points representing unsheltered homeless encampments were obtained from public records of calls to the City of Sacramento’s 3-1-1 service request hotline and website, which were geo-located, mapped, and compared to other community features. Limitations of available data were identified, and their implications for this project and future research efforts were discussed.
Introduction
This project attempted to investigate geospatial patterns in unsheltered homelessness in and around Sacramento, California during the years 2016–2023, using public and open-source data. This project also sought to include time-based data if possible, comparing recent years to one another. Sources of data will include: calls to the City of Sacramento's 3-1-1 hotline reporting homeless encampments, annual "Point-in-Time Count" homeless census results, law enforcement reporting data (if available), and (if available) eviction records from recent years. Data themes will mostly involve Governmental Unit Boundaries such as census units, city and county boundaries, public parks and open space boundaries, etc.; and may also include Transportation features such as highways and the street network due to the frequency of homeless encampments around transportation corridors such as roads, sidewalks, highway over/underpasses, etc. If possible, Cadastral information dealing with zoning categories and vacant property parcels may also be involved, as these too are a common site for unhoused people to set up camps.
The significance of homelessness as a worsening problem in Sacramento and most other California cities is by now a well-known and seemingly-intractable challenge for not only unhoused people themselves, but policymakers and all other community members as well. Street homelessness in particular has become a major political flashpoint leading to increased media attention, public controversy, and a wide range of official responses (Karlamangla,S., 2023). In recent years in California, these have included increased efforts to place unhoused people in transitional housing such as hotels during the first 1-2 years of the COVID-19 pandemic ("Project Roomkey"), to approaches focused more on policing and criminalization of homelessness, including the ballot proposition passed in Sacramento in 2022 to make it much easier for police and city officials to forcibly clear homeless encampments. The purpose of this project's analysis will be to map the distribution of street homelessness in Sacramento (to the extent that available data can be obtained), as well as to reveal any possible year-over-year changes in the quantity or distribution of street homelessness during the period of 2016-2023.
Background
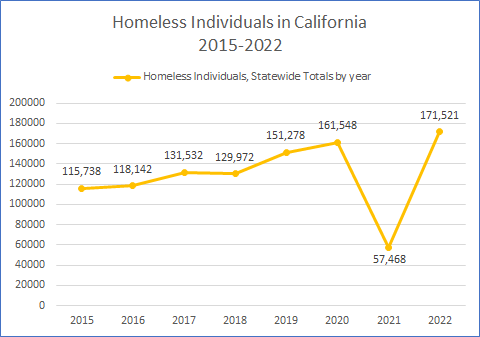
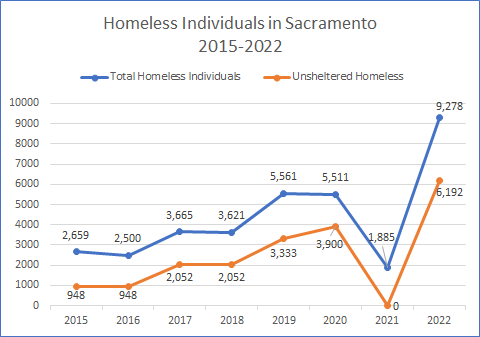
Homelessness in the United States is an urgent social, economic, and policy problem with many causes and complicating factors, and has reached crisis proportions in the past few decades (cite). The number of people experiencing housing insecurity and homelessness in California has also greatly increased in the past 10-20 years [Fig. B-1], driven largely by California’s worsening housing crisis. The Sacramento area in particular has seen a significant increase in total homeless individuals, particularly in the past 5 years [Fig. B-2].
Figure B-1: Graph of statewide "Point-In-Time Count" totals for all California Continuums of Care, 2015-2022, showing pre- and post-pandemic year-over-year increases. Source: HUD Dataset
Figure B-2: Graph of "Point-In-Time Count" totals of homeless individuals for Sacramento City & County Continuum of Care, 2015-2022, showing pre- and post-pandemic year-over-year increases. Source: HUD Dataset
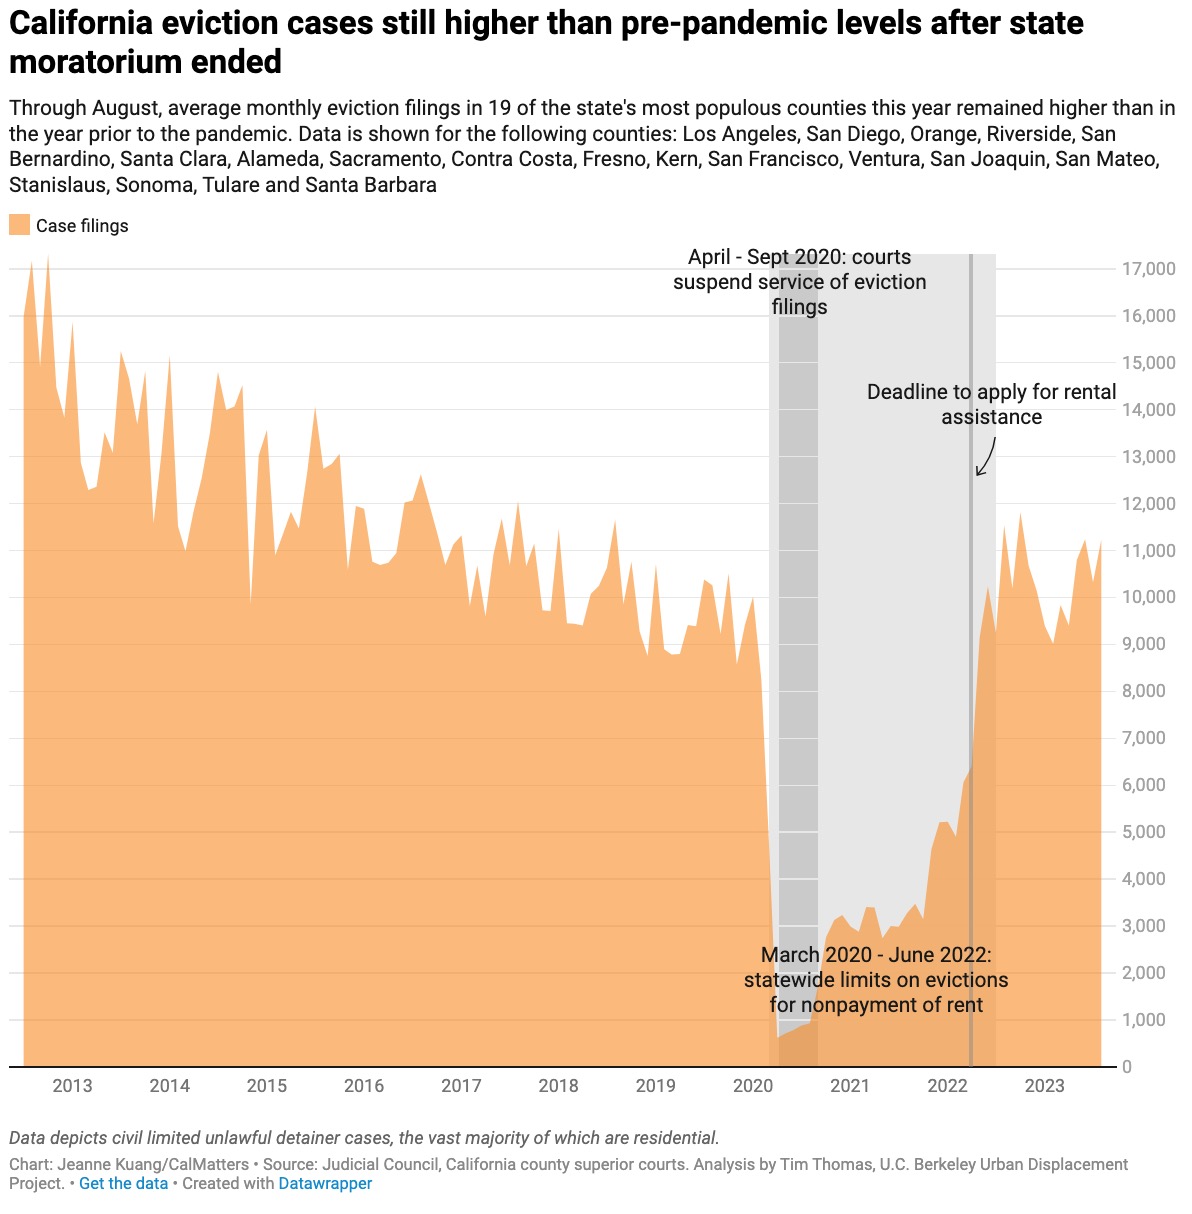
In response to the longstanding and worsening crisis of homelessness, policymakers, service providers, researchers, as well as unhoused people themselves and their advocates, have each promoted a variety of interventions to prevent and resolve homelessness (cite!). However, these have been largely insufficient at meeting the scale of this crisis, despite some encouraging results with specific populations such as homeless veterans (Sacramento Steps Forward, 2022). The drop in total homeless numbers observed between 2020 and 2022 can be attributed to various additional efforts to provide emergency and transitional housing resources during the COVID-19 pandemic, such as Project Roomkey, a program funded by the State of California during the first two years of the pandemic. The decline in overall homelessness during these years can also be attributed to the statewide moratorium on evictions for non-payment of rent, along with several programs to provide financial assistance to renters during the first two years of the pandemic. Unfortunately, in the year since these emergency programs and the eviction moratorium have ended, statewide eviction cases have sharply risen to become even higher than pre-pandemic levels (Kuang, 2023) [Fig. B-3]
[Figure B-3: graph showing monthly totals of California civil court filings for “unlawful detainer”, the legal term for eviction proceedings.]
Homelessness is not only a severe crisis in human terms and in its social, economic, and policy dimensions, it is also in many ways a geospatial problem (Semborski et al., 2022). Understanding the prevalence and spatial distribution of unhoused people in the community is vital to assessing the scale of need, analyzing patterns in the movement of unhoused people, directing outreach and survey efforts, evaluating the availability and quality of assistance programs as well as health care and other support services, and many other purposes. While the use of mapping as a method has a long history in the social sciences and in social welfare, human services, and social advocacy communities for over a century (Hillier, 2007), the use of GIS in relation to the problem of homelessness is relatively new compared to other fields which have more experience using GIS technologies.
In the United States, official data related to homelessness is standardized within a framework developed by the US Department of Housing and Urban Development (HUD), which administers federal funding related to services for those experiencing homelessness, as well as most federally-subsidized housing programs offered to people experiencing housing instability or homelessness. All homeless service providers (public and private) which operate within HUD’s frameworks are grouped into an administrative unit known as a Continuum of Care (CoC), which covers an area ranging from a single large city, to a metro area and county, to multiple counties sharing a single CoC in rural parts of a state. These CoC’s collaborate with HUD to publish detailed statistics tracking homelessness developed from two major sources: the Homeless Management Information System (HMIS) and the Point-In-Time (PIT) Count. HMIS is a HUD-regulated networked database which is used to track service information as well as demographic and individual information for those receiving services related to homelessness. The PIT Count is an annual “homeless census” conducted by all CoC’s nationwide over a single 24-hour period every January or February, with the rationale being that this is generally the coldest and least hospitable time of year to be sleeping outdoors, and that therefore all individuals who for whatever reason are unable or unwilling to find indoor shelter may be counted and offered additional outreach services. While the PIT Count is treated as a comprehensive “census” and its results are treated as authoritative, in practice the limitations of participating agencies and volunteers make it impossible to literally count every homeless person in a community, requiring participants to rely on sampling strategies and “known locations” where homeless encampments are likely to be found (Sacrament Steps Forward, 2022). The PIT event also counts individuals in emergency shelters and transitional housing, which in combination with the count of unsheltered individuals allows CoC’s and HUD to develop a holistic, if narrowly-focused, snapshot of the unhoused population in every community in the US.
Methods
A problem which became clear early in the course of this project was the scarcity of relevant data which were both freely accessible and geospatial in nature. HMIS data are not made available to the public. PIT Count data, while being quite detailed in demographic and statistical aspects, do not include any geospatial data at a level smaller than the CoC itself, at least not in their publicly-available forms. While previous researchers have applied a variety of creative strategies to map unhoused populations (Semborski et al., 2022), from directly accessing de-identified versions of HMIS data, to in-person surveys, and even using drone aircraft equipped with thermal cameras and GPS receivers, none of these were feasible within the scope of this project.
One data source which proved useful came via the City of Sacramento’s public GIS data portal. There, the City had published detailed datasets of all contacts requesting city services via the City’s 3-1-1 hotline and website. 3-1-1 hotlines are a popular and now-common service offered by major municipalities in the US, and were created with the goal of efficiently aiding citizens in seeking city services. Many of the service requests to 3-1-1 dealt directly with unsheltered “street” homelessness or homeless encampments in public or on private property, and appear to have been the result from motivated citizens calling 3-1-1 to request City services to in some way address the instance of homelessness which they observed. The implications of this being the source of 3-1-1 data will be explored further in the Analysis section.
The two datasets published on the City of Sacramento’s website comprised a period from approximately May of 2016 to April 15th of 2020, and another “current” period from April 15th, 2020 through the first week of December, 2023 at the time the dataset was downloaded. Each contained a unique record for every contact to 3-1-1, containing time, date, category information tagged by the hotline worker related to the purpose of the contact, and detailed geographic coordinates, as well as neighborhood and City Council district information. While the City of Sacramento 3-1-1 hotline only responded to calls made within Sacramento’s city limits, some calls were logged with locations in unincorporated areas of Sacramento County. The County of Sacramento operates its own 3-1-1 hotline and has published similar datasets to those from the City proper; however, these datasets were not included in this project due to time and scope limitations.
To generate maps using the City’s 3-1-1 datasets, first the datasets were filtered based on the category tags assigned to each contact. Those including the phrase “homeless camp” were selected; all other category tags were filtered out. These filtered datasets were each downloaded as a Shapefile and added to a previously-developed ArcGIS File Geodatabase containing the City and County of Sacramento as well as relevant features such as the street grid and transportation networks, political boundaries such as city limits, city council districts, neighborhoods, and US Census blocks, zoning information, and other framework elements. Next, the 311 contacts were mapped as point data, with each contact being assigned a unique point. The two datasets (2016-2020 and 2020-2023) were symbolized with different colors. To examine spatial relationships between the distribution of homeless-related 311 calls and the Sacramento community, the point data from calls were spatially-joined with each of Sacramento’s eight City Council districts, using the district numbers included in the 311 call records as the key.
Results
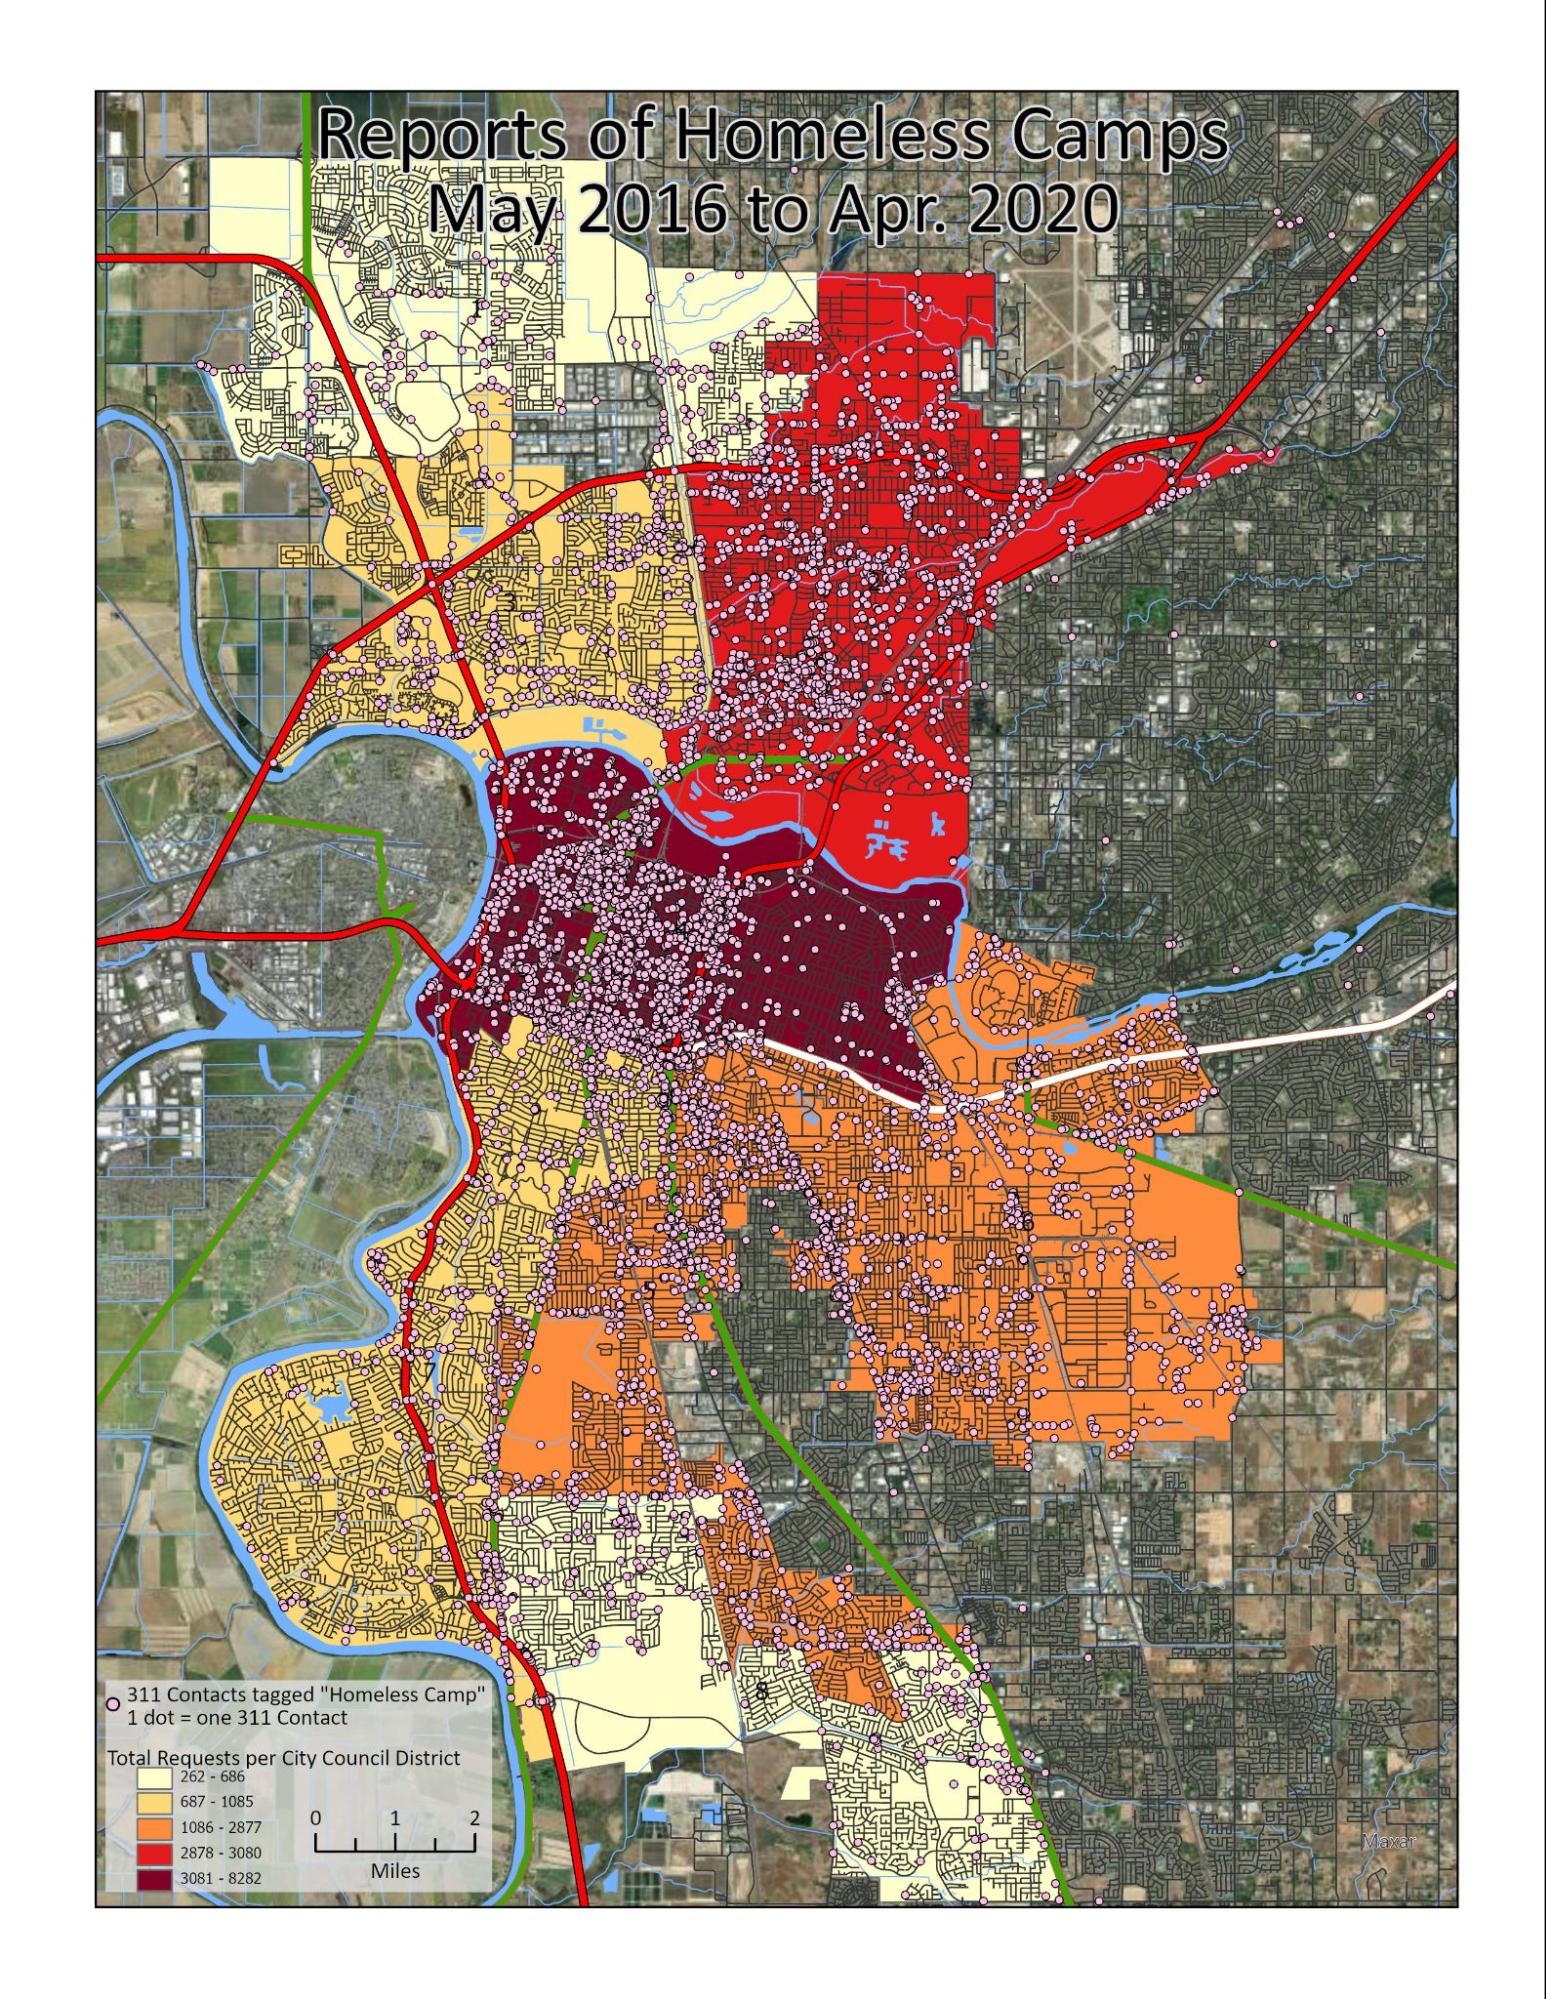
[Figure R-1, showing the geographic distribution of contacts to the City of Sacramento’s 311 service center recorded with the tag “Homeless Camp” during the period from May 2016 to April 2020. Each contact is assigned its own point. The density of such contacts per Sacramento City Council district is displayed on a choropleth scale, normalized by quintiles.]
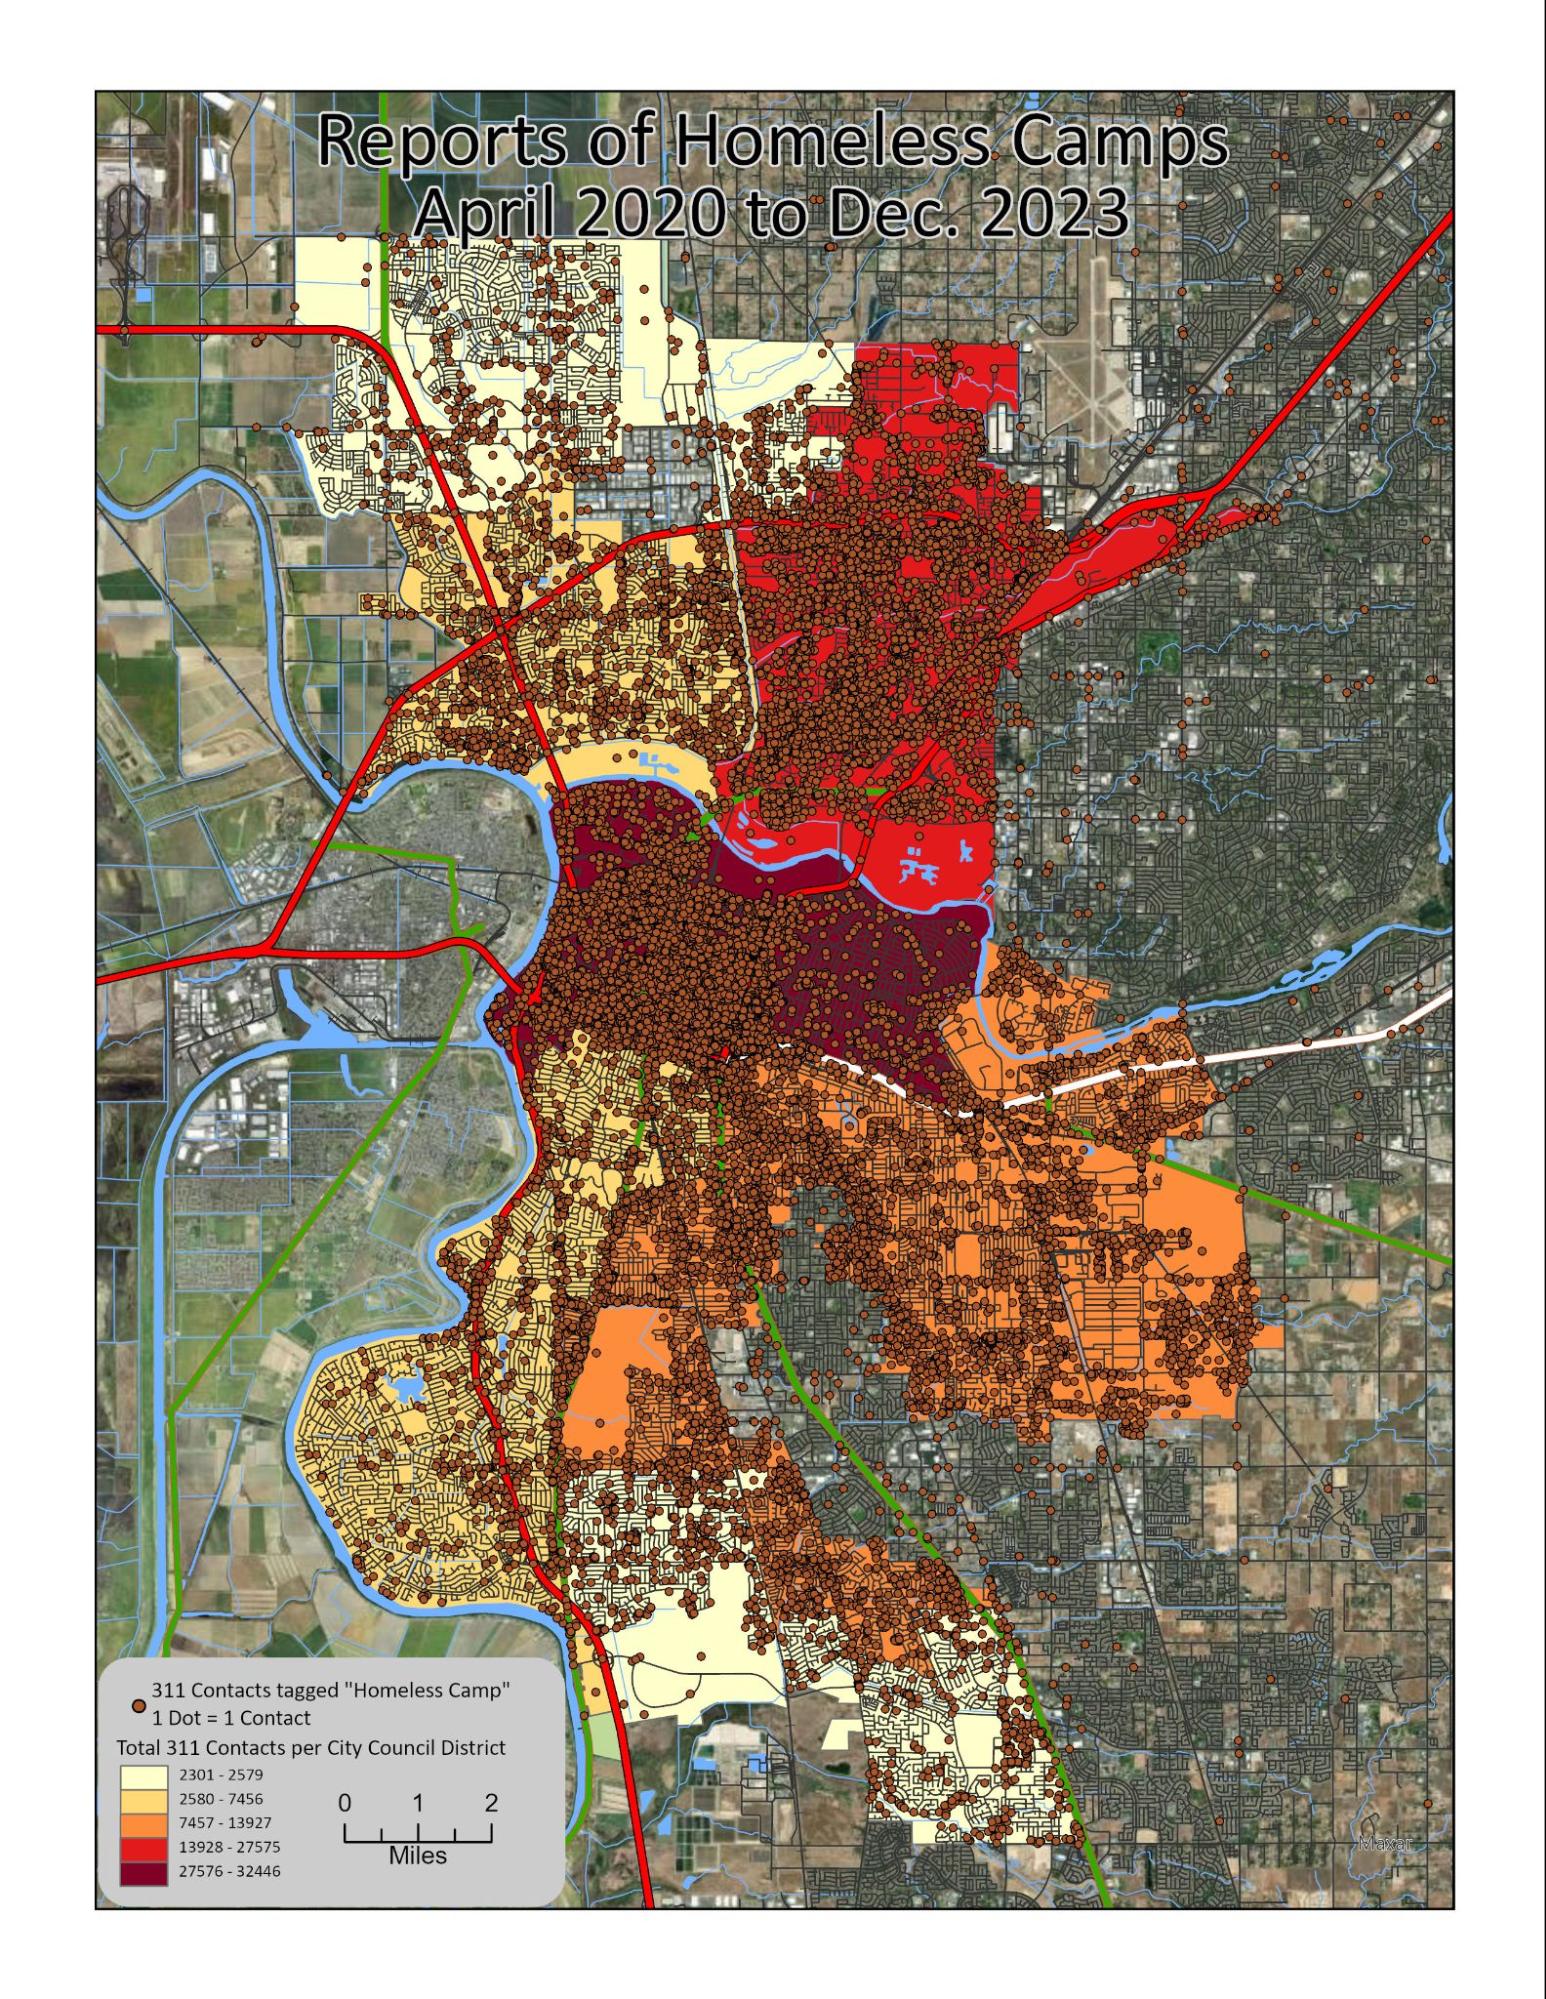
[Figure R-2, showing the geographic distribution of contacts to the City of Sacramento’s 311 service center recorded with the tag “Homeless Camp” during the period from April 2020 to early December of 2023. Each contact is assigned its own point.The density of such contacts per Sacramento City Council district is displayed on a choropleth scale, normalized by quintiles.]
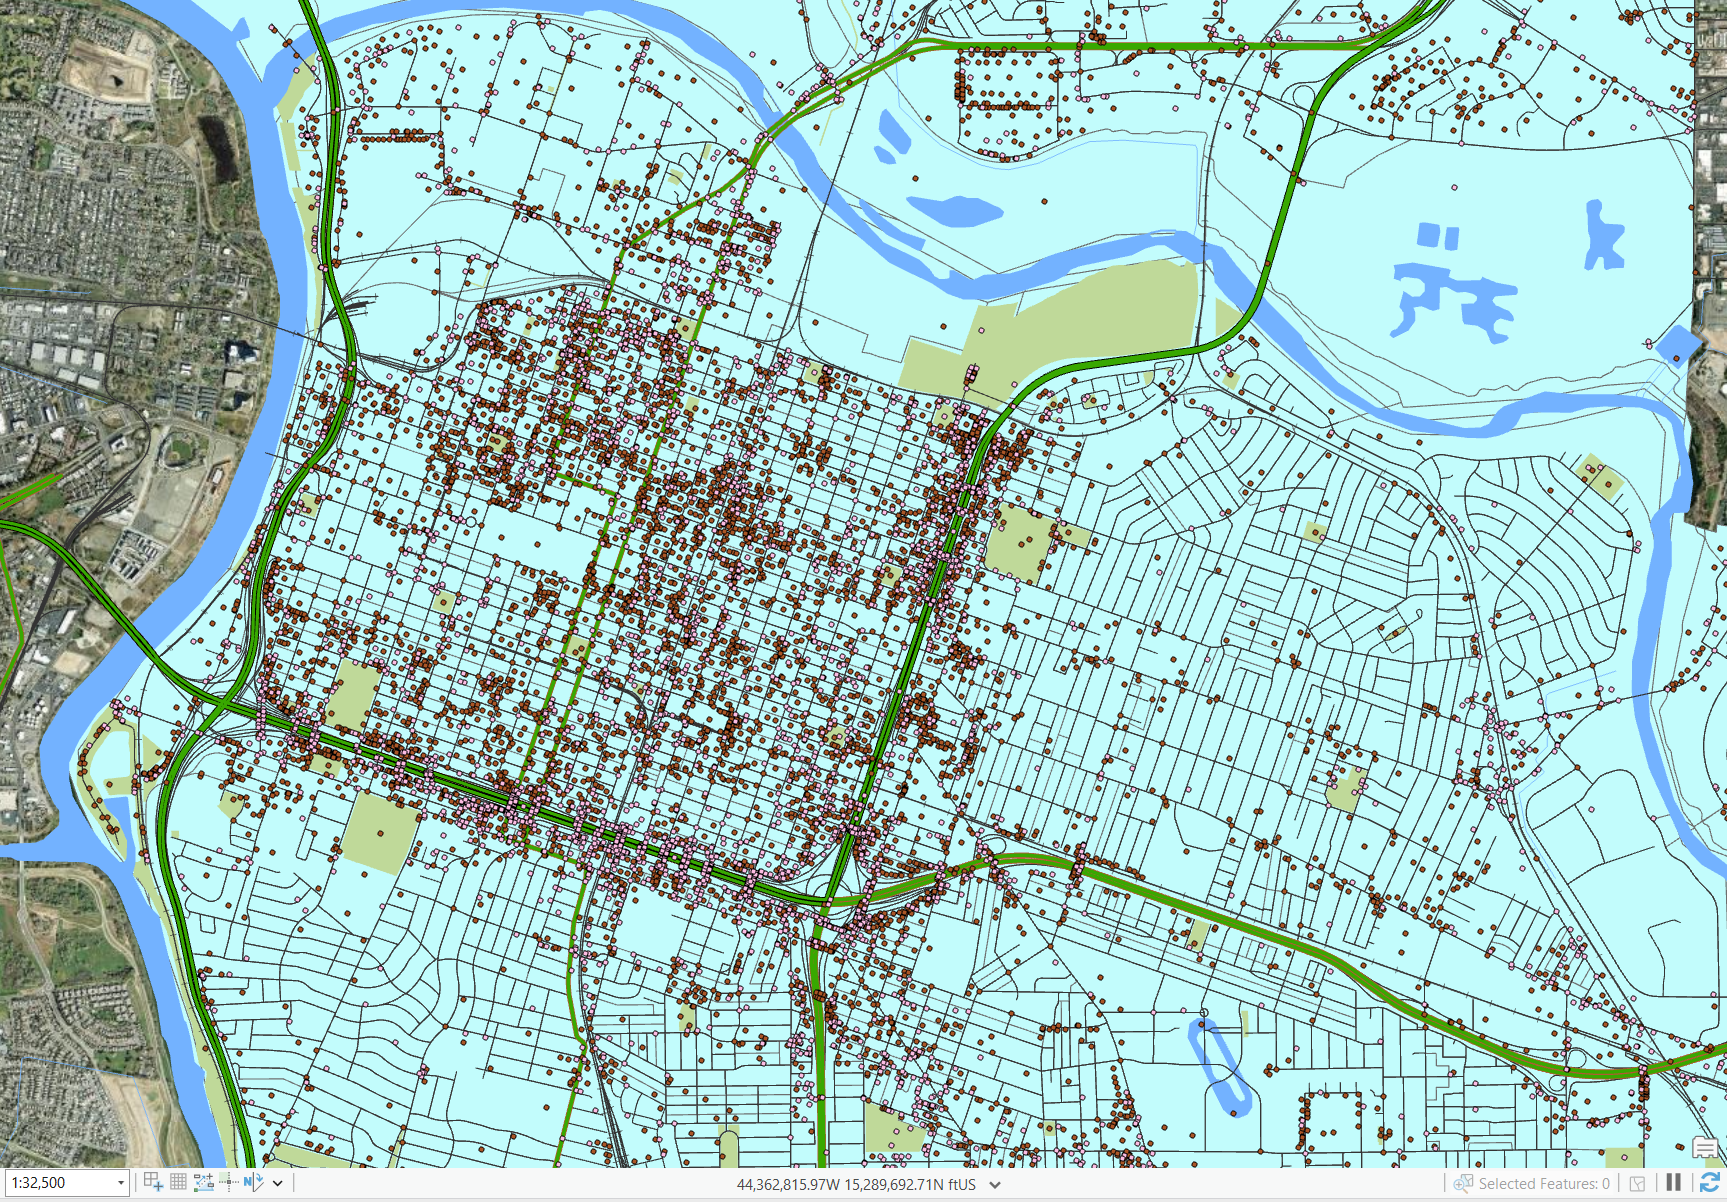
At a closer scale focused on the downtown and midtown Sacramento “grid”, the density of 311 calls related to homeless encampments becomes strikingly apparent [Fig R-3]. Evidence of clustering along freeway rights-of-way and over/underpasses as well as major surface streets can be easily observed.
[Figure R-3, showing a smaller-scale close-up of the downtown and midtown core “grid” areas of Sacramento, with 311 contacts mentioning “homeless camp” from both the 2016-2020 and the 2020-2023 datasets. Each 311 contact is assigned its own point.]
Displaying the 3-1-1 contact points over a Zoning map [Figure R-4] reveals further apparent correlations between most reports to 3-1-1 of homeless encampments and zoning which is industrial, commercial, or residential mixed-use, as compared with lower-density residential areas.
[Figure R-4, showing 311 contact points overlaid on the City of Sacramento’s official Zoning maps, with a legend for different categories of residential, commercial, industrial, and other zoned properties].
Analysis
Reviewing the results from mapping homeless-related 3-1-1 contacts reveals several spatial associations between reported homeless encampments and other features in the Sacramento urban landscape. As noted in the previous section, the widely-known trend of unhoused individuals camping under bridges and highway overpasses is illustrated by the 3-1-1 contact data. Other transportation corridors such as arterial surface streets, freeway frontage roads, and railroad rights-of-way, also have their outlines made visible from the 3-1-1 data. Additional clustering may be observed around areas known to be partially vacant or underdeveloped, such as the River District northwest of Sacramento’s downtown near the confluence of the Sacramento and American Rivers, along with industrial areas north of the American River.
The choropleth maps displaying the total numbers of 3-1-1 contacts by Sacramento City Council district show that the most affected Council district is District 4, composed mostly of Downtown, Midtown, and East Sacramento neighborhoods; however this association is somewhat skewed. While Downtown, freeway corridors, and to some extent Midtown areas contain the greatest number of 3-1-1 contacts related to homeless encampments, East Sacramento has relatively few except along transportation corridors and near parks or open space. The next most-affected Council district is District 2, consisting of the North Sacramento, Del Paso Heights, and other northeastern neighborhoods, in which a more even distribution of 3-1-1 contacts may be seen. These areas contain many open areas such as canals, open space trails, and less-developed areas such as railroad rights-of-way and long transportation corridors which have become associated with numerous homeless encampments in recent years, such as Traction Avenue and Roseville Road.
The apparent association between greater numbers of reported homeless encampments with areas officially zoned for commercial, industrial, and higher-density residential uses noted in Figure R-4 may be a result of many factors. While some of this apparent correlation may be coincidental due to these areas being more common in the downtown area and other central neighborhoods, it may also be related to aspects of these properties which may make them attractive to unsheltered individuals seeking a safe place to camp while homeless. That is, large commercial and industrial properties may offer some degree of seclusion and some lower degree of traffic outside of business hours, while also being perceived as less likely to attract suspicion compared to residential properties.
This in turn leads to an important caveat related to the use 3-1-1 contact data for mapping homelessness in the community, which has not yet been discussed: the issue of selection bias in the data. Because 3-1-1 contacts are initiated by Sacramento citizens and business or property owners acting in an unofficial capacity, their motivations for doing so may be affecting their likelihood of contacting the City to request an official response. It may very well be true that business owners, property owners, and residents of higher-income neighborhoods may be more likely to call the City due to a desire to have homeless encampments removed or for the unsheltered individuals they report to be “moved along”, to use a phrase commonly encountered in discussions of how authorities interact with unhoused people. At the same time, it is possible that some callers to 3-1-1 may be calling due to more altruistic motives, and are requesting city services for the purpose of directing outreach or other support services to unhoused individuals they see in their community. This cannot be determined from available data, however.
Lastly, there are two other complicating factors related to using 3-1-1 contact data to map the prevalence of homelessness in Sacramento. The first of these is that there may be an oversampling bias in the data; in other words, that the same unhoused individuals and homeless encampments may be subject to multiple reports by different callers, or by the same caller multiple times per instance. This cannot be properly evaluated with the available datasets, as they do not contain any identifying information related to either the person requesting City services, nor of the homeless person(s) who are themselves the subject of their requests. Finally, the 3-1-1 service request datasets comprise only those services which were initiated by citizens and do not include reports of or interventions directed at homeless encampments which were initiated by law enforcement or other public agencies. This last fact may in fact mean that a great deal of geospatial data related to homelessness in Sacramento is not included in this project, as law enforcement have been traditionally responsible for policing homelessness and forcing unhoused individuals to relocate (Sacramento Steps Forward, 2022). For instance, much of the American River Parkway, while well-known to Sacramento residents as a location where numerous unhoused individuals have set up encampments, show few if any encampments in the 3-1-1 contact data; instead, it is more likely that any reports of homeless encampments or interventions toward them are initiated by law enforcement or other public officials independently of any reports from the citizenry or property owners, as these are by definition on public lands. While such additional information would have been useful to include, data sources of this type could not be located within the time and scope available for this project.
Conclusion
This project illustrates the complexities involved in attempting to map homelessness. As the population of unhoused individuals, by definition, do not have fixed addresses, their locations change often. While people experiencing homelessness are in great need and deserve every available public resource that can be offered, there are also many reasons to approach this subject with caution. Because people experiencing homelessness are a highly-stigmatized and vulnerable population, care must be taken to respect their privacy and safety. Due to these concerns, any datasets which touch on the subject of unhoused people and the prevalence of homelessness in the community will need to avoid sharing individually-identifying information, especially if these data are made available to the public through open data portals such as those accessed for this project. While keeping the issues of privacy, safety, and trust in mind, the potential benefits of applying GIS methods to mapping and analyzing homelessness in the community suggest a strong need for continued research efforts which can provide greater protections for the people involved. This is an area where the social sciences and those with experience in homeless outreach and advocacy have a great deal to contribute due to their familiarity with centering the needs and experiences of human subjects and some of the complexities unique to homeless populations. This research project and its associated maps and figures may be used to develop further inquiries into homelessness in the Sacramento area, as well as future efforts aimed at increasing the public’s understanding of this critical issue and guiding official responses in more humane and effective directions.
References
Anti-Eviction Mapping Project (2018). “California Evictions Are Fast and Frequent”. http://www.tenantstogether.org/sites/tenantstogether.org/files/CA_Evictions_are_Fast_and_Frequent.pdf
Chan, D. V., Helfrich, C. A., Hursh, N. C., Rogers, E. S., & Gopal, S. (2014) Measuring community integration using Geographic Information Systems (GIS) and participatory mapping for people who were once homeless. Health and Place 27, 92-101. https://doi.org/10.1016/j.healthplace.2013.12.011
Hillier, A. E. (2007). Why social work needs mapping. Journal of Social Work Education 43(2), 205-221.
Karlamangla, S. (2023, September 20). Rising frustration over the homelessness crisis in Sacramento. The New York Times. https://www.nytimes.com/2023/09/20/us/sacramento-homelessness-crisis.html
Kuang, J. (2023, November 20). Across California, eviction cases have returned to — or surpassed — pre-pandemic levels. Cal Matters. https://calmatters.org/housing/homelessness/2023/11/california-evictions-post-pandemic/#:~:text=California%20eviction%20filings%20have%20been,year%20prior%20to%20the%20pandemic
Sacramento, City of (2021). Sacramento 311 Calls View (2016 - April 15 2020) [Dataset]. Sacramento Publisher. https://data-saccity.opendata.arcgis.com/datasets/cda22aab87834026b267b762ee34507f_0/about
Sacramento, City of (2020-2023). Sacramento 311 Calls View (Current) [Dataset]. Publisher name withheld. https://data.cityofsacramento.org/datasets/5b9a9448663f41b1898643b6d91201c4_0/about
Sacramento Steps Forward (2022, June 26). Homelessness in Sacramento County: results from the 2022 point-in-time count. https://sacramentostepsforward.org/wp-content/uploads/2022/06/PIT-Report-2022.pdf
Semborksi, S., Winn, J. G., Rhoades, H., Petry, L., & Harwood, B. F. (2022). The application of GIS in homelessness and service delivery: A qualitative systematic review. Health and Place 75, 102776 https://doi.org/10.1016/j.healthplace.2022.102776