TITLE
Quantifying Efficacy of Submersed Aquatic Vegetation
Management in the Sacramento-San Joaquin Delta
AUTHOR
Micheal Finnell
American River College, Geography 350:
Data Acquisition in GIS; Fall 2016
Contact Information (michealfinnell@gmail.com)
ABSTRACT
Hydroacoustics has
been the go-to technology to monitor the abundance of submersed aquatic
vegetation in lakes, rivers, and tidal-influenced waters. With advancements in
online services that process this type of complex data, more time can be spent
creating products that provide metrics to guide decision-making. In 2016, we
used echosounders to perform hydroacoustic
surveys at 17 herbicide treatment sites for aquatic weeds in the Sacramento-San
Joaquin Delta. The sites were surveyed for pre- and post- treatment. The data
was processed by an online GIS algorithm, downloaded, and an ArcGIS model was
applied to the data to produce vegetation and change detection maps. We found
that 88 percent of the treatments showed decreases in aquatic vegetation and
over all sites had reduced the weeds by 7.65 percent. An accuracy assessment
revealed that high vegetation areas in our map products coincided with
geotagged photographs of areas dense with submersed aquatic vegetation, thus
giving reasonable validation to the survey data. While we are still in the
processes of finishing the last few sites for the year, this data will be used
to make objective decisions regarding next season’s treatment plan and
potentially compare with other remote-sensed data for the Delta area.
INTRODUCTION
The purpose of this study was to use consumer-grade hydroacoustics to map submersed aquatic vegetation (SAV) and quantify percent change in biovolume during a herbicide treatment program in the Sacramento-San Joaquin River Delta (hereby referred to as the Delta). The “raw” sonar files were processed using an online GIS algorithm, and the derived data was downloaded and imported to an ArcGIS model. The model generated pre- and post-herbicide map products and quantified the temporal/treatment change in SAV biovolume. An accuracy assessment was conducted using geo-tagged photographs to reference areas of high SAV biovolume and compare with sonar-derived maps. The metrics produced by this study will be used to guide future SAV management decisions in the Delta.
BACKGROUND
Submersed aquatic vegetation (SAV) is a term used to describe vascular plants that grow completely underwater except for the flowering parts in some aquatic angiosperms. The Delta is host to many species of SAV, both native and invasive (pers. obs.). The most dominant SAV in the Delta is Egeria densa, the Brazilian waterweed. E. densa is an invasive macrophyte from Brazil that has been established in the Delta for approximately 30 years (CDBW 2001). This fast growing weed clogs waterways and can create problems for boat navigation. Studies have also shown that this weed is actually changing the structure of the Delta ecosystem by reducing both water flow and turbidity and creating habitat that supports other invasive species (Santos et al. 2011).
Since 2001, the Department of Parks and Recreation Division of Boating and Waterways (DBW) has been designated the state lead agency in controlling invasive aquatic plants in the Delta (Harbors & Navigation Code 64 & 64.5). Currently, DBW is using a combination of hydroacoustic mapping, field surveys, and an herbicide treatment plan to monitor and control E. densa and other invasive species such as curlyleaf pondweed (Potamogeton crispus), coontail (Ceratophyllum demersum), and watermilfoil (Myriophyllum spicatum).
The sonar equipment used by DBW is consumer echo sounders and the data processed by a cloud-based algorithm called Biobase (www.cibiobase.com). Biobase produces data on depth, SAV presence/absence, SAV height, bottom hardness, and biovolume (Winfield et al. 2015). The Lowrance / Biobase combination has a distinct advantage over other sonar systems for mapping aquatic vegetation with lower hardware and analysis costs as well as quicker processing times (Radomski and Holbrook 2015). In addition, Biobase outputs are adjusted to Mean Lower Low Tide for consistency across all measurements; an important feature when mapping tidal-influenced systems like the Delta. The service provided by Biobase offers vegetation point data, kriged vegetation grids, default maps and tabular data that can be viewed online or downloaded to the subscription holder. However, the default biovolume maps are portable network graphic images which are not GIS-friendly and can only be assessed qualitatively. By acquiring the processed data directly, I will be able to use ArcGIS to create SAV map products, quantify change in percent biovolume at treatment sites, and provide a metric of treatment efficacy for the 2016 season.
METHODS
Study Sites and Survey Procedures
Hydroacoustic surveys were conducted in the legal Delta area (California Central Valley; UTM 627133.242E, 4216458.982N). Twenty six sites (2424.5 surface acres) were selected for treatment and mapping based on confirmation of visual surveys for high densities of E. densa and other invasive SAV (Figure 1). As per the herbicide treatment schedule, all sites were scheduled for pre-treatment and post-treatment hydroacoustic surveys. Surveys were completed by various DBW Aquatic Invasive Species Unit (AIS) staff using unit research vessels. The Delta is comprised and connected by sloughs, riverine areas, and large shallow waterbodies such as Frank’s Tract. Large areas were gridded to approximately 30 meter intervals for survey transects. In smaller slough and marina areas, transects followed the contours of the shoreline and internal structure (ie. boat docks, tule islands) and ranged between 10 and 30 meters in width. Transects were performed in water depths ranging from 1 to 7 meters as SAV are shallow-water plants not typically found deeper than 7 meters.
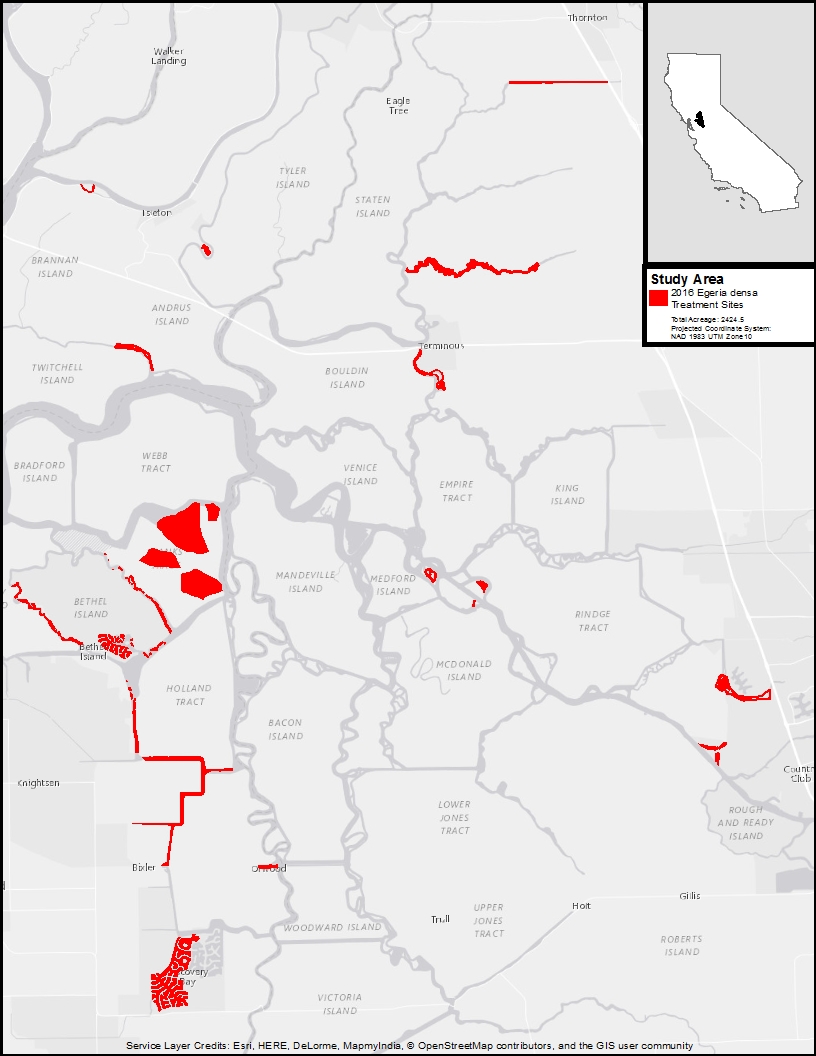
Figure 1. Proposed 2016 Egeria treament and mapping
sites
Data Collection and Biobase Processing
Acoustic and GPS data were obtained using Lowrance™ HighDefinition System (HDS®) consumer echosounders (www.lowrance.com) connected to 200-Khz 200 tranducers mounted on the boat sterns. Settings for the echosounders followed those recommended by Biobase (2013). The Lowrance unit’s internal global positioning system (GPS) was differentially corrected using a wide-area augmented system (WAAS). The unit was set to collect 15 acoustic pings s-1 and GPS coordinates collected every 1 ms-1. The acoustic and GPS signals were logged to a secure digital (SD) card in sl2 and slg format.
Upon completion of a survey, the sonar data was uploaded to Biobase. The Biobase algorithm computed a plant height and water depth for every ping, averaged the 15 pings, and assigned the mean value to the appropriate GPS coordinate. These computed values are a proportion termed biovolume (plant height/water depth). The Biobase algorithm interpolated these points to a raster grid by a process called kriging. The original vegetation point data and the raster grids were downloaded from Biobase as text files in csv format.
Egeria Tool and Map Products
The Egeria tool was created using ModelBuilder in ArcGIS 10.4.1 (ESRI 2011). The Egeria tool simultaneously uses pre- and post-treatment raster grid text files as inputs. The tool projected the points into the NAD 1983 UTM Zone 10 Projected Coordinate System, preserved the outline shape of the point grid within the site boundary as a polygon, and used the Spline with Barrier tool to create pre- and post-treatment raster grids. A raster calculator was used to normalize the data for values above 1 and below zero. It is surmised that the tidal adjustment to the outputs variably produced slightly inaccurate values at some points due to the distance of the nearest tide monitoring station. A subsequent raster calculator subtracts the post-treatment raster values from the pre-treatment raster values and a change raster is produced. Biovolume values that were present in one raster but not the other due to surveying discrepancies were assigned NoData in the change raster. The mean values from each of these raster products were multiplied by 100 to produce mean percent biovolume for treatment rasters and mean percent change for the change raster. Map products were created from these Egeria tool outputs. In addition, a one-sided t-test was conducted on the resulting data for overall percent mean change with 95% confidence intervals.
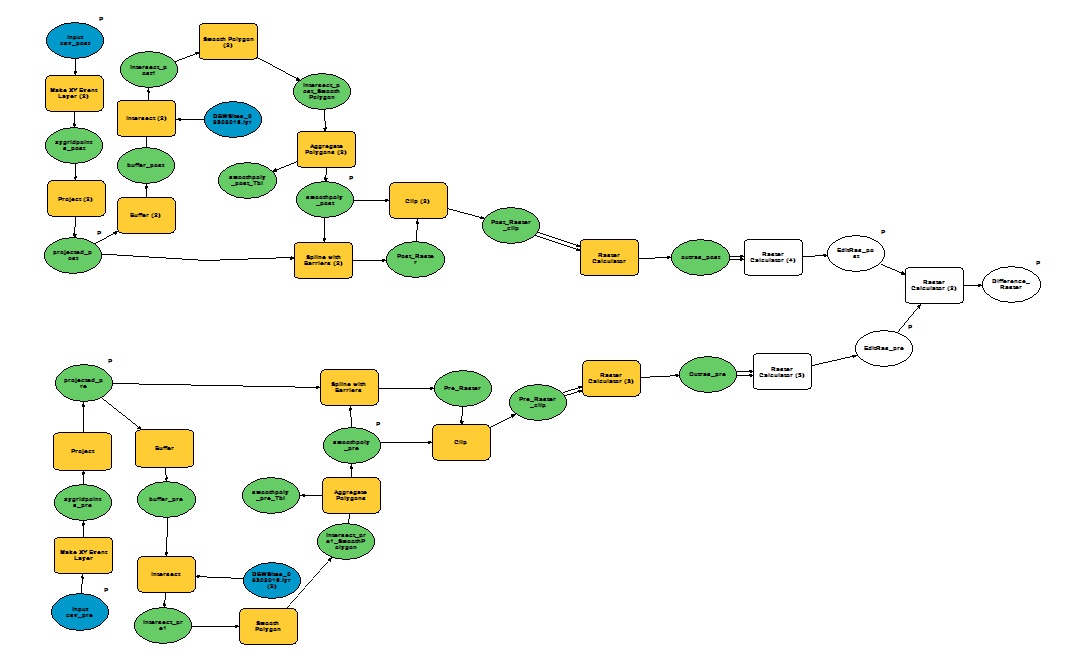
Figure 2. The Egeria tool constructed
in ArcGIS ModelBuilder 10.4.1. The tool
processes text files downloaded from Biobase
and computes mean change between pre- and
post-treatment hydroacoustic surveys.
Accuracy Assessment
Due to time constraints, a simple accuracy assessment was instituted using a Panasonic Lumix TS4 12.1MP Waterproof Digital Camera. Twenty-two geo-tagged photographs were taken of SAV visible at the water surface (> 80% biovolume) during the post-treatment hydroacoustic mapping effort at Franks Tract. The Python script tool, Geo-tagged Photos to Points, was used to create a shapefile of the points and was overlaid on the final Franks Tract map for a qualitative assessment of our biovolume data.
Results
Seventeen of the twenty-six E. densa
treatment sites were mapped for pre- and post-treatment. A preliminary total of
approximately 1053 surface acres were analyzed with the Egeria tool (Figure 2).
Four sites are still scheduled for post-treatment hydroacoustic
surveys and two sites were dropped from the treatment schedule. Franks
Tract (Sites 173, 174, 175) had no pre-treatment survey but was mapped for
post-treatment. Owl Harbor (Site 20) had the greatest mean reduction in biovolume of 29.25 percent, while Brannan Island (Site 22)
had the greatest mean increase in biovolume of 38.43
percent (Figure 3) Piper Slough (Site 107) was treated and mapped during two
different periods: Phase I and Phase II. Piper Slough Phase I had a mean
increase in biovolume of 18.86 percent. Piper Slough
Phase II had a mean decrease in biovolume of 17.33
percent. Estimated mean changes for each of the 17 sites are shown in Figure 4.
The overall mean for the 17 sites was -7.65 + 8.44 percent biovolume reduction (t-test, t =
-1.9209, df = 16, p =
0.07275). The qualitative accuracy assessment results are shown in Figure 5.
The geotagged photograph points correspond with areas of high biovolume (>80 percent) on the Franks Tract
post-treatment map.

Figure 3. Output from Egeria tool for sites 20 and 22, Owl Harbor and Brannan
Island. Note that Brannan had a mean increase in biovolume
possibly due to proximity to main
river channel with high
tidal influence. Similar trend observed with increased biovolume
near the mouth of the main river channel for Owl Harbor.
Figure 4. Graph depicting
the mean percent change in biovolume between pre- and
post-treatment.
Conclusion
The overall mean biovolume change between pre- and post-treatment mapping for all 17 sites analyzed in this study seemed exceptionally low, as noted by many of our staff. However, this quantitative metric sets a baseline for future comparisons and will provide data we can use to guide next seasons treatments. Four sites still remain to be analyzed which could potentially change this statistic. Examining these results from a different perspective, 15 of 17 sites (approximately 88 percent) showed improvement and by removing the two outliers, Brannan Island and Piper Slough Phase I, the overall mean decreases to approximately -12 percent. The Brannan Island site was an exception to the rule with almost a 40% increase in biovolume. Given proximity to the main river channel, tidal influence is strong and most likely diluted the herbicide rendering the treatment ineffective. Like Brannon, the Owl Harbor post-treatment map showed an increase of biovolume at the mouth of the slough near the main channel, however the site extends well beyond the main channel and hydrologic flow probably decreases with distance from inlet and the herbicide was effective in reducing the biovolume at this site. Given these assumptions, acquisition of a hydrological model for the Delta would be beneficial in further examination of the variables affecting treatment efficacy.
The Egeria tool proved to be an effective intermediary between exported data from Biobase and the final map products, automating and reducing the processing time. The limitation to the tool is raster cells from both pre- and post-treatment maps must overlap to provide a change value , which is no fault of the tool but leads to the consideration of standardizing the hydroacoustic surveys to assure that both pre- and post- treatment sites follow the same mapping regime.
Considering future applications, hyperspectral
imagery has been used for the past decade to map aquatic vegetation in the
Delta ( Mulitsch and Ustin 2003 ; Santos
et al. 2009 ). I believe our
quantitative hydroacoustic data and map products will
prove useful for comparison with hyperspectral data, and validating the
comparisons with field surveys to determine the appropriate strategy to use
with each technology.
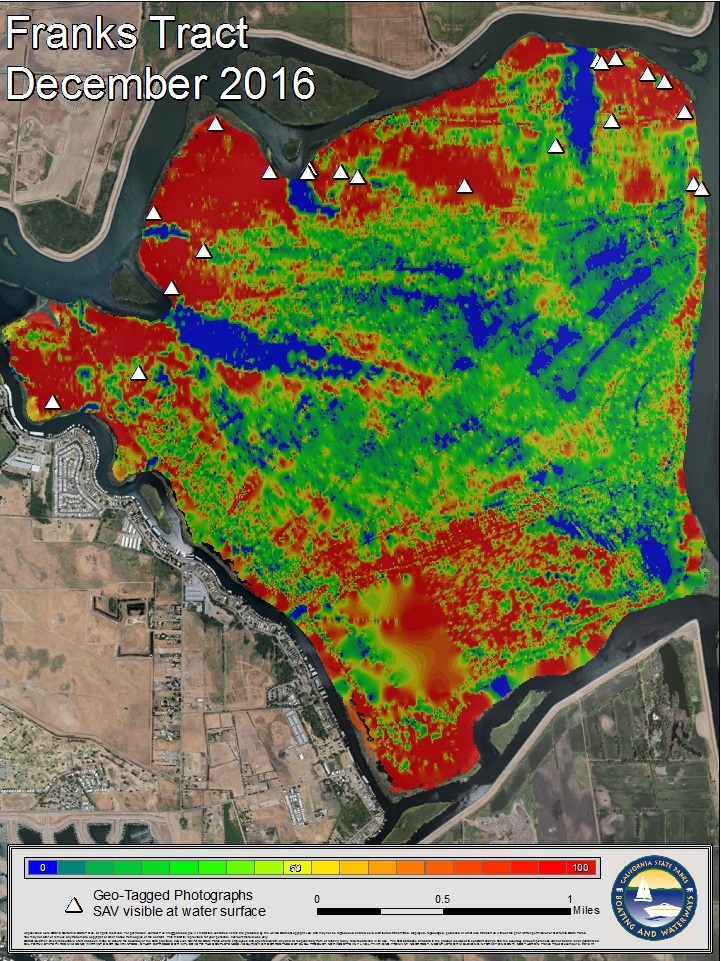
Figure 5. Geo-tagged photos
taken in Franks Tract (Sites 173,174, & 175) where SAV was visible
at or just below the
surface and corresponded with high biovolume
(>80%).
DISCLAIMER
Unpublished work ©2016 California State Parks, all rights reserved. For permission, contact PubInfo@parks.ca.gov. All materials contained herein are protected by the United States Copyright Law and may not be reproduced, shared, sold, distributed, transmitted, displayed, repackaged, published or otherwise transferred without the prior written permission of California State Parks. You may not alter or remove any trademark, copyright or other notice from copies of the content. This material is provided for your personal, non-commercial use only. Data Disclaimer: Every reasonable effort has been made to assure the accuracy of the data provided, however, California State Parks and its employees and agents disclaim any and all responsibility from or relating to any results obtained in its use. The GIS database and data in the product is subject to constant change and the accuracy and completeness cannot be and is not guaranteed. CALIFORNIA STATE PARKS MAKES NO WARRANTIES OR GUARANTEES, EITHER EXPRESSED OR IMPLIED AS TO THE COMPLETENESS, ACCURACY, OR CORRECTNESS OF SUCH PRODUCT, NOR ACCEPTS ANY LIABILITY, ARISING FROM ANY INCORRECT, INCOMPLETE OR MISLEADING INFORMATION CONTAINED THEREIN.
Sources of Materials
ESRI 2011. ArcGIS Desktop: Release 10.4.1 Redlands, CA: Environmental Systems Research Institute.
Lowrance high-definition system consumer echosounder, Lowrance,
12000 E. Skelly Dr., Tulsa, OK 74128. www.lowrance.com
Navico BioBase, Navico Inc., 2800 Hamline Ave. N #223, Roseville, MN 55113. www.cibiobase.com
Literature Cited
CALIFORNIA DEPARTMENT OF BOATING AND WATERWAYS. (2001). Environmental Impact Report for the Egeria densa Control Program. CDBW, Sacramento, California.
Mulitsch, M., and S.L. Ustin. (2003). Mapping invasive plant species in the Sacramento-San Joaquin Delta region using hyperspectral imagery. Report to the California.
Radomski, P., and B.V. Holbrook. (2015). A comparison of two hydroacoustic methods for estimating submerged macrophyte distribution and abundance: a cautionary note. Journal of Aquatic Plant Management.
Santos, M. J.,L.W. Anderson, and S.L. Ustin. (2011). Effects of invasive species on plant communities: an example using submersed aquatic plants at the regional scale. Biological Invasions, 13(2), 443-457.
Santos, M. J., S. Khanna, E.L. Hestir, M.E. Andrew, S.S. Rajapakse, J.A. Greenberg, and S. L. Ustin. (2009). Use of hyperspectral remote sensing to evaluate efficacy of aquatic plant management. Invasive Plant Science and Management, 2(3), 216-229.